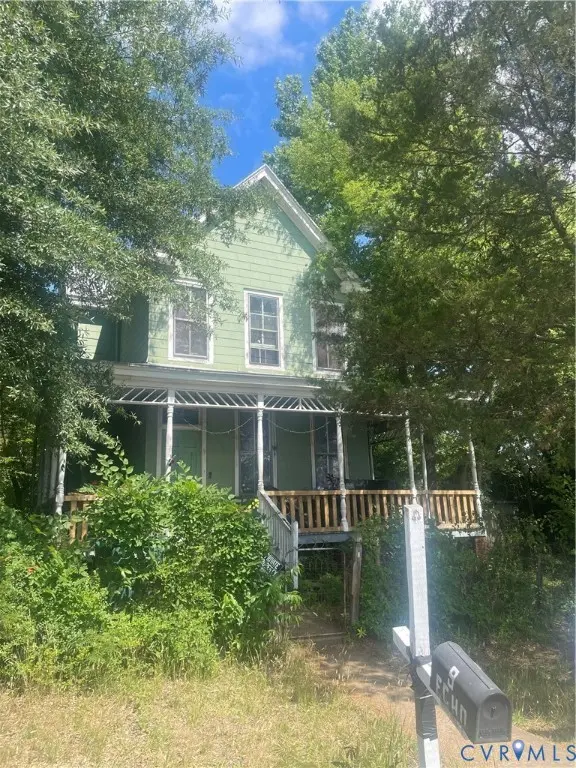
9 Echo Ave · Montrose, VA
Flood risk 1/10 · Minimal
- FEMA flood zone
- X (unshaded)
- Chance of flooding over 30 yrs
- 0.0%
- Est. flood insurance / yr
- $507 – $1,088
Fire risk 1/10 · Minimal
- Est. fire insurance / yr
- $666 – $1,236
Heat risk 8/10 · Major
- Hot days now (above 106°F)
- 7 days/yr
- Hot days in 30 yrs
- 16 days/yr
Wind risk 6/10 · Moderate
- Chance of severe wind over 30 yrs
- 27.0%
Air-quality risk 2/10 · Minimal
- Unhealthy air days now
- 1 days/yr
- Unhealthy air days in 30 yrs
- 2 days/yr
Risk factors via First Street. Map © Google.
Why this score? — see what drove the B grade
The composite is a weighted blend of 9 inputs, each scored 0–100. Each bar is that input's sub-score; the figure is the points it added to the 100-point composite (weight × sub-score).
- Cash flow +26.0/30.0
- ARV discount +15.0/15.0
- DSCR +8.7/10.0
- 1% rule +6.2/10.0
- Schools +4.9/10.0
- Rent growth +4.1/5.0
- Livability +3.8/5.0
- Condition / age +2.5/5.0
- Appreciation +0.0/10.0
$200,000
🖨 Deal sheet 📄 Offer letter ✓ Due diligence
Listing remarks
Strong investment opportunity on a spacious . 48-acre lot in a rapidly developing area of Richmond. This 3-bedroom, 1.5-bath home offers approximately 1,848 sq ft with a solid layout and excellent potential for renovation or value-add improvements. Property features a metal roof, off-street parking, and a large yard, providing a great footprint for redesign or repositioning. Surrounded by renovated homes with significantly higher resale values, this is an ideal project for investors looking to capture strong upside. Sold strictly as-is. High-potential property with size, land, and location working in its favor—opportunities like this don’t last long. Showings are available. Sche
Key facts
- Metal roof
- Renovated homes
- Large yard
Tags
Property features AI
Exterior
- Utilities: Public water; Sewer not available
- Home design: 2-story property; Actual year built (details available)
- Construction: Asbestos and frame construction; Metal roof
- Exterior features: Zoned R4
Interior
- Bathrooms: 1 full bathroom with tub (second level); 1 full bathroom with tub and shower (basement); 2 half bathrooms (one on first level, one in basement)
- Heating & cooling: Central air conditioning; Forced air heating with natural gas
- Interior features: Total of 6 rooms; Resale condition
Neighborhood map
What this means for you Summary
Snapshot
- This is a 3-bed/1.5-bath single-family listed at $200k.
Deal economics
- At list price, monthly cash flow is $498 ($6k/yr) — positive.
- The deal already cash-flows at list — no discount required.
- Meets the 1% rule at list price ($2k rent vs $200k).
- Cap rate 9.3% vs local median 4.3% in Montrose — top-decile yield for the area; either an underpriced asset or a hidden risk that comps aren't pricing in. Stress-test before assuming the spread holds.
Location & tenants
- Location reads 75/100 on livability (#129 in VA, #4,169 nationally) — a middle-class / working-renter tenant base. Strengths: commute A+, cost of living A+, housing A-; Watch: employment D+, schools D-, amenities F.
- Henrico County Public School District (suburban): math 49% / reading 64% proficiency, ranked #68 of 131 in VA (top 52%) — acceptable for families but not a draw, mixed tenant base, ~2y average lease.
- Market conditions: Rents rising fast (+6.4%/yr); 337 active listings in the ZIP; 17 comparable units currently listed for rent nearby; rentals at typical pace (median 17d on market — plan ~3-4 weeks tenant-placement turnaround); 1,826 units permitted in Henrico County in 2024 (785 in 5+ unit buildings).
- At $2,230/mo this rent would consume 48% of the median local household income ($56k/yr) (locally 3530% of renters already pay >50% of income on rent) — very limited rent-growth headroom before tenants either downsize or default.
Forward outlook
- Local home prices are declining (-3.0%/yr); year-one equity from $1k of loan paydown is wiped out by about $6k of value loss. Plan a longer hold.
- Henrico County population projected at +21% by 2050 — long-run rental-demand tailwind backs the buy-and-hold thesis.
- At projected returns (-3.0% appreciation + 6.4% rent growth), your $56k cash investment doubles in ~8 years — after that, you're playing with house money.
Negotiation context
- Only 9 days on market — expect competitive offers; lowballing is unlikely to land.
- 4 sale attempts since 21y ago with the ask held roughly flat each time — persistent listings suggest the price (not the market) is what's stuck; bring a comps-based counter.
Risks & watch-outs
- Watch-outs: built in 1903 — expect roof / HVAC / electrical / plumbing capex.
- Climate carrying-cost: major wind risk, 27% chance of damaging wind over 30y; extreme-heat days projected 7→16/yr by 2055 (HVAC capex compounding) — expect insurance premiums to compound above CPI over the hold.
Questions for the listing agent
- Built in 1903 — when were the roof, HVAC, electrical panel, plumbing, and water heater last replaced?
- Is there a deadline driving the sale (1031 exchange, divorce, estate, relocation)? That informs how much negotiation room exists.
- Schools are D-rated, which usually means shorter tenancies and higher turnover. Who's the typical renter profile here, and what's been the actual vacancy rate?
- What's the average days-on-market for RENTAL listings here right now (not sales)? A rising rental-DOM trend means longer vacancies and softer asking-rent achievability than the comps imply.
- What's the recent tenant-quality profile in this submarket — average credit score on applications, eviction rate, late-payment / NSF rate, and stable-employment percentage? A property-management company in the area should have these aggregated.
- How much new for-sale + rental construction is in the pipeline within 1–3 miles? Heavy new supply typically softens prices + rents 12–24 months out; constrained supply supports both.
Investment metrics
- 1% rule
- 1.12% ✓
- Cap rate
- 9.28%
- Cash-on-cash
- 10.66%
- DSCR
- 1.47
- GRM
- 7.5
CMA / ARV
- ARV (on-the-fly)
- $362,208
- Comps found
- 10
Show comp detail 10 sales within ~0.75 mi
| Address | Dist | Beds/Ba | Sqft | Sold | Price | $/sf | Match |
|---|---|---|---|---|---|---|---|
| 121 Echo Ave | 0.13mi | 3/2.5 | 1,942 (+5%) | 2mo | $380,000 | $196 | 80 |
| 2109 Glenwood Range Dr | 0.59mi | 3/2.5 | 1,823 (-1%) | 4mo | $423,885 | $233 | 62 |
| 3900 Elmswell Dr | 0.46mi | 4/2.5 (+1) | 1,865 (+1%) | 10mo | $330,000 | $177 | 59 |
| 20 Echo Ave | 0.04mi | 4/2.5 (+1) | 2,016 (+9%) | 23mo | $355,000 | $176 | 55 |
| 500 Battersea Ln | 0.59mi | 4/2.5 (+1) | 1,838 (-0%) | 15mo | $370,000 | $201 | 50 |
| 501 Stone Dale Dr | 0.64mi | 3/2.5 | 1,960 (+6%) | 8mo | $369,895 | $189 | 49 |
| 517 Bressingham Dr | 0.57mi | 4/2.5 (+1) | 2,015 (+9%) | 0mo | $395,000 | $196 | 49 |
| 625 Robcurn Dr | 0.68mi | 3/1.5 | 1,964 (+6%) | 12mo | $346,900 | $177 | 48 |
| 4306 2nd St | 0.64mi | 3/2.5 | 1,668 (-10%) | 14mo | $345,000 | $207 | 38 |
| 416 Kings Reach Rd | 0.44mi | 4/3.0 (+1) | 2,116 (+14%) | 17mo | $360,000 | $170 | 30 |
Match score weights: distance 35% · size 25% · config 20% · recency 20%. Top-matched comps best support the ARV.
Projected returns pro-forma
-3.0% appreciation · 6.38% rent growth · sell at horizon
- IRR
- 3.2%
- Equity multiple
- 1.13×
- Total profit
- $7,089
- Equity at exit
- $29,821
- IRR
- 15.6%
- Equity multiple
- 2.45×
- Total profit
- $81,326
- Equity at exit
- $17,292
Cash invested: $56,000 (down + closing). Projections, not guarantees.
Landlord ↔ Tenant lean methodology
- Overall (STATE)
- 55 Moderately Landlord-Leaning
- State Virginia
- 55 Moderately Landlord-Leaning · D+2
- County
- — inherits STATE
- City
- — inherits STATE
ZIP-level market 23223
- Rents YoY
- 6.4%
- Active inventory
- 337
- Price-to-rent
- 7.5×
Monthly cashflow live
- Estimated rent
- $2,230 high interval (Pro) →
- Mortgage (P&I)
- −$1,049
- Tax from tax record
- −$132 /mo · $1,587/yr
- Insurance
- −$83
- HOA
- −$0
- Vacancy / Maint / Mgmt
- −$468
- Net cashflow
- $498
Break-even live
UW: 25.0% down · 7.5% · 30yr · 1.5% tax · 5.0% vac · 8.0% maint · 8.0% mgmt
Financing live
Cash to close
- Down payment
- $50,000
- Closing costs
- $6,000
- Reserves months
- —
- Total cash needed
- —
Loan-product check · same deal, 3 products live
Conventional
25% down · 7.5% · 30yr
- Down + closing
- —
- Monthly P&I
- —
- Monthly cashflow
- —
- DSCR
- —
- Eligible?
- —
Personal DTI + credit; lowest rate.
DSCR
20% down · 8.5% · 30yr
- Down + closing
- —
- Monthly P&I
- —
- Monthly cashflow
- —
- DSCR
- —
- Eligible?
- —
No personal income docs; deal must DSCR.
Hard money
10% down · 12.0% · 12mo
- Down + closing
- —
- Monthly P&I
- —
- Monthly cashflow
- —
- DSCR
- —
- Eligible?
- —
Short-term bridge; refi at stabilization.
Rent comps 17 comps
| Address | Beds | Baths | Sqft | Rent | $/sqft | DOM | Units | Dist |
|---|---|---|---|---|---|---|---|---|
| 1404 N 30th St Richmond, VA | 3.0 | 2.5 | 1700 | $2,195 | $1.29 | 4d | 1 | 1.10mi |
| 1408 N 29th St Richmond, VA | 2.0 | 1.0 | 1528 | $1,150 | $0.75 | 20d | 1 | 1.12mi |
| 3018 S St Richmond, VA | 3.0 | 2.5 | 1786 | $2,645 | $1.48 | 43d | 1 | 1.12mi |
| 2914 R St Richmond, VA | 2.0 | 1.0 | 1250 | $1,500 | $1.20 | 23d | 1 | 1.23mi |
| 2213 Capp Rd Richmond, VA | 3.0 | 2.0 | 1572 | $2,200 | $1.40 | 16d | 1 | 1.24mi |
| 3102 P St Unit B Richmond, VA | 2.0 | 2.5 | 1313 | $1,995 | $1.52 | 4d | 1 | 1.31mi |
| 2820 Q St Richmond, VA | 3.0 | 2.0 | 1523 | $2,195 | $1.44 | 4d | 1 | 1.33mi |
| 1221 N 26th St Richmond, VA | 3.0 | 2.5 | 1900 | $2,700 | $1.42 | 23d | 1 | 1.34mi |
| 1107 N 27th St Richmond, VA | 3.0 | 3.5 | 1792 | $2,600 | $1.45 | 4d | 1 | 1.37mi |
| 811 N 33rd St Unit A Richmond, VA | 3.0 | 2.0 | 1315 | $1,900 | $1.44 | 4d | 1 | 1.38mi |
| 811 N 33rd St Unit A Richmond, VA | 3.0 | 2.0 | 1315 | $1,900 | $1.44 | 16d | 1 | 1.38mi |
| 1427 N 22nd St Richmond, VA | 3.0 | 2.5 | 1764 | $2,700 | $1.53 | 43d | 1 | 1.40mi |
| 3903 Dominion Townes Cir Unit 1 Richmond, VA | 3.0 | 2.5 | 1936 | $3,100 | $1.60 | 1d | 1 | 1.43mi |
| 1308 N 23rd St Richmond, VA | 3.0 | 2.5 | 2052 | $2,900 | $1.41 | 16d | 1 | 1.44mi |
| 2209 Fairmount Ave Richmond, VA | 3.0 | 2.0 | 1652 | $2,500 | $1.51 | 43d | 1 | 1.48mi |
| 1614 N 19th St Richmond, VA | 4.0 | 2.0 | 1584 | $2,395 | $1.51 | 4d | 1 | 1.49mi |
| 901 N 27th St Apt 1 Richmond, VA | 4.0 | 1.0 | 1240 | $2,000 | $1.61 | 16d | 1 | 1.50mi |
Listing history 8 events
-
2026-06-17status $200,000 Pending 9 DOM
-
2026-06-17days on market $200,000 Active 9 DOM
-
2026-06-16days on market $200,000 Active 8 DOM
-
2026-06-15days on market $200,000 Active 7 DOM
-
2026-06-13remarks 687-char remark
-
2026-06-13days on market $200,000 Active 5 DOM
-
2026-06-09remarks 658-char remark
-
2026-06-09$200,000 Active 1 DOM
ⓘ Source: listings_history table (triggers on properties + properties_extension) + one-shot
backfill from property_details.listing_events for pre-trigger history.
Tax reassessment forecast VA · Resets to sale price
- Current annual tax
- $1,587 · $132/mo
- Projected year-2 tax
- $1,640 · $137/mo
- Expected delta
- +$53/yr (+$4/mo · 3.3%)
ⓘ Screening estimate from a state-policy table — verify with the county assessor before closing.
Climate risk First Street
- Flood 1/10 Low FEMA zone X (unshaded) · 0% chance over 30 yrs
- Wildfire 1/10 Low
- Heat 8/10 Severe 7 d/yr ≥106°F today · 16 d/yr by 30 yrs out
- Wind 6/10 Major 27% chance of damaging wind over 30 yrs
- Air quality 2/10 Low 1 unhealthy d/yr today · 2 by 30 yrs out
Nearby sold comps map
Loading sold comps map…
Walkable amenities ~0.75 mi
Loading nearby amenities…
Taxation est. · year 1
- Rental income
- $26,765
- − Mortgage interest
- −$11,203
- − Property taxes
- −$1,587
- − Insurance
- −$1,000
- − Repairs & maintenance
- −$2,141
- − Management
- −$2,141
- − Depreciation
- −$5,818
- Taxable income
- $2,874
- Est. tax owed @ 24.0%
- −$690
- After-tax cash flow
- $5,282/yr
For passive investors: Depreciation is non-cash, so a rental often shows a tax loss while cash-flowing — sheltering income. Rental losses are passive: they offset passive income freely, and up to $25,000/yr can offset ordinary (W-2) income if you actively participate and your MAGI is under $100k (phasing out to $0 by $150k); unused losses carry forward. On sale, claimed depreciation is recaptured at up to 25%, and gains may owe capital-gains tax (a 1031 exchange can defer both). Figures are a year-1 estimate at your 24.0% rate — not tax advice; consult a CPA.
Schools (NCES district)
- District
- Henrico County Public School District
- NCES district ID
- 5101890
- Math proficiency
- 49% ▼ -32.00%
- Reading proficiency
- 64% ▼ -12.00%
- Median HH income
- $61,854
- Composite
- 49.25/100
- National rank
- #2031
- State rank
- #68 of 131 in VA
Livability — Montrose
- Score
- 75/100
- State rank
- #129
- US rank
- #4169
Category grades
Schools grade is shown separately in the Schools card above.
Census & demographics
- County
- Henrico County · 334,490 people
- Metro
- Richmond, VA
- Population (ZIP)
- 54,659
- Household income
- $55,731
- Rent vs Own
- Severe rent burden
- 3530.0
Population outlook (Henrico County) Hauer SSP2
- Today (2025)
- 365,885 people
- By 2030
- 384,255 · +5.0%
- By 2040
- 416,688 · +13.9%
- By 2050
- 442,376 · +20.9%
- By 2075
- 488,037 · +33.4%
- By 2100
- 487,430 · +33.2%
Race, ethnicity, and origin ACS 2023
- Neighborhood character
- Predominantly Black (71%)
- Race & ethnicity
- Black 71% White 19% Two or more races 5% Hispanic / Latino 5%
- Common ancestry
- Romanian 1% Lithuanian 1% Slovak 1%
- Foreign-born
- 4% · Canada
- Languages at home
- 93% English-only · Spanish 4% French/Haitian/Cajun 1% Other Indo-European 1%
Political lean MEDSL · Henrico
- 2024 margin
- Strong D (+28.9) · D 63.7% · R 34.8% · Other 1.5%
- 2008→2024 swing
- +16.6pp toward D · 2008: 12.2pp · 2024: 28.9pp
- All cycles
- 2024: D+28.9 2020: D+29.0 2016: D+21.0 2012: D+11.7 2008: D+12.2
Not yet ingested
- Civics
- —
Market trends
- HPI YoY
- ▼ -257.81%
- Current HPI
- 324.0589
- Rent YoY
- ▲ 6.38%
- Metro
- Richmond, VA
- State GDP YoY
- ▲ 2.40%
- F500 in state
- 50
Industry mix (Fortune 500 HQ in VA)
| Industry | F500 HQs | Revenue |
|---|---|---|
| Aerospace / Defense | 4 | $236B |
|
||
| Technology / Defense | 3 | $32B |
|
||
| Financial Services | 2 | $176B |
|
||
| Utilities | 2 | $27B |
|
||
| Insurance | 2 | $25B |
|
||
| Technology | 2 | $15B |
|
||
Price history
+479.7% since first listed12 events — show timeline
- 2026-06-08 Listed $200,000 CVRMLS
- 2023-09-11 Sold (Public Records) $175,500 Public Records
- 2023-09-11 Sold (MLS) $175,500 CVRMLS
- 2023-09-11 Sold (MLS) $175,500 CVRMLS
- 2023-06-12 Listing Removed — CVRMLS
- 2023-05-31 Listed $180,000 CVRMLS
- 2005-06-30 Sold (Public Records) $131,000 Public Records
- 2005-06-30 Sold (MLS) $131,000 CVRMLS
- 2005-06-30 Sold (MLS) $131,000 CVRMLS
- 2005-06-06 Listed $129,950 CVRMLS
- 2005-06-06 Listed $129,950 CVRMLS
- 1995-10-01 Sold (Public Records) $34,500 Public Records
Property tax history
+2.8%/yrLatest (2025): $1,587 · +3.8% YoY. Source: county tax records.
Cash-flow waterfall
monthlySold comps — $/sqft
last 12 mo · ≤1 miLoading sold comps…