5028 County Road 27 · Sylvania, AL
Flood risk 1/10 · Minimal
- FEMA flood zone
- X (unshaded)
- Chance of flooding over 30 yrs
- 0.0%
- Est. flood insurance / yr
- $507 – $1,088
Fire risk 4/10 · Minor
- Est. fire insurance / yr
- $916 – $1,700
Heat risk 4/10 · Minor
- Hot days now (above 105°F)
- 7 days/yr
- Hot days in 30 yrs
- 19 days/yr
Wind risk 4/10 · Minor
- Chance of severe wind over 30 yrs
- 17.0%
Air-quality risk 2/10 · Minimal
- Unhealthy air days now
- 2 days/yr
- Unhealthy air days in 30 yrs
- 2 days/yr
Risk factors via First Street. Map © Google.
Why this score? — see what drove the D grade
The composite is a weighted blend of 9 inputs, each scored 0–100. Each bar is that input's sub-score; the figure is the points it added to the 100-point composite (weight × sub-score).
- ARV discount +15.0/15.0
- Appreciation +10.0/10.0
- Cash flow +5.1/30.0
- Livability +3.2/5.0
- Rent growth +2.5/5.0
- Condition / age +2.5/5.0
- Schools +2.3/10.0
- 1% rule +0.8/10.0
- DSCR +0.0/10.0
$159,900
🖨 Deal sheet 📄 Offer letter ✓ Due diligence
Listing remarks MLS
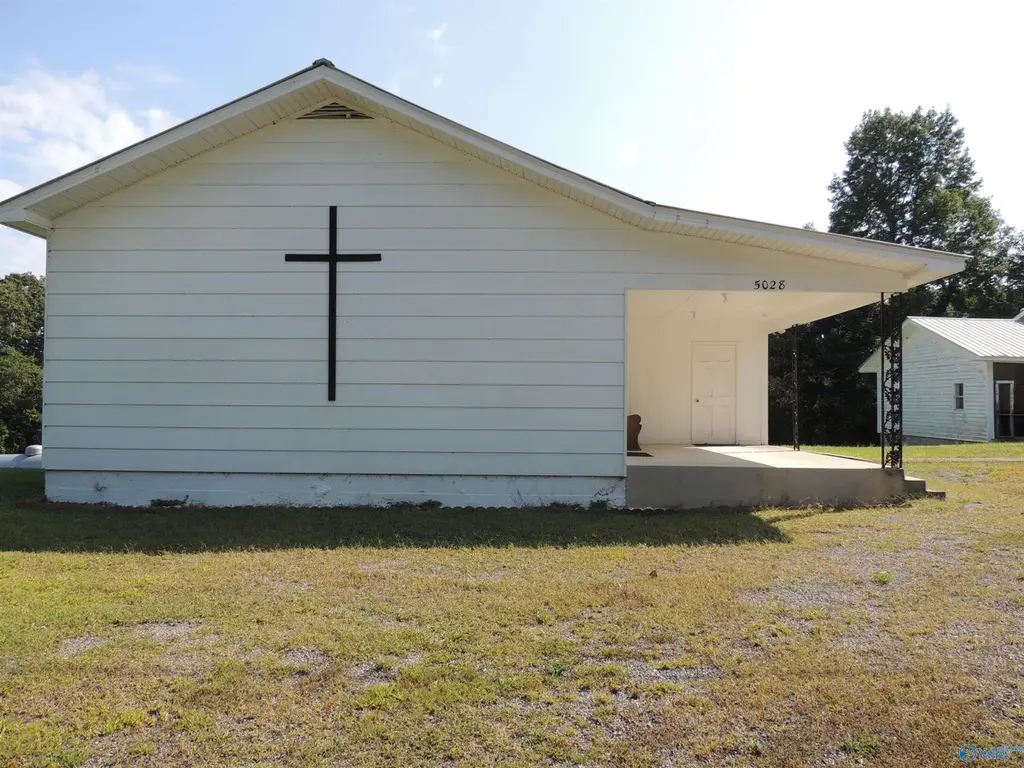
Peaceful!!! This unique property has served the community well for years as a sweet little beacon of light and hope on Sand Mountain. It could still be a great opportunity to do so as a church with parsonage housing; however, it could also serve as two homes (as the church could easily be converted into a house), a home and guest house or mother-in-law quarters, or rental properties, etc. There are many possibilities! Located in a beautiful area, this property has so much to offer.
Key facts
- 0.76 acre lot
- Parking
- Listed 278 days
Neighborhood map
What this means for you Summary
Snapshot
- This is a 3-bed/1.0-bath single-family listed at $160k.
Deal economics
- At list price, monthly cash flow is $-366 ($-4k/yr) — negative.
- To cash-flow at today's rent, offer at most $107k (33.2% below list).
- To meet the 1% rule (rent ≥ 1% of price), the offer needs to be $94k (41.5% below list).
- Recommended offer: $94k (41.5% below list) — sets the bar for 1% rule.
Location & tenants
- Location reads 63/100 on livability (#189 in AL) — a middle-class / working-renter tenant base. Strengths: crime A+, cost of living A+; Watch: schools D, employment D, amenities F.
- Dekalb County (rural): math 18% / reading 37% proficiency, ranked #82 of 129 in AL (top 64%) — low school quality limits family demand, transient renter base, plan for 1-2y turnover.
- Market conditions: 47 active listings in the ZIP; 49 units permitted in DeKalb County in 2024 (0 in 5+ unit buildings).
Forward outlook
- In year one you build about $17k of equity ($1k loan paydown + $16k appreciation (10.0% local appreciation)).
- DeKalb County population projected to shrink 8% by 2050 — rents likely to lag national; underwrite the cash flow, not the appreciation.
- By year 3, paydown + projected appreciation supports a ~$43k cash-out refi (75% LTV) — recoverable capital for the next deal without selling this one.
Negotiation context
- It's been on market 279 days — a 12% lower offer ($141k) is reasonable based on typical stale-listing flexibility.
Questions for the listing agent
- What do current leases actually rent for vs. the listed asking? Can we see a recent rent roll and the last 12 months of T-12 income?
- It's been on market 279 days. Have you received any prior offers? Is the seller open to a 42% concession, seller financing, or rate buy-down credit?
- Why hasn't it sold? Are there any deal-killer items the seller is aware of (foundation, flood, title, zoning, code violations)?
- Is there a deadline driving the sale (1031 exchange, divorce, estate, relocation)? That informs how much negotiation room exists.
- Schools are D-rated, which usually means shorter tenancies and higher turnover. Who's the typical renter profile here, and what's been the actual vacancy rate?
- The area grade is low — what's the realistic commute time and amenity access for the typical tenant pool here? Any planned neighborhood developments (good or bad) we should know about?
- What's the average days-on-market for RENTAL listings here right now (not sales)? A rising rental-DOM trend means longer vacancies and softer asking-rent achievability than the comps imply.
- What's the recent tenant-quality profile in this submarket — average credit score on applications, eviction rate, late-payment / NSF rate, and stable-employment percentage? A property-management company in the area should have these aggregated.
- How much new for-sale + rental construction is in the pipeline within 1–3 miles? Heavy new supply typically softens prices + rents 12–24 months out; constrained supply supports both.
Investment metrics
- 1% rule
- 0.58% ✗
- Cap rate
- 3.54%
- Cash-on-cash
- -9.82%
- DSCR
- 0.56
- GRM
- 14.3
CMA / ARV
- ARV (median comp)
- $200,997
- List price
- $159,900
- Delta
- -20.45%
- Verdict
- UNDERPRICED
- Comps
- 6 within 2.0 mi
Projected returns pro-forma
10.0% appreciation · 3.0% rent growth · sell at horizon
- IRR
- 17.4%
- Equity multiple
- 2.42×
- Total profit
- $63,766
- Equity at exit
- $144,051
- IRR
- 16.4%
- Equity multiple
- 5.60×
- Total profit
- $206,157
- Equity at exit
- $310,651
Cash invested: $44,772 (down + closing). Projections, not guarantees.
Landlord ↔ Tenant lean methodology
- Overall (STATE)
- 90 Strongly Landlord-Friendly
- State Alabama
- 90 Strongly Landlord-Friendly · R+15
- County
- — inherits STATE
- City
- — inherits STATE
ZIP-level market 35968
- Home prices YoY
- 6.0%
- Active inventory
- 47
- Price-to-rent
- 14.3×
Monthly cashflow live
- Estimated rent
- $935 medium interval (Pro) →
- Mortgage (P&I)
- −$839
- Tax est. 1.5%
- −$200 /mo · $2,398/yr
- Insurance
- −$67
- HOA
- −$0
- Vacancy / Maint / Mgmt
- −$196
- Net cashflow
- $-366
Break-even live
UW: 25.0% down · 7.5% · 30yr · 1.5% tax · 5.0% vac · 8.0% maint · 8.0% mgmt
Financing live
Cash to close
- Down payment
- $39,975
- Closing costs
- $4,797
- Reserves months
- —
- Total cash needed
- —
Loan-product check · same deal, 3 products live
Conventional
25% down · 7.5% · 30yr
- Down + closing
- —
- Monthly P&I
- —
- Monthly cashflow
- —
- DSCR
- —
- Eligible?
- —
Personal DTI + credit; lowest rate.
DSCR
20% down · 8.5% · 30yr
- Down + closing
- —
- Monthly P&I
- —
- Monthly cashflow
- —
- DSCR
- —
- Eligible?
- —
No personal income docs; deal must DSCR.
Hard money
10% down · 12.0% · 12mo
- Down + closing
- —
- Monthly P&I
- —
- Monthly cashflow
- —
- DSCR
- —
- Eligible?
- —
Short-term bridge; refi at stabilization.
Listing history 17 events
-
2026-06-19days on market $159,900 Active 279 DOM
-
2026-06-18days on market $159,900 Active 278 DOM
-
2026-06-17days on market $159,900 Active 277 DOM
-
2026-06-16days on market $159,900 Active 276 DOM
-
2026-06-15days on market $159,900 Active 275 DOM
-
2026-06-14days on market $159,900 Active 273 DOM
-
2026-06-12days on market $159,900 Active 272 DOM
-
2026-06-09days on market $159,900 Active 269 DOM
-
2026-06-08days on market $159,900 Active 268 DOM
-
2026-06-07days on market $159,900 Active 267 DOM
-
2026-06-07days on market $159,900 Active 266 DOM
-
2026-06-04days on market $159,900 Active 263 DOM
-
2026-06-02days on market $159,900 Active 262 DOM
-
2026-06-01days on market $159,900 Active 261 DOM
-
2026-05-31days on market $159,900 Active 260 DOM
-
2026-05-31days on market $159,900 Active 259 DOM
-
2025-09-13$159,900 Active 486-char remark
Show marketing remark (486 chars)
Peaceful!!! This unique property has served the community well for years as a sweet little beacon of light and hope on Sand Mountain. It could still be a great opportunity to do so as a church with parsonage housing; however, it could also serve as two homes (as the church could easily be converted into a house), a home and guest house or mother-in-law quarters, or rental properties, etc. There are many possibilities! Located in a beautiful area, this property has so much to offer.
ⓘ Source: listings_history table (triggers on properties + properties_extension) + one-shot
backfill from property_details.listing_events for pre-trigger history.
Climate risk First Street
- Flood 1/10 Low FEMA zone X (unshaded) · 0% chance over 30 yrs
- Wildfire 4/10 Moderate
- Heat 4/10 Moderate 7 d/yr ≥105°F today · 19 d/yr by 30 yrs out
- Wind 4/10 Moderate 17% chance of damaging wind over 30 yrs
- Air quality 2/10 Low 2 unhealthy d/yr today · 2 by 30 yrs out
Nearby sold comps map
Loading sold comps map…
Walkable amenities ~0.75 mi
Loading nearby amenities…
Taxation est. · year 1
- Rental income
- $11,220
- − Mortgage interest
- −$8,957
- − Property taxes
- −$2,398
- − Insurance
- −$800
- − Repairs & maintenance
- −$898
- − Management
- −$898
- − Depreciation
- −$4,652
- Taxable loss
- −$7,382
- Est. tax savings @ 24.0%
- +$1,772
- After-tax cash flow
- $-2,625/yr
For passive investors: Depreciation is non-cash, so a rental often shows a tax loss while cash-flowing — sheltering income. Rental losses are passive: they offset passive income freely, and up to $25,000/yr can offset ordinary (W-2) income if you actively participate and your MAGI is under $100k (phasing out to $0 by $150k); unused losses carry forward. On sale, claimed depreciation is recaptured at up to 25%, and gains may owe capital-gains tax (a 1031 exchange can defer both). Figures are a year-1 estimate at your 24.0% rate — not tax advice; consult a CPA.
Schools (NCES district)
- District
- Dekalb County
- NCES district ID
- 0101140
- Math proficiency
- 18% ▼ -19.00%
- Reading proficiency
- 37% ▲ 2.00%
- Median HH income
- $36,655
- Composite
- 22.78/100
- National rank
- #8023
- State rank
- #82 of 129 in AL
Livability — Sylvania
- Score
- 63/100
- State rank
- #189
- US rank
- #15565
Category grades
Schools grade is shown separately in the Schools card above.
Census & demographics
- City population
- 2,376
- Population (ZIP)
- 4,540
Population outlook (DeKalb County) Hauer SSP2
- Today (2025)
- 71,722 people
- By 2030
- 71,373 · -0.5%
- By 2040
- 69,536 · -3.0%
- By 2050
- 66,020 · -8.0%
- By 2075
- 53,325 · -25.7%
- By 2100
- 36,127 · -49.6%
Race, ethnicity, and origin ACS 2023
- Neighborhood character
- Predominantly White (77%)
- Race & ethnicity
- White 77% Hispanic / Latino 12% Black 6% Two or more races 6% Native American 3%
- Hispanic origin (detail)
- Mexican 4%
- Common ancestry
- Serbian 2% Slovak 2% Italian 1%
- Foreign-born
- 5% · Canada
- Languages at home
- 91% English-only · Spanish 8% Other Asian/Pacific 1%
Political lean MEDSL · DeKalb
- 2024 margin
- Solid R (+74.0) · D 12.7% · R 86.7%
- 2008→2024 swing
- -22.7pp toward R · 2008: -51.2pp · 2024: -74.0pp
- All cycles
- 2024: R+74.0 2020: R+69.8 2016: R+69.4 2012: R+54.9 2008: R+51.2
Not yet ingested
- Civics
- —
Market trends
- HPI YoY
- ▲ 15.73%
- Current HPI
- 279.1118
- Rent YoY
- —
- Metro
- —
- State GDP YoY
- ▲ 2.94%
- F500 in state
- 4
Industry mix (Fortune 500 HQ in AL)
| Industry | F500 HQs | Revenue |
|---|---|---|
| Financial Services | 1 | $8B |
|
||
| Healthcare | 1 | $5B |
|
||
Price history
1 event — show timeline
- 2025-09-13 Listed $159,900 VMLS
Cash-flow waterfall
monthlySold comps — $/sqft
last 12 mo · ≤1 miLoading sold comps…