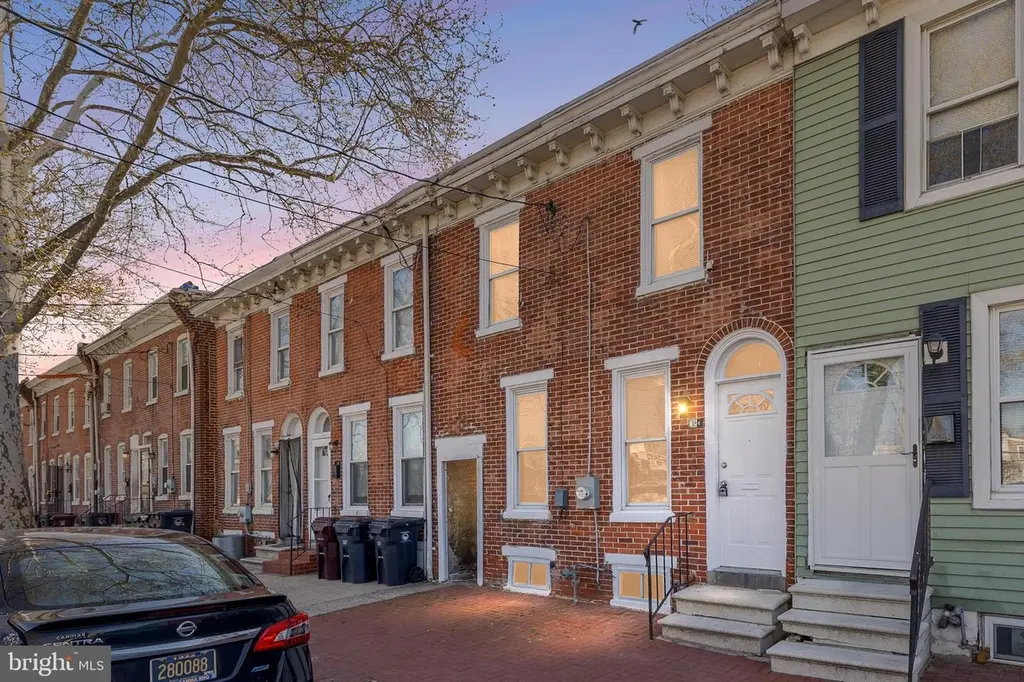
324 S Claymont St · Wilmington, DE
Flood risk 8/10 · Major
- FEMA flood zone
- AE
- Chance of flooding over 30 yrs
- 0.95%
- Est. flood insurance / yr
- $2,026 – $9,024
Fire risk 1/10 · Minimal
- Est. fire insurance / yr
- $476 – $884
Heat risk 8/10 · Major
- Hot days now (above 102°F)
- 7 days/yr
- Hot days in 30 yrs
- 16 days/yr
Wind risk 6/10 · Moderate
- Chance of severe wind over 30 yrs
- 27.0%
Air-quality risk 3/10 · Minor
- Unhealthy air days now
- 3 days/yr
- Unhealthy air days in 30 yrs
- 5 days/yr
Risk factors via First Street. Map © Google.
Why this score? — see what drove the C+ grade
The composite is a weighted blend of 9 inputs, each scored 0–100. Each bar is that input's sub-score; the figure is the points it added to the 100-point composite (weight × sub-score).
- Cash flow +28.8/30.0
- DSCR +10.0/10.0
- 1% rule +6.8/10.0
- ARV discount +5.3/15.0
- Livability +3.2/5.0
- Rent growth +2.9/5.0
- Schools +2.5/10.0
- Condition / age +2.5/5.0
- Appreciation +0.0/10.0
$164,000
🖨 Deal sheet (PDF) 📄 Offer letter ✓ Due diligence
Listing remarks MLS
Seller is offering $5,000 IN SETTLEMENT ASSISTANCE. Modern Living Meets Riverfront Convenience Welcome to 324 S Claymont St, a stunningly reimagined residence where modern style meets urban convenience. This 3-bedroom, 1-bathroom home has been meticulously renovated with a commitment to quality, offering a "turn-key" lifestyle in the heart of the City of Wilmington. The Living Area: Features durable luxury plank flooring and a crisp, modern color palette. Open Concept Dining: The living space flows effortlessly into a spacious dining area, perfect for hosting dinner parties or intimate gatherings. Newly Renovated Kitchen: A true centerpiece featuring sleek white cabinetry, gorgeous countertops, and a full suite of brand-new appliances. The Upper Level: Rest & Refresh The second floor serves as a quiet retreat with three well-appointed bedrooms. Comfort Underfoot: Brand-new carpeting and fresh paint in every room. The Bathroom: A sparkling, newly updated sanctuary featuring modern fixtures and a full-sized bathtub/shower combo. Outdoor Living & Location Private Backyard: Step outside to a rear yard ideal for weekend barbecues, gardening, or a secure space for pets. Unbeatable Location: Enjoy a high-energy lifestyle with incredible walkability. You are steps away from: The Riverfront & Business District Local Breweries & Trendy Restaurants Major Commuter Routes: Instant access to Rt 202 and I-95. Nightlife & Shopping: The best of Wilmington is right at your doorstep. Schedule your private tour today and experience this renovation first-hand!
Key facts
- Private backyard
- Unbeatable location
- Built 1890
Tags
Neighborhood map
What this means for you Summary
Snapshot
- This is a 3-bed/1.0-bath townhouse listed at $164k.
Deal economics
- At list price, monthly cash flow is $89 ($1k/yr) — positive.
- The deal already cash-flows at list — no discount required.
- Meets the 1% rule at list price ($2k rent vs $164k).
- Recommended offer: $154k (6.0% below list) — sets the bar for market timing.
- Cap rate 10.3% vs local median 5.7% in Wilmington — top-decile yield for the area; either an underpriced asset or a hidden risk that comps aren't pricing in. Stress-test before assuming the spread holds.
Location & tenants
- Location reads 64/100 on livability (#52 in DE) — a middle-class / working-renter tenant base. Strengths: cost of living A+, housing A; Watch: employment D+, commute D, crime F.
- Christina School District (suburban): math 22% / reading 33% proficiency, ranked #18 of 26 in DE (top 69%) — low school quality limits family demand, transient renter base, plan for 1-2y turnover.
- Zoned schools: The Bayard School (math 3% / reading 10%, grade F, #102 of 105 statewide, top 97%, 508 students, 0% FRL); Newark High School (math 27% / reading 42%, grade F, #18 of 40 statewide, top 49%, 1,105 students, 0% FRL) — zoned schools average 0% FRL vs 50% district-wide (50 pts lower); this property's tenant base skews higher-income than the district average.
- Market conditions: Rents rising (+1.6%/yr); 75 active listings in the ZIP; 40 comparable units currently listed for rent nearby; rentals at typical pace (median 21d on market — plan ~3-4 weeks tenant-placement turnaround); 1,367 units permitted in New Castle County in 2024 (201 in 5+ unit buildings).
- This rent runs 44% of the median local income ($53k/yr) — at the standard rent-burdened threshold; future hikes will face affordability resistance.
Forward outlook
- Local home prices are declining (-3.0%/yr); year-one equity from $1k of loan paydown is wiped out by about $5k of value loss. Plan a longer hold.
- New Castle County population projected at +9% by 2050 — modest demand growth; plan on rents tracking national, not racing it.
Negotiation context
- It's been on market 71 days — a 6% lower offer ($154k) is reasonable based on typical stale-listing flexibility.
- 3 sale attempts since 11y ago; this cycle's ask has dropped $10k (6%) from the opening price — seller is motivated, your offer sets the floor, not the list.
- Current owner paid $20k; list at $164k implies a 720% gain — meaningful room to come down on a strong offer.
Risks & watch-outs
- Watch-outs: flood insurance adds $460/mo; built in 1890 — expect roof / HVAC / electrical / plumbing capex.
- Climate carrying-cost: in FEMA flood zone AE (mandatory federal flood insurance); major wind risk, 27% chance of damaging wind over 30y; extreme-heat days projected 7→16/yr by 2055 (HVAC capex compounding) — expect insurance premiums to compound above CPI over the hold.
Questions for the listing agent
- It's been on market 71 days. Have you received any prior offers? Is the seller open to a 6% concession, seller financing, or rate buy-down credit?
- Built in 1890 — when were the roof, HVAC, electrical panel, plumbing, and water heater last replaced?
- What's the actual annual flood-insurance premium (NFIP or private), and is the property in a SFHA with mandatory coverage?
- Why hasn't it sold? Are there any deal-killer items the seller is aware of (foundation, flood, title, zoning, code violations)?
- Is there a deadline driving the sale (1031 exchange, divorce, estate, relocation)? That informs how much negotiation room exists.
- Schools are D-rated, which usually means shorter tenancies and higher turnover. Who's the typical renter profile here, and what's been the actual vacancy rate?
- Crime grade is F in this area — have there been break-ins, vandalism, or insurance claims at this property in the last 3 years? What carrier currently insures it and at what premium?
- What's the average days-on-market for RENTAL listings here right now (not sales)? A rising rental-DOM trend means longer vacancies and softer asking-rent achievability than the comps imply.
- What's the recent tenant-quality profile in this submarket — average credit score on applications, eviction rate, late-payment / NSF rate, and stable-employment percentage? A property-management company in the area should have these aggregated.
- How much new for-sale + rental construction is in the pipeline within 1–3 miles? Heavy new supply typically softens prices + rents 12–24 months out; constrained supply supports both.
Investment metrics
- 1% rule
- 1.18% ✓
- Cap rate
- 10.32%
- Cash-on-cash
- 14.37%
- DSCR
- 1.64
- GRM
- 7.1
CMA / ARV
- ARV (median comp)
- $156,319
- List price
- $164,000
- Delta
- 4.91%
- Verdict
- FAIR
- Comps
- 20 within 1.0 mi
Show comp detail 12 sales within ~0.75 mi
| Address | Dist | Beds/Ba | Sqft | Sold | Price | $/sf | Match |
|---|---|---|---|---|---|---|---|
| 434 S Heald St | 0.12mi | 3/2.0 | 1,350 (+2%) | 0mo | $92,500 | $69 | 87 |
| 423 New Castle Ave | 0.11mi | 3/1.0 | 1,348 (+2%) | 7mo | $124,000 | $92 | 86 |
| 310 S Claymont St | 0.03mi | 3/1.0 | 1,250 (-6%) | 5mo | $170,000 | $136 | 85 |
| 326 New Castle Ave | 0.07mi | 3/1.5 | 1,225 (-8%) | 6mo | $150,000 | $122 | 78 |
| 602 Townsend St | 0.24mi | 3/1.0 | 1,150 (-13%) | 0mo | $219,900 | $191 | 66 |
| 426 S Heald St | 0.12mi | 4/3.5 (+1) | 1,475 (+11%) | 2mo | $236,000 | $160 | 59 |
| 408 S Claymont St | 0.06mi | 4/3.5 (+1) | 1,500 (+13%) | 2mo | $240,000 | $160 | 59 |
| 501 E 5th St | 0.66mi | 4/2.5 (+1) | 1,325 (0%) | 0mo | $236,000 | $178 | 58 |
| 706 Bennett St | 0.66mi | 4/1.5 (+1) | 1,325 (0%) | 9mo | $135,000 | $102 | 55 |
| 836 Bennett St | 0.74mi | 3/1.5 | 1,450 (+9%) | 1mo | $229,900 | $159 | 47 |
| 835 Bennett St | 0.75mi | 3/1.5 | 1,450 (+9%) | 4mo | $232,500 | $160 | 44 |
| 910 E Twenty Seventh St | 0.60mi | 4/2.5 (+1) | 1,225 (-8%) | 8mo | $245,000 | $200 | 42 |
Match score weights: distance 35% · size 25% · config 20% · recency 20%. Top-matched comps best support the ARV.
Projected returns pro-forma
-3.0% appreciation · 1.59% rent growth · sell at horizon
- IRR
- -14.4%
- Equity multiple
- 0.49×
- Total profit
- $-23,368
- Equity at exit
- $24,453
- IRR
- -8.6%
- Equity multiple
- 0.50×
- Total profit
- $-22,915
- Equity at exit
- $14,180
Cash invested: $45,920 (down + closing). Projections, not guarantees.
Landlord ↔ Tenant lean methodology
- Overall (STATE)
- 70 Landlord-Friendly
- State Delaware
- 70 Landlord-Friendly · D+7
- County
- — inherits STATE
- City
- — inherits STATE
ZIP-level market 19801
- Rents YoY
- 1.6%
- Active inventory
- 75
- Price-to-rent
- 7.1×
Monthly cashflow live
- Estimated rent
- $1,929 high interval (Pro) →
- Mortgage (P&I)
- −$860
- Tax from tax record
- −$46 /mo · $549/yr
- Insurance
- −$68
- Flood insurance flood zone
- −$460 /mo · $5,525/yr
- HOA
- −$0
- Vacancy / Maint / Mgmt
- −$405
- Net cashflow
- $89
Break-even live
Sensitivity live
| Price | -10% $182 | -5% $136 | +0% $89 | +5% $43 | +10% $-3 |
|---|---|---|---|---|---|
| Rent | -10% $-63 | -5% $13 | +0% $89 | +5% $166 | +10% $242 |
| Rate | -1.0pp $172 | -0.5pp $131 | base $89 | +0.5pp $47 | +1.0pp $4 |
UW: 25.0% down · 7.5% · 30yr · 1.5% tax · 5.0% vac · 8.0% maint · 8.0% mgmt
Financing live
Cash to close
- Down payment
- $41,000
- Closing costs
- $4,920
- Reserves months
- —
- Total cash needed
- —
Loan-product check · same deal, 3 products live
Conventional
25% down · 7.5% · 30yr
- Down + closing
- —
- Monthly P&I
- —
- Monthly cashflow
- —
- DSCR
- —
- Eligible?
- —
Personal DTI + credit; lowest rate.
DSCR
20% down · 8.5% · 30yr
- Down + closing
- —
- Monthly P&I
- —
- Monthly cashflow
- —
- DSCR
- —
- Eligible?
- —
No personal income docs; deal must DSCR.
Hard money
10% down · 12.0% · 12mo
- Down + closing
- —
- Monthly P&I
- —
- Monthly cashflow
- —
- DSCR
- —
- Eligible?
- —
Short-term bridge; refi at stabilization.
Rent comps 40 comps
| Address | Beds | Baths | Sqft | Rent | $/sqft | DOM | Units | Dist |
|---|---|---|---|---|---|---|---|---|
| 606 S Claymont St Wilmington, DE | 2.0 | 1.0 | 1000 | $1,399 | $1.40 | 20d | 1 | 0.23mi |
| 606 S Claymont St Wilmington, DE | 2.0 | 1.0 | 1000 | $1,399 | $1.40 | 18d | 1 | 0.23mi |
| 401 A St Wilmington, DE | 2.0 | 1.0–2.0 | 716 | $2,605 | $3.64 | 0d | 12 | 0.49mi |
| 115 Christina Landing Dr Wilmington, DE | 1.0–2.0 | 1.0–2.0 | 1195 | $2,796 | $2.34 | 0d | 11 | 0.78mi |
| 105 Christina Landing Dr #1105 Wilmington, DE | 2.0 | 2.0 | 1150 | $2,500 | $2.17 | 45d | 1 | 0.80mi |
| 105 Christina Landing Dr #1503 Wilmington, DE | 2.0 | 2.0 | 1025 | $2,500 | $2.44 | 18d | 1 | 0.80mi |
| 105 Christina Landing Dr Wilmington, DE | 2.0 | 2.0 | 1025 | $2,400 | $2.34 | 12d | 1 | 0.80mi |
| 928 Kirkwood St Wilmington, DE | 3.0 | 1.5 | 1150 | $1,700 | $1.48 | 19d | 1 | 0.86mi |
| 1004 N Spruce St Wilmington, DE | 3.0 | 1.5 | 1075 | $1,800 | $1.67 | 20d | 1 | 0.88mi |
| 1026 Bennett St Wilmington, DE | 3.0 | 1.0 | 1125 | $1,685 | $1.50 | 0d | 1 | 0.89mi |
| 605 E 10th St Wilmington, DE | 3.0 | 1.0 | 1200 | $1,850 | $1.54 | 26d | 1 | 0.90mi |
| 517 N Shipley St Wilmington, DE | 2.0 | 1.0–2.0 | 822 | $2,670 | $3.25 | 0d | 15 | 1.00mi |
| 518 E 12th St Wilmington, DE | 2.0 | 1.0 | 875 | $1,425 | $1.63 | 22d | 1 | 1.03mi |
| 225 W 4th St Unit 2 Wilmington, DE | 2.0 | 1.0 | 1000 | $1,599 | $1.60 | 45d | 1 | 1.03mi |
| 801 N Market St Unit 207 Wilmington, DE | 2.0 | 2.0 | 1239 | $1,895 | $1.53 | 7d | 1 | 1.05mi |
| 1124 Clifford Brown Walk Wilmington, DE | 2.0 | 1.0 | 1240 | $1,625 | $1.31 | 45d | 1 | 1.06mi |
| 703 Orange St Wilmington, DE | 1.0–2.0 | 1.0 | 800 | $1,475 | $1.84 | 45d | 1 | 1.07mi |
| 530 Harlan Blvd #519 Wilmington, DE | 2.0 | 2.0 | 1192 | $2,250 | $1.89 | 26d | 1 | 1.09mi |
| 116 W 9th St Wilmington, DE | 1.0–2.0 | 1.0–2.0 | 813 | $2,270 | $2.79 | 0d | 17 | 1.12mi |
| 913 N Market St Wilmington, DE | 1.0–2.0 | 1.0–2.0 | 974 | $1,985 | $2.04 | 45d | 5 | 1.12mi |
| 801 N Orange St Wilmington, DE | 3.0 | 1.0–3.0 | 1118 | $3,991 | $3.57 | 0d | 115 | 1.13mi |
| 331 Justison St Wilmington, DE | 1.0–2.0 | 1.0–2.0 | 859 | $2,205 | $2.57 | 0d | 9 | 1.13mi |
| 212 W 9th St Unit 204 Wilmington, DE | 2.0 | 2.0 | 1671 | $1,745 | $1.04 | 7d | 1 | 1.16mi |
| 212 W 9th St Unit 204 Wilmington, DE | 2.0 | 2.0 | 1671 | $1,795 | $1.07 | 45d | 1 | 1.16mi |
| 507 W 4th St Wilmington, DE | 3.0 | 1.5 | 1075 | $1,800 | $1.67 | 14d | 1 | 1.17mi |
| 228 W 9th St Unit 201 Wilmington, DE | 2.0 | 2.0 | 1031 | $1,695 | $1.64 | 46d | 1 | 1.18mi |
| 839 N Tatnall St Unit 101 Wilmington, DE | 2.0 | 2.0 | 1211 | $1,750 | $1.45 | 7d | 1 | 1.19mi |
| 918 E 17th St Unit 1 Wilmington, DE | 3.0 | 1.0 | 1100 | $1,795 | $1.63 | 0d | 1 | 1.20mi |
| 1001 N Orange St Wilmington, DE | 1.0–2.0 | 1.0–2.0 | 833 | $2,135 | $2.56 | 0d | 61 | 1.22mi |
| 1217 N King St Wilmington, DE | 3.0 | 1.5 | 1300 | $2,145 | $1.65 | 20d | 1 | 1.24mi |
| 617 W 6th St Unit 617 B Wilmington, DE | 3.0 | 1.0 | 1000 | $1,600 | $1.60 | 7d | 1 | 1.27mi |
| 709 Windsor St Unit 3 Wilmington, DE | 2.0 | 1.0 | 980 | $1,500 | $1.53 | 45d | 1 | 1.30mi |
| 711 Windsor St Wilmington, DE | 2.0 | 1.0 | 980 | $1,460 | $1.49 | 45d | 1 | 1.30mi |
| 107 W 13th St Wilmington, DE | 3.0 | 1.5 | 1325 | $1,895 | $1.43 | 45d | 1 | 1.35mi |
| 820 W 7th St Wilmington, DE | 3.0 | 1.0 | 1000 | $1,650 | $1.65 | 45d | 1 | 1.41mi |
| 613 W 10th St Wilmington, DE | 2.0 | 1.0 | 1100 | $1,745 | $1.59 | 45d | 1 | 1.43mi |
| 205 Porter St Wilmington, DE | 2.0 | 1.5 | 1200 | $1,700 | $1.42 | 17d | 1 | 1.43mi |
| 1029 Lancaster Ave Wilmington, DE | 4.0 | 1.5 | 1375 | $1,900 | $1.38 | 26d | 1 | 1.46mi |
| 25 Stroud St Wilmington, DE | 3.0 | 1.0 | 1200 | $1,795 | $1.50 | 5d | 1 | 1.47mi |
| 21 Stroud St Unit 1 Wilmington, DE | 3.0 | 1.5 | 1875 | $1,900 | $1.01 | 45d | 1 | 1.48mi |
Listing history 22 events
-
2026-06-21days on market $164,000 Active 71 DOM
-
2026-06-18days on market $164,000 Active 68 DOM
-
2026-06-17price $164,000 Active 67 DOM
-
2026-06-17days on market $168,000 Active 67 DOM
-
2026-06-16days on market $168,000 Active 66 DOM
-
2026-06-15days on market $168,000 Active 65 DOM
-
2026-06-13days on market $168,000 Active 63 DOM
-
2026-06-13days on market $168,000 Active 62 DOM
-
2026-06-09days on market $168,000 Active 59 DOM
-
2026-06-08days on market $168,000 Active 58 DOM
-
2026-06-07statusdays on market $168,000 Active 57 DOM
-
2026-06-02statusdays on market $168,000 Active Under Contract 54 DOM
-
2026-06-01days on market $168,000 Active 53 DOM
-
2026-05-31days on market $168,000 Active 52 DOM
-
2026-04-28price $168,000 1605-char remark
Show marketing remark (1605 chars)
Seller is offering $5,000 IN SETTLEMENT ASSISTANCE. Modern Living Meets Riverfront Convenience Welcome to 324 S Claymont St, a stunningly reimagined residence where modern style meets urban convenience. This 3-bedroom, 1-bathroom home has been meticulously renovated with a commitment to quality, offering a "turn-key" lifestyle in the heart of the City of Wilmington. The Living Area: Features durable luxury plank flooring and a crisp, modern color palette. Open Concept Dining: The living space flows effortlessly into a spacious dining area, perfect for hosting dinner parties or intimate gatherings. Newly Renovated Kitchen: A true centerpiece featuring sleek white cabinetry, gorgeous countertops, and a full suite of brand-new appliances. The Upper Level: Rest & Refresh The second floor serves as a quiet retreat with three well-appointed bedrooms. Comfort Underfoot: Brand-new carpeting and fresh paint in every room. The Bathroom: A sparkling, newly updated sanctuary featuring modern fixtures and a full-sized bathtub/shower combo. Outdoor Living & Location Private Backyard: Step outside to a rear yard ideal for weekend barbecues, gardening, or a secure space for pets. Unbeatable Location: Enjoy a high-energy lifestyle with incredible walkability. You are steps away from: The Riverfront & Business District Local Breweries & Trendy Restaurants Major Commuter Routes: Instant access to Rt 202 and I-95. Nightlife & Shopping: The best of Wilmington is right at your doorstep. Schedule your private tour today and experience this renovation first-hand!
-
2026-04-09$174,000 Active 1605-char remark
Show marketing remark (1605 chars)
Seller is offering $5,000 IN SETTLEMENT ASSISTANCE. Modern Living Meets Riverfront Convenience Welcome to 324 S Claymont St, a stunningly reimagined residence where modern style meets urban convenience. This 3-bedroom, 1-bathroom home has been meticulously renovated with a commitment to quality, offering a "turn-key" lifestyle in the heart of the City of Wilmington. The Living Area: Features durable luxury plank flooring and a crisp, modern color palette. Open Concept Dining: The living space flows effortlessly into a spacious dining area, perfect for hosting dinner parties or intimate gatherings. Newly Renovated Kitchen: A true centerpiece featuring sleek white cabinetry, gorgeous countertops, and a full suite of brand-new appliances. The Upper Level: Rest & Refresh The second floor serves as a quiet retreat with three well-appointed bedrooms. Comfort Underfoot: Brand-new carpeting and fresh paint in every room. The Bathroom: A sparkling, newly updated sanctuary featuring modern fixtures and a full-sized bathtub/shower combo. Outdoor Living & Location Private Backyard: Step outside to a rear yard ideal for weekend barbecues, gardening, or a secure space for pets. Unbeatable Location: Enjoy a high-energy lifestyle with incredible walkability. You are steps away from: The Riverfront & Business District Local Breweries & Trendy Restaurants Major Commuter Routes: Instant access to Rt 202 and I-95. Nightlife & Shopping: The best of Wilmington is right at your doorstep. Schedule your private tour today and experience this renovation first-hand!
-
2016-05-12historical
-
2016-02-19$49,900
-
2015-09-07soldstatus $20,000 Sold
-
2015-09-04status Under Contract
-
2015-09-04soldstatus $20,000
-
2015-08-22$30,000 Active
ⓘ Source: listings_history table (triggers on properties + properties_extension) + one-shot
backfill from property_details.listing_events for pre-trigger history.
Tax reassessment forecast DE · Partial reset (capped growth)
- Current annual tax
- $549 · $46/mo
- Projected year-2 tax
- $750 · $63/mo
- Expected delta
- +$201/yr (+$17/mo · 36.6%)
ⓘ Screening estimate from a state-policy table — verify with the county assessor before closing.
Climate risk First Street
- Flood 8/10 Severe FEMA zone AE · 95% chance over 30 yrs
- Wildfire 1/10 Low
- Heat 8/10 Severe 7 d/yr ≥102°F today · 16 d/yr by 30 yrs out
- Wind 6/10 Major 27% chance of damaging wind over 30 yrs
- Air quality 3/10 Moderate 3 unhealthy d/yr today · 5 by 30 yrs out
Nearby sold comps map
Loading sold comps map…
Walkable amenities ~0.75 mi
Loading nearby amenities…
Taxation est. · year 1
- Rental income
- $23,148
- − Mortgage interest
- −$9,187
- − Property taxes
- −$549
- − Insurance
- −$6,345
- − Repairs & maintenance
- −$1,852
- − Management
- −$1,852
- − Depreciation
- −$4,771
- Taxable loss
- −$1,407
- Est. tax savings @ 24.0%
- +$338
- After-tax cash flow
- $1,410/yr
For passive investors: Depreciation is non-cash, so a rental often shows a tax loss while cash-flowing — sheltering income. Rental losses are passive: they offset passive income freely, and up to $25,000/yr can offset ordinary (W-2) income if you actively participate and your MAGI is under $100k (phasing out to $0 by $150k); unused losses carry forward. On sale, claimed depreciation is recaptured at up to 25%, and gains may owe capital-gains tax (a 1031 exchange can defer both). Figures are a year-1 estimate at your 24.0% rate — not tax advice; consult a CPA.
Schools (NCES district)
- District
- Christina School District
- NCES district ID
- 1000200
- Math proficiency
- 22% ▼ -12.00%
- Reading proficiency
- 33% ▼ -5.00%
- Median HH income
- $58,838
- Composite
- 24.93/100
- National rank
- #7567
- State rank
- #18 of 26 in DE
Livability — Wilmington
- Score
- 64/100
- State rank
- #52
- US rank
- #14251
Category grades
Schools grade is shown separately in the Schools card above.
Census & demographics
- Census place
- Wilmington, DE
- County
- New Castle County · 483,412 people
- City population
- 173,480
- Metro
- Philadelphia-Camden-Wilmington, PA-NJ-DE-MD
- Population (ZIP)
- 16,327
- Household income
- $52,810
- Rent vs Own
- Severe rent burden
- 919.0
Population outlook (New Castle County) Hauer SSP2
- Today (2025)
- 594,686 people
- By 2030
- 609,164 · +2.4%
- By 2040
- 632,154 · +6.3%
- By 2050
- 649,068 · +9.1%
- By 2075
- 687,771 · +15.7%
- By 2100
- 694,961 · +16.9%
Race, ethnicity, and origin ACS 2023
- Neighborhood character
- Predominantly Black (67%)
- Race & ethnicity
- Black 67% White 15% Hispanic / Latino 9% Two or more races 7% Asian 4%
- Hispanic origin (detail)
- Mexican 3% Puerto Rican 4%
- Common ancestry
- Romanian 1% Slovak 1% Italian 1%
- Foreign-born
- 9% · Canada, China, Vietnam
- Languages at home
- 87% English-only · Spanish 7% Other Indo-European 2% Chinese 1%
Political lean MEDSL · New Castle
- 2024 margin
- Solid D (+32.6) · D 65.5% · R 32.9% · Other 1.6%
- 2008→2024 swing
- -8.1pp toward R · 2008: 40.6pp · 2024: 32.6pp
- All cycles
- 2024: D+32.6 2020: D+37.1 2016: D+29.6 2012: D+34.1 2008: D+40.6
Not yet ingested
- Civics
- —
Market trends
- HPI YoY
- ▼ -112.65%
- Current HPI
- 151.1288
- Rent YoY
- ▲ 1.59%
- Metro
- Philadelphia-Camden-Wilmington, PA-NJ-DE-MD
- State GDP YoY
- —
- F500 in state
- 0
Price history
+460.0% since first listed8 events — show timeline
- 2026-04-28 Price Changed $168,000 BRIGHT MLS
- 2026-04-09 Listed $174,000 BRIGHT MLS
- 2016-05-12 Listing Removed — BRIGHT MLS
- 2016-02-19 Listed $49,900 BRIGHT MLS
- 2015-09-07 Sold (MLS) $20,000 TREND
- 2015-09-04 Pending — TREND
- 2015-09-04 Sold (Public Records) $20,000 Public Records
- 2015-08-22 Listed $30,000 TREND
Property tax history
+3.9%/yrLatest (2024): $549 · +2.6% YoY. Source: county tax records.
Cash-flow waterfall
monthlySold comps — $/sqft
last 12 mo · ≤1 miLoading sold comps…