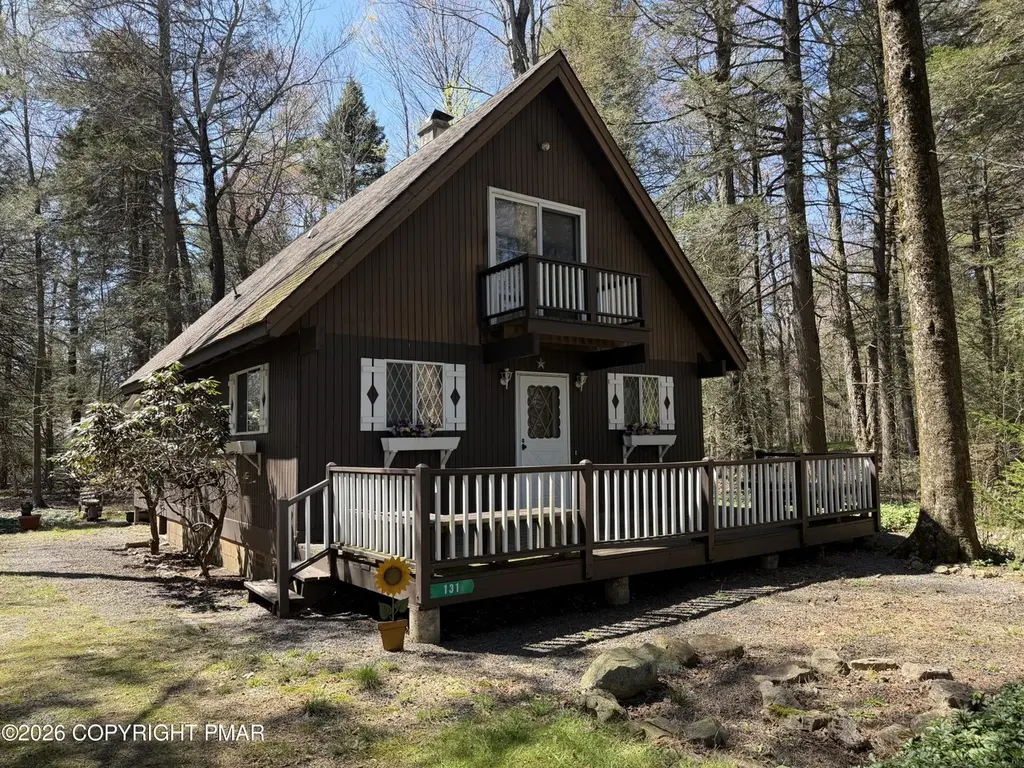
131 Colt Pl · Mount Pocono, PA
Flood risk 1/10 · Minimal
- FEMA flood zone
- X (unshaded)
- Chance of flooding over 30 yrs
- 0.0%
- Est. flood insurance / yr
- $507 – $1,088
Fire risk 3/10 · Minor
- Est. fire insurance / yr
- $511 – $949
Heat risk 1/10 · Minimal
- Hot days now (above 89°F)
- 7 days/yr
- Hot days in 30 yrs
- 15 days/yr
Wind risk 4/10 · Minor
- Chance of severe wind over 30 yrs
- 7.0%
Air-quality risk 2/10 · Minimal
- Unhealthy air days now
- 1 days/yr
- Unhealthy air days in 30 yrs
- 2 days/yr
Risk factors via First Street. Map © Google.
Why this score? — see what drove the C+ grade
The composite is a weighted blend of 9 inputs, each scored 0–100. Each bar is that input's sub-score; the figure is the points it added to the 100-point composite (weight × sub-score).
- Cash flow +19.8/30.0
- ARV discount +12.4/15.0
- DSCR +6.3/10.0
- Appreciation +6.2/10.0
- 1% rule +5.5/10.0
- Schools +4.0/10.0
- Livability +3.9/5.0
- Rent growth +2.5/5.0
- Condition / age +2.5/5.0
$235,000
🖨 Deal sheet 📄 Offer letter ✓ Due diligence
Listing remarks
Escape to this charming 3-bedroom, 2-bath Pocono chalet located in the amenity-filled Pocono Farms Country Club community. Perfect as a vacation home, short-term rental, or year-round residence, this home captures the essence of classic Pocono living. Inside, you'll find warm tongue-and-groove ceilings and a stunning stone-faced wood-burning fireplace that anchors the living space--ideal for cozy nights and entertaining. The home offers three generously sized bedrooms and a functional layout designed for both everyday living and weekend getaways. Step outside to a spacious, flat backyard--perfect for gatherings, entertaining, or simply relaxing in a peaceful setting. Enjoy evenings around t
Key facts
- Ample parking
- Flat backyard
- Pocono chalet
Tags
Property features AI
Finance
- Other: Property is in a homeowners association; annual HOA fee translates to approximately $145.83/month
- HOA & community: Homeowners association with annual fee ($1,750); Association amenities include security, cabana, clubhouse, meeting/party rooms, picnic area, recreation facilities, golf course, fitness center, tennis courts, basketball court, exterior game court; Association fee covers trash and security
Exterior
- Parking: Open parking (4 spaces); Driveway and off-street parking
- Security: Smoke detector(s)
- Utilities: Private water source; Septic tank sewer
- Home design: Single family house; Residential property; Used for recreational and residential purposes; Paved road access; Located in Pocono Farms Country Club subdivision
- Construction: Asphalt roof; Crawl space foundation; Built as a house (year built not provided)
- Exterior features: Rear covered porch; Deck
Interior
- Kitchen: Electric cooktop; Electric oven; Refrigerator; Microwave
- Bedrooms: Total of 7 rooms (bedroom count not specified)
- Flooring: Carpet; Linoleum; Wood
- Bathrooms: 2 full bathrooms
- Heating & cooling: Baseboard heating; Electric heating
- Interior features: Unfurnished; Smoke detectors; Wood-burning fireplace
- Laundry & utility: Washer; Dryer; Main level laundry
Neighborhood map
What this means for you Summary
Snapshot
- This is a 3-bed/1.5-bath single-family listed at $235k.
Deal economics
- At list price, monthly cash flow is $278 ($3k/yr) — positive.
- The deal already cash-flows at list — no discount required.
- Meets the 1% rule at list price ($2k rent vs $235k).
- Recommended offer: $228k (3.0% below list) — sets the bar for market timing.
- Cap rate 7.7% vs local median 5.1% in Mount Pocono — top-decile yield for the area; either an underpriced asset or a hidden risk that comps aren't pricing in. Stress-test before assuming the spread holds.
Location & tenants
- Location reads 77/100 on livability (#362 in PA, #3,166 nationally) — a middle-class / working-renter tenant base. Strengths: crime A+, cost of living A+, housing A+; Watch: schools F, commute F.
- Pocono Mountain SD (rural): math 37% / reading 55% proficiency, ranked #245 of 539 in PA (top 46%) — families likely to look elsewhere, expect single-tenant / working-renter base with shorter leases.
- Market conditions: 355 active listings in the ZIP; 2 comparable units currently listed for rent nearby; 278 units permitted in Monroe County in 2024 (52 in 5+ unit buildings).
Forward outlook
- In year one you build about $7k of equity ($2k loan paydown + $6k appreciation (2.4% local appreciation)).
- Monroe County population projected at -11% by 2050 — secular population decline; favor cash flow + early exit over multi-decade hold.
- At projected returns (2.4% appreciation + 3.0% rent growth), your $66k cash investment doubles in ~6 years — after that, you're playing with house money.
- By year 5, paydown + projected appreciation supports a ~$31k cash-out refi (75% LTV) — recoverable capital for the next deal without selling this one.
Negotiation context
- It's been on market 56 days — a 3% lower offer ($228k) is reasonable based on typical stale-listing flexibility.
Questions for the listing agent
- It's been on market 56 days. Have you received any prior offers? Is the seller open to a 3% concession, seller financing, or rate buy-down credit?
- Built in 1969 — when were the roof, HVAC, electrical panel, plumbing, and water heater last replaced?
- What does the HOA fee cover, when was the last increase, and are there any pending special assessments or reserve-fund shortfalls?
- Is there a deadline driving the sale (1031 exchange, divorce, estate, relocation)? That informs how much negotiation room exists.
- Schools are F-rated, which usually means shorter tenancies and higher turnover. Who's the typical renter profile here, and what's been the actual vacancy rate?
- What's the average days-on-market for RENTAL listings here right now (not sales)? A rising rental-DOM trend means longer vacancies and softer asking-rent achievability than the comps imply.
- What's the recent tenant-quality profile in this submarket — average credit score on applications, eviction rate, late-payment / NSF rate, and stable-employment percentage? A property-management company in the area should have these aggregated.
- How much new for-sale + rental construction is in the pipeline within 1–3 miles? Heavy new supply typically softens prices + rents 12–24 months out; constrained supply supports both.
Investment metrics
- 1% rule
- 1.05% ✓
- Cap rate
- 7.71%
- Cash-on-cash
- 5.08%
- DSCR
- 1.23
- GRM
- 7.9
CMA / ARV
- ARV (median comp)
- $263,572
- List price
- $235,000
- Delta
- -10.84%
- Verdict
- UNDERPRICED
- Comps
- 20 within 1.0 mi
Show comp detail 12 sales within ~0.75 mi
| Address | Dist | Beds/Ba | Sqft | Sold | Price | $/sf | Match |
|---|---|---|---|---|---|---|---|
| 109 Wood Duck Pl | 0.33mi | 3/2.0 | 1,104 (+2%) | 1mo | $260,000 | $236 | 78 |
| 304 Ruger Ln | 0.07mi | 3/1.0 | 968 (-10%) | 5mo | $282,000 | $291 | 74 |
| 113 Colt Pl | 0.10mi | 4/2.0 (+1) | 1,108 (+3%) | 15mo | $330,000 | $298 | 72 |
| 5142 Iroquois | 0.23mi | 3/1.5 | 1,056 (-2%) | 21mo | $255,000 | $241 | 68 |
| 1122 Seven Nations Ln | 0.26mi | 3/2.0 | 1,204 (+12%) | 12mo | $239,950 | $199 | 57 |
| 107 Black Bear Ln | 0.41mi | 3/2.0 | 1,194 (+11%) | 9mo | $255,000 | $214 | 54 |
| 335 Outer Dr | 0.38mi | 3/1.5 | 1,216 (+13%) | 17mo | $320,000 | $263 | 47 |
| 5111 Iroquois St | 0.39mi | 3/2.0 | 1,200 (+11%) | 19mo | $196,947 | $164 | 45 |
| 609 Washington Pl | 0.54mi | 3/2.0 | 1,143 (+6%) | 23mo | $405,000 | $354 | 44 |
| 2015 Minqua Trl Trl | 0.60mi | 3/1.0 | 960 (-11%) | 13mo | $175,000 | $182 | 40 |
| 112 Ewe Ln | 0.74mi | 3/1.5 | 960 (-11%) | 8mo | $242,500 | $253 | 40 |
| 6391 Cherokee Trl | 0.71mi | 3/1.5 | 1,176 (+9%) | 15mo | $291,100 | $248 | 39 |
Match score weights: distance 35% · size 25% · config 20% · recency 20%. Top-matched comps best support the ARV.
Projected returns pro-forma
2.36% appreciation · 3.0% rent growth · sell at horizon
- IRR
- 10.5%
- Equity multiple
- 1.58×
- Total profit
- $38,203
- Equity at exit
- $97,259
- IRR
- 13.2%
- Equity multiple
- 2.84×
- Total profit
- $121,373
- Equity at exit
- $143,653
Cash invested: $65,800 (down + closing). Projections, not guarantees.
Landlord ↔ Tenant lean methodology
- Overall (STATE)
- 62 Landlord-Friendly
- State Pennsylvania
- 62 Landlord-Friendly · EVEN
- County
- — inherits STATE
- City
- — inherits STATE
ZIP-level market 18466
- Home prices YoY
- 1.2%
- Active inventory
- 355
- Price-to-rent
- 7.9×
Monthly cashflow live
- Estimated rent
- $2,469 medium interval (Pro) →
- Mortgage (P&I)
- −$1,232
- Tax from tax record
- −$196 /mo · $2,353/yr
- Insurance
- −$98
- HOA
- −$146
- Vacancy / Maint / Mgmt
- −$519
- Net cashflow
- $278
Break-even live
UW: 25.0% down · 7.5% · 30yr · 1.5% tax · 5.0% vac · 8.0% maint · 8.0% mgmt
Financing live
Cash to close
- Down payment
- $58,750
- Closing costs
- $7,050
- Reserves months
- —
- Total cash needed
- —
Loan-product check · same deal, 3 products live
Conventional
25% down · 7.5% · 30yr
- Down + closing
- —
- Monthly P&I
- —
- Monthly cashflow
- —
- DSCR
- —
- Eligible?
- —
Personal DTI + credit; lowest rate.
DSCR
20% down · 8.5% · 30yr
- Down + closing
- —
- Monthly P&I
- —
- Monthly cashflow
- —
- DSCR
- —
- Eligible?
- —
No personal income docs; deal must DSCR.
Hard money
10% down · 12.0% · 12mo
- Down + closing
- —
- Monthly P&I
- —
- Monthly cashflow
- —
- DSCR
- —
- Eligible?
- —
Short-term bridge; refi at stabilization.
Rent comps 2 comps
| Address | Beds | Baths | Sqft | Rent | $/sqft | DOM | Units | Dist |
|---|---|---|---|---|---|---|---|---|
| 3222 Evergreen Cir Unit B Tobyhanna, PA | 3.0 | 2.0 | 1300 | $1,950 | $1.50 | 44d | 1 | 1.32mi |
| 3262 Hamlet Dr Coolbaugh Township, PA | 3.0 | 2.0 | 1200 | $3,000 | $2.50 | 43d | 1 | 1.46mi |
HOA detail
- Monthly dues
- $146 · $1,752/yr
Listing history 16 events
-
2026-06-19days on market $235,000 Active 56 DOM
-
2026-06-18days on market $235,000 Active 55 DOM
-
2026-06-17days on market $235,000 Active 54 DOM
-
2026-06-16days on market $235,000 Active 53 DOM
-
2026-06-15days on market $235,000 Active 52 DOM
-
2026-06-14days on market $235,000 Active 50 DOM
-
2026-06-13days on market $235,000 Active 49 DOM
-
2026-06-10days on market $235,000 Active 47 DOM
-
2026-06-09days on market $235,000 Active 46 DOM
-
2026-06-08days on market $235,000 Active 45 DOM
-
2026-06-07days on market $235,000 Active 44 DOM
-
2026-06-02days on market $235,000 Active 39 DOM
-
2026-06-01days on market $235,000 Active 38 DOM
-
2026-05-31days on market $235,000 Active 37 DOM
-
2026-05-30days on market $235,000 Active 36 DOM
-
2026-04-20$235,000 Active 1317-char remark
ⓘ Source: listings_history table (triggers on properties + properties_extension) + one-shot
backfill from property_details.listing_events for pre-trigger history.
Tax reassessment forecast PA · Partial reset (capped growth)
- Current annual tax
- $2,353 · $196/mo
- Projected year-2 tax
- $3,033 · $253/mo
- Expected delta
- +$680/yr (+$57/mo · 28.9%)
ⓘ Screening estimate from a state-policy table — verify with the county assessor before closing.
Climate risk First Street
- Flood 1/10 Low FEMA zone X (unshaded) · 0% chance over 30 yrs
- Wildfire 3/10 Moderate
- Heat 1/10 Low 7 d/yr ≥89°F today · 15 d/yr by 30 yrs out
- Wind 4/10 Moderate 7% chance of damaging wind over 30 yrs
- Air quality 2/10 Low 1 unhealthy d/yr today · 2 by 30 yrs out
Nearby sold comps map
Loading sold comps map…
Walkable amenities ~0.75 mi
Loading nearby amenities…
Taxation est. · year 1
- Rental income
- $29,631
- − Mortgage interest
- −$13,164
- − Property taxes
- −$2,353
- − Insurance
- −$1,175
- − Repairs & maintenance
- −$2,371
- − Management
- −$2,371
- − HOA
- −$1,752
- − Depreciation
- −$6,836
- Taxable loss
- −$390
- Est. tax savings @ 24.0%
- +$94
- After-tax cash flow
- $3,434/yr
For passive investors: Depreciation is non-cash, so a rental often shows a tax loss while cash-flowing — sheltering income. Rental losses are passive: they offset passive income freely, and up to $25,000/yr can offset ordinary (W-2) income if you actively participate and your MAGI is under $100k (phasing out to $0 by $150k); unused losses carry forward. On sale, claimed depreciation is recaptured at up to 25%, and gains may owe capital-gains tax (a 1031 exchange can defer both). Figures are a year-1 estimate at your 24.0% rate — not tax advice; consult a CPA.
Schools (NCES district)
- District
- Pocono Mountain SD
- NCES district ID
- 4219500
- Math proficiency
- 37% ▼ -5.00%
- Reading proficiency
- 55% ▲ 1.00%
- Median HH income
- $55,317
- Composite
- 39.91/100
- National rank
- #3856
- State rank
- #245 of 539 in PA
Livability — Mount Pocono
- Score
- 77/100
- State rank
- #362
- US rank
- #3166
Category grades
Schools grade is shown separately in the Schools card above.
Census & demographics
- Population (ZIP)
- 17,997
Population outlook (Monroe County) Hauer SSP2
- Today (2025)
- 164,099 people
- By 2030
- 161,412 · -1.6%
- By 2040
- 154,616 · -5.8%
- By 2050
- 146,710 · -10.6%
- By 2075
- 140,830 · -14.2%
- By 2100
- 138,472 · -15.6%
Race, ethnicity, and origin ACS 2023
- Neighborhood character
- Highly diverse neighborhood (Simpson 0.72)
- Race & ethnicity
- White 38% Hispanic / Latino 27% Black 24% Two or more races 17% Asian 4%
- Hispanic origin (detail)
- Puerto Rican 12% Dominican 6%
- Common ancestry
- Romanian 2% Portuguese 1% German 1%
- Foreign-born
- 16% · Canada
- Languages at home
- 77% English-only · Spanish 17% Other Indo-European 2% Russian/Polish/Slavic 1%
Political lean MEDSL · Monroe
- 2024 margin
- Toss-up / Even · D 49.1% · R 49.9%
- 2008→2024 swing
- -17.1pp toward R · 2008: 16.3pp · 2024: -0.8pp
- All cycles
- 2024: R+0.8 2020: D+6.4 2016: D+0.3 2012: D+14.0 2008: D+16.3
Not yet ingested
- Civics
- —
Market trends
- HPI YoY
- ▲ 2.36%
- Current HPI
- 202.4134
- Rent YoY
- —
- Metro
- —
- State GDP YoY
- ▲ 1.68%
- F500 in state
- 34
Industry mix (Fortune 500 HQ in PA)
| Industry | F500 HQs | Revenue |
|---|---|---|
| Healthcare | 2 | $309B |
|
||
| Insurance | 2 | $27B |
|
||
| Telecommunications / Media | 1 | $124B |
|
||
| Industrial Distribution | 1 | $22B |
|
||
| Financial Services | 1 | $20B |
|
||
| Chemicals / Materials | 1 | $18B |
|
||
Price history
1 event — show timeline
- 2026-04-20 Listed $235,000 PMAR
Property tax history
-0.4%/yrLatest (2026): $2,353 · +3.2% YoY. Source: county tax records.
Cash-flow waterfall
monthlySold comps — $/sqft
last 12 mo · ≤1 miLoading sold comps…