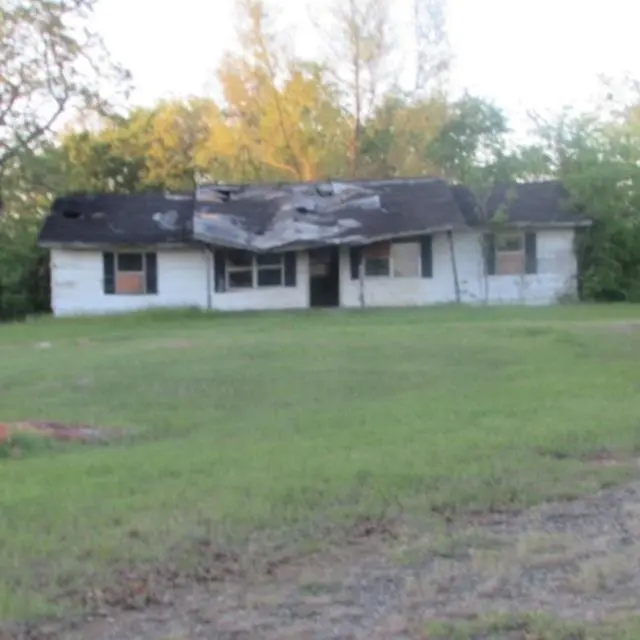
973 County Road 1695 · Mount Pleasant, TX
Flood risk 1/10 · Minimal
- FEMA flood zone
- X (unshaded)
- Chance of flooding over 30 yrs
- 0.0%
- Est. flood insurance / yr
- $507 – $1,088
Fire risk 6/10 · Moderate
- Est. fire insurance / yr
- $1,222 – $2,270
Heat risk 7/10 · Major
- Hot days now (above 111°F)
- 7 days/yr
- Hot days in 30 yrs
- 23 days/yr
Wind risk 6/10 · Moderate
- Chance of severe wind over 30 yrs
- 27.0%
Air-quality risk 2/10 · Minimal
- Unhealthy air days now
- 1 days/yr
- Unhealthy air days in 30 yrs
- 1 days/yr
Risk factors via First Street. Map © Google.
Why this score? — see what drove the B- grade
The composite is a weighted blend of 9 inputs, each scored 0–100. Each bar is that input's sub-score; the figure is the points it added to the 100-point composite (weight × sub-score).
- Cash flow +23.5/30.0
- ARV discount +15.0/15.0
- DSCR +7.6/10.0
- 1% rule +5.7/10.0
- Appreciation +5.0/10.0
- Livability +3.9/5.0
- Schools +3.7/10.0
- Rent growth +2.5/5.0
- Condition / age +2.5/5.0
$110,000
🖨 Deal sheet 📄 Offer letter ✓ Due diligence
Listing remarks MLS
Warning!! Foors are soft so proceed with caution
Key facts
- 1.98 acre lot
- Built 1981
- Listed 71 days
Neighborhood map
What this means for you Summary
Snapshot
- This is a 3-bed/2.0-bath single-family listed at $110k.
Deal economics
- At list price, monthly cash flow is $205 ($2k/yr) — positive.
- The deal already cash-flows at list — no discount required.
- Meets the 1% rule at list price ($1k rent vs $110k).
- Recommended offer: $103k (6.0% below list) — sets the bar for market timing.
- Cap rate 8.5% vs local median 3.5% in Mount Pleasant — top-decile yield for the area; either an underpriced asset or a hidden risk that comps aren't pricing in. Stress-test before assuming the spread holds.
Location & tenants
- Location reads 77/100 on livability (#81 in TX, #2,808 nationally) — a middle-class / working-renter tenant base. Strengths: cost of living A+, housing A+, health & safety A+; Watch: employment C-, schools D-, amenities D-.
- Mount Pleasant ISD (town): math 45% / reading 44% proficiency, ranked #291 of 826 in TX (top 35%) — families likely to look elsewhere, expect single-tenant / working-renter base with shorter leases; 74% free/reduced lunch — lower-income household profile, screen leases tightly.
- Market conditions: 1 active listings in the ZIP; 47 units permitted in Titus County in 2024 (10 in 5+ unit buildings).
Forward outlook
- In year one you build about $4k of equity ($761 loan paydown + $3k appreciation (3.0% local appreciation)).
- At projected returns (3.0% appreciation + 3.0% rent growth), your $31k cash investment doubles in ~5 years — after that, you're playing with house money.
- By year 8, paydown + projected appreciation supports a ~$30k cash-out refi (75% LTV) — recoverable capital for the next deal without selling this one.
Negotiation context
- It's been on market 72 days — a 6% lower offer ($103k) is reasonable based on typical stale-listing flexibility.
- 3 sale attempts with the ask held roughly flat each time — persistent listings suggest the price (not the market) is what's stuck; bring a comps-based counter.
Risks & watch-outs
- Climate carrying-cost: major wind risk, 27% chance of damaging wind over 30y; major wildfire risk; extreme-heat days projected 7→23/yr by 2055 (HVAC capex compounding) — expect insurance premiums to compound above CPI over the hold.
Questions for the listing agent
- It's been on market 72 days. Have you received any prior offers? Is the seller open to a 6% concession, seller financing, or rate buy-down credit?
- Why hasn't it sold? Are there any deal-killer items the seller is aware of (foundation, flood, title, zoning, code violations)?
- Is there a deadline driving the sale (1031 exchange, divorce, estate, relocation)? That informs how much negotiation room exists.
- Schools are D-rated, which usually means shorter tenancies and higher turnover. Who's the typical renter profile here, and what's been the actual vacancy rate?
- What's the average days-on-market for RENTAL listings here right now (not sales)? A rising rental-DOM trend means longer vacancies and softer asking-rent achievability than the comps imply.
- What's the recent tenant-quality profile in this submarket — average credit score on applications, eviction rate, late-payment / NSF rate, and stable-employment percentage? A property-management company in the area should have these aggregated.
- How much new for-sale + rental construction is in the pipeline within 1–3 miles? Heavy new supply typically softens prices + rents 12–24 months out; constrained supply supports both.
Investment metrics
- 1% rule
- 1.07% ✓
- Cap rate
- 8.53%
- Cash-on-cash
- 8.00%
- DSCR
- 1.36
- GRM
- 7.8
CMA / ARV
- ARV (median comp)
- $151,067
- List price
- $110,000
- Delta
- -27.18%
- Verdict
- UNDERPRICED
- Comps
- 2 within 2.0 mi
Projected returns pro-forma
3.0% appreciation · 3.0% rent growth · sell at horizon
- IRR
- 15.0%
- Equity multiple
- 1.85×
- Total profit
- $26,325
- Equity at exit
- $49,461
- IRR
- 16.7%
- Equity multiple
- 3.45×
- Total profit
- $75,401
- Equity at exit
- $76,225
Cash invested: $30,800 (down + closing). Projections, not guarantees.
Landlord ↔ Tenant lean methodology
- Overall (STATE)
- 87 Strongly Landlord-Friendly
- State Texas
- 87 Strongly Landlord-Friendly · R+5
- County
- — inherits STATE
- City
- — inherits STATE
ZIP-level market 75445
- Active inventory
- 1
- Price-to-rent
- 7.8×
Monthly cashflow live
- Estimated rent
- $1,179 medium interval (Pro) →
- Mortgage (P&I)
- −$577
- Tax from tax record
- −$104 /mo · $1,243/yr
- Insurance
- −$46
- HOA
- −$0
- Vacancy / Maint / Mgmt
- −$248
- Net cashflow
- $205
Break-even live
UW: 25.0% down · 7.5% · 30yr · 1.5% tax · 5.0% vac · 8.0% maint · 8.0% mgmt
Financing live
Cash to close
- Down payment
- $27,500
- Closing costs
- $3,300
- Reserves months
- —
- Total cash needed
- —
Loan-product check · same deal, 3 products live
Conventional
25% down · 7.5% · 30yr
- Down + closing
- —
- Monthly P&I
- —
- Monthly cashflow
- —
- DSCR
- —
- Eligible?
- —
Personal DTI + credit; lowest rate.
DSCR
20% down · 8.5% · 30yr
- Down + closing
- —
- Monthly P&I
- —
- Monthly cashflow
- —
- DSCR
- —
- Eligible?
- —
No personal income docs; deal must DSCR.
Hard money
10% down · 12.0% · 12mo
- Down + closing
- —
- Monthly P&I
- —
- Monthly cashflow
- —
- DSCR
- —
- Eligible?
- —
Short-term bridge; refi at stabilization.
Listing history 24 events
-
2026-06-19days on market $110,000 Active 72 DOM
-
2026-06-18days on market $110,000 Active 71 DOM
-
2026-06-17days on market $110,000 Active 70 DOM
-
2026-06-16days on market $110,000 Active 69 DOM
-
2026-06-15days on market $110,000 Active 68 DOM
-
2026-06-14days on market $110,000 Active 66 DOM
-
2026-06-12days on market $110,000 Active 65 DOM
-
2026-06-09days on market $110,000 Active 62 DOM
-
2026-06-08days on market $110,000 Active 61 DOM
-
2026-06-07days on market $110,000 Active 60 DOM
-
2026-06-07days on market $110,000 Active 59 DOM
-
2026-06-03days on market $110,000 Active 56 DOM
-
2026-06-02days on market $110,000 Active 55 DOM
-
2026-06-01days on market $110,000 Active 54 DOM
-
2026-05-31days on market $110,000 Active 53 DOM
-
2026-05-30days on market $110,000 Active 52 DOM
-
2025-09-03$110,000 Active 48-char remark
Show marketing remark (48 chars)
Warning!! Foors are soft so proceed with caution
-
2025-06-30historical
-
2025-06-12status Active
-
2025-06-10historical
-
2025-05-19price $125,000
-
2025-05-19price $125,000
-
2025-03-20$134,900 Active
-
1992-10-16soldstatus
ⓘ Source: listings_history table (triggers on properties + properties_extension) + one-shot
backfill from property_details.listing_events for pre-trigger history.
Tax reassessment forecast TX · Resets to sale price
- Current annual tax
- $1,243 · $104/mo
- Projected year-2 tax
- $2,013 · $168/mo
- Expected delta
- +$770/yr (+$64/mo · 61.9%)
ⓘ Screening estimate from a state-policy table — verify with the county assessor before closing.
Climate risk First Street
- Flood 1/10 Low FEMA zone X (unshaded) · 0% chance over 30 yrs
- Wildfire 6/10 Major
- Heat 7/10 Severe 7 d/yr ≥111°F today · 23 d/yr by 30 yrs out
- Wind 6/10 Major 27% chance of damaging wind over 30 yrs
- Air quality 2/10 Low 1 unhealthy d/yr today · 1 by 30 yrs out
Nearby sold comps map
Loading sold comps map…
Walkable amenities ~0.75 mi
Loading nearby amenities…
Taxation est. · year 1
- Rental income
- $14,151
- − Mortgage interest
- −$6,162
- − Property taxes
- −$1,243
- − Insurance
- −$550
- − Repairs & maintenance
- −$1,132
- − Management
- −$1,132
- − Depreciation
- −$3,200
- Taxable income
- $732
- Est. tax owed @ 24.0%
- −$176
- After-tax cash flow
- $2,288/yr
For passive investors: Depreciation is non-cash, so a rental often shows a tax loss while cash-flowing — sheltering income. Rental losses are passive: they offset passive income freely, and up to $25,000/yr can offset ordinary (W-2) income if you actively participate and your MAGI is under $100k (phasing out to $0 by $150k); unused losses carry forward. On sale, claimed depreciation is recaptured at up to 25%, and gains may owe capital-gains tax (a 1031 exchange can defer both). Figures are a year-1 estimate at your 24.0% rate — not tax advice; consult a CPA.
Schools (NCES district)
- District
- Mount Pleasant ISD
- NCES district ID
- 4831760
- Math proficiency
- 45% ▼ -7.00%
- Reading proficiency
- 44% ▲ 2.00%
- Median HH income
- $40,642
- Composite
- 37.35/100
- National rank
- #4437
- State rank
- #291 of 826 in TX
Livability — Mount Pleasant
- Score
- 77/100
- State rank
- #81
- US rank
- #2808
Category grades
Schools grade is shown separately in the Schools card above.
Census & demographics
No demographic data for this ZIP.
Market trends
- HPI YoY
- —
- Current HPI
- —
- Rent YoY
- —
- Metro
- —
- State GDP YoY
- ▲ 3.95%
- F500 in state
- 110
Industry mix (Fortune 500 HQ in TX)
| Industry | F500 HQs | Revenue |
|---|---|---|
| Energy | 16 | $1,198B |
|
||
| Technology | 5 | $198B |
|
||
| Engineering / Construction | 4 | $72B |
|
||
| Energy Services | 3 | $60B |
|
||
| Utilities | 3 | $41B |
|
||
| Healthcare | 2 | $330B |
|
||
Price history
-18.5% since first listed8 events — show timeline
- 2025-09-03 Listed $110,000 LAAR
- 2025-06-30 Listing Removed — NTREIS
- 2025-06-12 Relisted — NTREIS
- 2025-06-10 Listing Removed — NTREIS
- 2025-05-19 Price Changed $125,000 NTREIS
- 2025-05-19 Price Changed $125,000 GTAR
- 2025-03-20 Listed $134,900 NTREIS
- 1992-10-16 Sold (Public Records) — Public Records
Property tax history
+0.8%/yrLatest (2025): $1,243 · +6.3% YoY. Source: county tax records.
Cash-flow waterfall
monthlySold comps — $/sqft
last 12 mo · ≤1 miLoading sold comps…