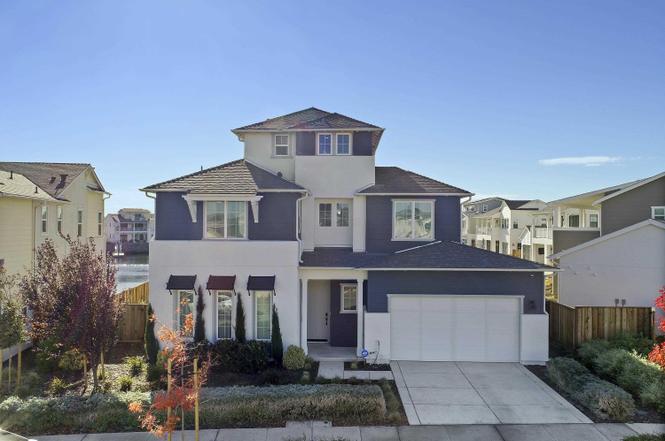
306 Navigators · Bethel Island, CA
Flood risk 1/10 · Minimal
- FEMA flood zone
- X (shaded)
- Chance of flooding over 30 yrs
- 0.0%
- Est. flood insurance / yr
- $507 – $1,088
Fire risk 3/10 · Minor
- Est. fire insurance / yr
- $659 – $1,223
Heat risk 6/10 · Moderate
- Hot days now (above 101°F)
- 7 days/yr
- Hot days in 30 yrs
- 14 days/yr
Wind risk 1/10 · Minimal
- Chance of severe wind over 30 yrs
- —
Air-quality risk 10/10 · Severe
- Unhealthy air days now
- 21 days/yr
- Unhealthy air days in 30 yrs
- 23 days/yr
Risk factors via First Street. Map © Google.
Why this score? — see what drove the A- grade
The composite is a weighted blend of 9 inputs, each scored 0–100. Each bar is that input's sub-score; the figure is the points it added to the 100-point composite (weight × sub-score).
- Cash flow +28.7/30.0
- ARV discount +15.0/15.0
- DSCR +10.0/10.0
- Appreciation +10.0/10.0
- 1% rule +9.2/10.0
- Schools +3.4/10.0
- Rent growth +2.5/5.0
- Livability +2.5/5.0
- Condition / age +2.5/5.0
$1,199,000
🖨 Deal sheet (PDF) 📄 Offer letter ✓ Due diligence
Listing remarks
Live the luxury lifestyle you always wanted. Stunning and contemporary Delta Coves Waterfront property that checks all the boxes including your private boat ramp and launch. The expensive home boasts of designer touches throughout including an exquisite exterior design. Highlights include modern engineered hardwood flooring, Gourmet Kitchen with quartz countertops including a breakfast bar, designer bathrooms, recessed lighting and much more. This property has a Media Room and extra living space on the upper floor with more breathtaking views. Equipped with a tankless water heater and EV charger to add to the smart home concept. Enjoy comfort year-round with Owned Solar! The backyard is mag
Key facts
- Ev charger
- Gourmet kitchen
- Private boat ramp
Tags
Property features AI
Finance
- Other: Community pool with pool house
- HOA & community: Homeowners association with monthly fee; Monthly HOA fee includes management, common area maintenance, and organized activities; Community amenities: clubhouse, fitness center, pool, tennis courts, BBQ area, recreation facilities, and organized activities
Exterior
- Parking: Attached garage with 2 covered spaces (2 garage spaces)
- Utilities: Seller-owned photovoltaic (solar) system
- Home design: Single family residence; Residential property; Built in 2022
- Construction: Wood siding
- Exterior features: Patio (covered); Front landscaping; Low-maintenance yard; Premium lot; Waterfront
Interior
- Kitchen: Breakfast bar and eat-in kitchen; Solid surface counters; Dishwasher; Gas range / cooktop; Built-in oven; Microwave; Disposal; Updated kitchen
- Bedrooms: Includes a street-level bedroom
- Flooring: Carpet; Engineered wood
- Bathrooms: Total of 5 bathrooms (4 full, 1 partial); Street-level: 1 full bath and 1 half bath
- Heating & cooling: Central heating; Central air conditioning
- Interior features: Breakfast bar; Solid surface countertops; Updated kitchen; Media room; Loft; Living room fireplace
- Laundry & utility: Dedicated laundry room; Tankless water heater
Neighborhood map
What this means for you Summary
Snapshot
- This is a 4-bed/5.0-bath single-family listed at $1.20M.
Deal economics
- At list price, monthly cash flow is $4k ($48k/yr) — positive.
- The deal already cash-flows at list — no discount required.
- Meets the 1% rule at list price ($17k rent vs $1.20M).
- Recommended offer: $1.06M (12.0% below list) — sets the bar for market timing.
- Cap rate 10.3% vs local median 2.7% in Bethel Island — top-decile yield for the area; either an underpriced asset or a hidden risk that comps aren't pricing in. Stress-test before assuming the spread holds.
Location & tenants
- Location reads 49/100 on livability (#1,166 in CA) — a working-class tenant base; expect higher turnover. Strengths: crime A-; Watch: employment C-, schools F, amenities F.
- Oakley Union Elementary (suburban): math 26% / reading 40% proficiency, ranked #837 of 1,400 in CA (top 60%) — families likely to look elsewhere, expect single-tenant / working-renter base with shorter leases.
- Market conditions: 79 active listings in the ZIP; 2 comparable units currently listed for rent nearby; 2,169 units permitted in Contra Costa County in 2024 (896 in 5+ unit buildings).
Forward outlook
- In year one you build about $128k of equity ($8k loan paydown + $120k appreciation (10.0% local appreciation)).
- Contra Costa County population projected at +26% by 2050 — long-run rental-demand tailwind backs the buy-and-hold thesis.
- At projected returns (10.0% appreciation + 3.0% rent growth), your $336k cash investment doubles in ~2 years — after that, you're playing with house money.
- By year 2, paydown + projected appreciation supports a ~$206k cash-out refi (75% LTV) — recoverable capital for the next deal without selling this one.
Negotiation context
- It's been on market 219 days — a 12% lower offer ($1.06M) is reasonable based on typical stale-listing flexibility.
- 3 sale attempts since 2y ago; this cycle's ask has dropped $100k (8%) from the opening price — seller is motivated, your offer sets the floor, not the list.
Risks & watch-outs
- Climate carrying-cost: extreme-heat days projected 7→14/yr by 2055 (HVAC capex compounding) — expect insurance premiums to compound above CPI over the hold.
Questions for the listing agent
- It's been on market 219 days. Have you received any prior offers? Is the seller open to a 12% concession, seller financing, or rate buy-down credit?
- What does the HOA fee cover, when was the last increase, and are there any pending special assessments or reserve-fund shortfalls?
- Why hasn't it sold? Are there any deal-killer items the seller is aware of (foundation, flood, title, zoning, code violations)?
- Is there a deadline driving the sale (1031 exchange, divorce, estate, relocation)? That informs how much negotiation room exists.
- Schools are F-rated, which usually means shorter tenancies and higher turnover. Who's the typical renter profile here, and what's been the actual vacancy rate?
- What's the average days-on-market for RENTAL listings here right now (not sales)? A rising rental-DOM trend means longer vacancies and softer asking-rent achievability than the comps imply.
- What's the recent tenant-quality profile in this submarket — average credit score on applications, eviction rate, late-payment / NSF rate, and stable-employment percentage? A property-management company in the area should have these aggregated.
- How much new for-sale + rental construction is in the pipeline within 1–3 miles? Heavy new supply typically softens prices + rents 12–24 months out; constrained supply supports both.
Investment metrics
- 1% rule
- 1.42% ✓
- Cap rate
- 10.29%
- Cash-on-cash
- 14.27%
- DSCR
- 1.64
- GRM
- 5.9
CMA / ARV
- ARV (on-the-fly)
- $1,506,064
- Comps found
- 7
Show comp detail 7 sales within ~0.75 mi
| Address | Dist | Beds/Ba | Sqft | Sold | Price | $/sf | Match |
|---|---|---|---|---|---|---|---|
| 419 Halcyon Pl | 0.09mi | 4/4.5 | 3,504 (+5%) | 1mo | $1,450,000 | $414 | 85 |
| 413 Halcyon Pl | 0.09mi | 4/4.0 | 3,384 (+2%) | 9mo | $1,287,000 | $380 | 82 |
| 349 Navigator's Pl | 0.10mi | 5/4.5 (+1) | 3,331 (-0%) | 18mo | $1,499,000 | $450 | 73 |
| 3155 Delta Cvs | 0.41mi | 4/3.5 | 3,332 (0%) | 7mo | $1,875,000 | $563 | 69 |
| 3413 Delta Coves Dr | 0.08mi | 4/4.5 | 2,927 (-12%) | 21mo | $1,470,000 | $502 | 56 |
| 348 Navigator's Pl | 0.09mi | 4/3.5 | 2,850 (-14%) | 18mo | $1,289,000 | $452 | 50 |
| 30 Grey Whale Pl | 0.60mi | 4/4.5 | 2,924 (-12%) | 8mo | $1,500,000 | $513 | 43 |
Match score weights: distance 35% · size 25% · config 20% · recency 20%. Top-matched comps best support the ARV.
Projected returns pro-forma
10.0% appreciation · 3.0% rent growth · sell at horizon
- IRR
- 34.8%
- Equity multiple
- 3.71×
- Total profit
- $908,288
- Equity at exit
- $1,080,154
- IRR
- 30.0%
- Equity multiple
- 8.38×
- Total profit
- $2,476,634
- Equity at exit
- $2,329,393
Cash invested: $335,720 (down + closing). Projections, not guarantees.
Landlord ↔ Tenant lean methodology
- Overall (STATE)
- 18 Strongly Tenant-Friendly
- State California
- 18 Strongly Tenant-Friendly · D+13
- County
- — inherits STATE
- City
- — inherits STATE
ZIP-level market 94511
- Home prices YoY
- 4.6%
- Active inventory
- 79
- Price-to-rent
- 5.9×
Monthly cashflow live
- Estimated rent
- $16,966 medium interval (Pro) →
- Mortgage (P&I)
- −$6,288
- Tax from tax record
- −$2,184 /mo · $26,205/yr
- Insurance
- −$500
- HOA
- −$439
- Vacancy / Maint / Mgmt
- −$3,563
- Net cashflow
- $3,993
Break-even live
Sensitivity live
| Price | -10% $4,672 | -5% $4,333 | +0% $3,993 | +5% $3,654 | +10% $3,315 |
|---|---|---|---|---|---|
| Rent | -10% $2,653 | -5% $3,323 | +0% $3,993 | +5% $4,663 | +10% $5,334 |
| Rate | -1.0pp $4,597 | -0.5pp $4,298 | base $3,993 | +0.5pp $3,683 | +1.0pp $3,367 |
UW: 25.0% down · 7.5% · 30yr · 1.5% tax · 5.0% vac · 8.0% maint · 8.0% mgmt
Financing live
Cash to close
- Down payment
- $299,750
- Closing costs
- $35,970
- Reserves months
- —
- Total cash needed
- —
Loan-product check · same deal, 3 products live
Conventional
25% down · 7.5% · 30yr
- Down + closing
- —
- Monthly P&I
- —
- Monthly cashflow
- —
- DSCR
- —
- Eligible?
- —
Personal DTI + credit; lowest rate.
DSCR
20% down · 8.5% · 30yr
- Down + closing
- —
- Monthly P&I
- —
- Monthly cashflow
- —
- DSCR
- —
- Eligible?
- —
No personal income docs; deal must DSCR.
Hard money
10% down · 12.0% · 12mo
- Down + closing
- —
- Monthly P&I
- —
- Monthly cashflow
- —
- DSCR
- —
- Eligible?
- —
Short-term bridge; refi at stabilization.
Rent comps 2 comps
| Address | Beds | Baths | Sqft | Rent | $/sqft | DOM | Units | Dist |
|---|---|---|---|---|---|---|---|---|
| 407 Halcyon Pl Bethel Island, CA | 4.0 | 5.5 | 3851 | $20,000 | $5.19 | 0d | 1 | 0.06mi |
| 98 Edgewater Ct Bethel Island, CA | 4.0 | 5.0 | 3900 | $6,500 | $1.67 | 0d | 1 | 0.34mi |
HOA detail
- Monthly dues
- $439 · $5,268/yr
- Likely covers
- water
Listing history 26 events
-
2026-06-21pricedays on market $1,199,000 Active 219 DOM
-
2026-06-18days on market $1,225,000 Active 216 DOM
-
2026-06-17days on market $1,225,000 Active 215 DOM
-
2026-06-16days on market $1,225,000 Active 214 DOM
-
2026-06-15days on market $1,225,000 Active 213 DOM
-
2026-06-13days on market $1,225,000 Active 211 DOM
-
2026-06-13days on market $1,225,000 Active 210 DOM
-
2026-06-09days on market $1,225,000 Active 207 DOM
-
2026-06-08days on market $1,225,000 Active 206 DOM
-
2026-06-07days on market $1,225,000 Active 205 DOM
-
2026-06-04days on market $1,225,000 Active 202 DOM
-
2026-06-03days on market $1,225,000 Active 201 DOM
-
2026-06-02days on market $1,225,000 Active 200 DOM
-
2026-06-01days on market $1,225,000 Active 199 DOM
-
2026-05-31days on market $1,225,000 Active 198 DOM
-
2026-01-23price $1,225,000
-
2025-11-14historical
-
2025-11-14$1,299,000 Active
-
2025-09-26status Active
-
2025-09-26price
-
2025-04-23status Pending
-
2025-03-17price
-
2025-03-07price
-
2025-01-15price
-
2024-12-11price
-
2024-11-19Active
ⓘ Source: listings_history table (triggers on properties + properties_extension) + one-shot
backfill from property_details.listing_events for pre-trigger history.
Tax reassessment forecast CA · Resets to sale price
- Current annual tax
- $26,205 · $2,184/mo
- Projected year-2 tax
- $26,205 · $2,184/mo
- Expected delta
- $0/yr ($0/mo · 0.0%)
ⓘ Screening estimate from a state-policy table — verify with the county assessor before closing.
Climate risk First Street
- Flood 1/10 Low FEMA zone X (shaded) · 0% chance over 30 yrs
- Wildfire 3/10 Moderate
- Heat 6/10 Major 7 d/yr ≥101°F today · 14 d/yr by 30 yrs out
- Wind 1/10 Low
- Air quality 10/10 Extreme 21 unhealthy d/yr today · 23 by 30 yrs out
Nearby sold comps map
Loading sold comps map…
Walkable amenities ~0.75 mi
Loading nearby amenities…
Taxation est. · year 1
- Rental income
- $203,595
- − Mortgage interest
- −$67,163
- − Property taxes
- −$26,205
- − Insurance
- −$5,995
- − Repairs & maintenance
- −$16,288
- − Management
- −$16,288
- − HOA
- −$5,268
- − Depreciation
- −$34,880
- Taxable income
- $31,509
- Est. tax owed @ 24.0%
- −$7,562
- After-tax cash flow
- $40,357/yr
For passive investors: Depreciation is non-cash, so a rental often shows a tax loss while cash-flowing — sheltering income. Rental losses are passive: they offset passive income freely, and up to $25,000/yr can offset ordinary (W-2) income if you actively participate and your MAGI is under $100k (phasing out to $0 by $150k); unused losses carry forward. On sale, claimed depreciation is recaptured at up to 25%, and gains may owe capital-gains tax (a 1031 exchange can defer both). Figures are a year-1 estimate at your 24.0% rate — not tax advice; consult a CPA.
Schools (NCES district)
- District
- Oakley Union Elementary
- NCES district ID
- 0628080
- Math proficiency
- 26% ▬ 0.00%
- Reading proficiency
- 40% ▲ 1.00%
- Median HH income
- $77,903
- Composite
- 34.04/100
- National rank
- #10301
- State rank
- #837 of 1400 in CA
Livability — Bethel Island
- Score
- 49/100
- State rank
- #1166
- US rank
- #25883
Category grades
Schools grade is shown separately in the Schools card above.
Census & demographics
- Census place
- Bethel Island, CA
- City population
- 2,144
- Population (ZIP)
- 2,144
Population outlook (Contra Costa County) Hauer SSP2
- Today (2025)
- 1,287,720 people
- By 2030
- 1,364,937 · +6.0%
- By 2040
- 1,506,209 · +17.0%
- By 2050
- 1,624,373 · +26.1%
- By 2075
- 1,853,193 · +43.9%
- By 2100
- 1,901,231 · +47.6%
Race, ethnicity, and origin ACS 2023
- Neighborhood character
- Predominantly White (67%)
- Race & ethnicity
- White 67% Hispanic / Latino 25% Asian 6% Two or more races 3% Pacific Islander 2%
- Hispanic origin (detail)
- Mexican 25%
- Common ancestry
- Slovak 5% Serbian 2% Portuguese 2%
- Foreign-born
- 27% · Canada, South Korea, China
- Languages at home
- 77% English-only · Spanish 20% Other Asian/Pacific 2% Chinese 1%
Political lean MEDSL · Contra Costa
- 2024 margin
- Solid D (+38.0) · D 67.3% · R 29.4% · Other 3.3%
- 2008→2024 swing
- +0.2pp no change · 2008: 37.8pp · 2024: 38.0pp
- All cycles
- 2024: D+38.0 2020: D+45.3 2016: D+43.5 2012: D+33.7 2008: D+37.8
Not yet ingested
- Civics
- —
Market trends
- HPI YoY
- ▲ 13.77%
- Current HPI
- 312.0698
- Rent YoY
- —
- Metro
- —
- State GDP YoY
- ▲ 3.21%
- F500 in state
- 116
Industry mix (Fortune 500 HQ in CA)
| Industry | F500 HQs | Revenue |
|---|---|---|
| Technology | 27 | $1,492B |
|
||
| Financial Services | 3 | $174B |
|
||
| Retail | 3 | $44B |
|
||
| Insurance | 3 | $26B |
|
||
| Media / Entertainment | 2 | $115B |
|
||
| Pharmaceuticals / Biotech | 2 | $62B |
|
||
Price history
-5.7% since first listed11 events — show timeline
- 2026-01-23 Price Changed $1,225,000 bridgeMLS, Bay East AOR, or Contra Costa AOR
- 2025-11-14 Listing Removed — bridgeMLS, Bay East AOR, or Contra Costa AOR
- 2025-11-14 Listed $1,299,000 bridgeMLS, Bay East AOR, or Contra Costa AOR
- 2025-09-26 Relisted — bridgeMLS, Bay East AOR, or Contra Costa AOR
- 2025-09-26 Price Changed — bridgeMLS, Bay East AOR, or Contra Costa AOR
- 2025-04-23 Pending — bridgeMLS, Bay East AOR, or Contra Costa AOR
- 2025-03-17 Price Changed — bridgeMLS, Bay East AOR, or Contra Costa AOR
- 2025-03-07 Price Changed — bridgeMLS, Bay East AOR, or Contra Costa AOR
- 2025-01-15 Price Changed — bridgeMLS, Bay East AOR, or Contra Costa AOR
- 2024-12-11 Price Changed — bridgeMLS, Bay East AOR, or Contra Costa AOR
- 2024-11-19 Listed — bridgeMLS, Bay East AOR, or Contra Costa AOR
Property tax history
+17.6%/yrLatest (2025): $26,205 · +1.8% YoY. Source: county tax records.
Cash-flow waterfall
monthlySold comps — $/sqft
last 12 mo · ≤1 miLoading sold comps…