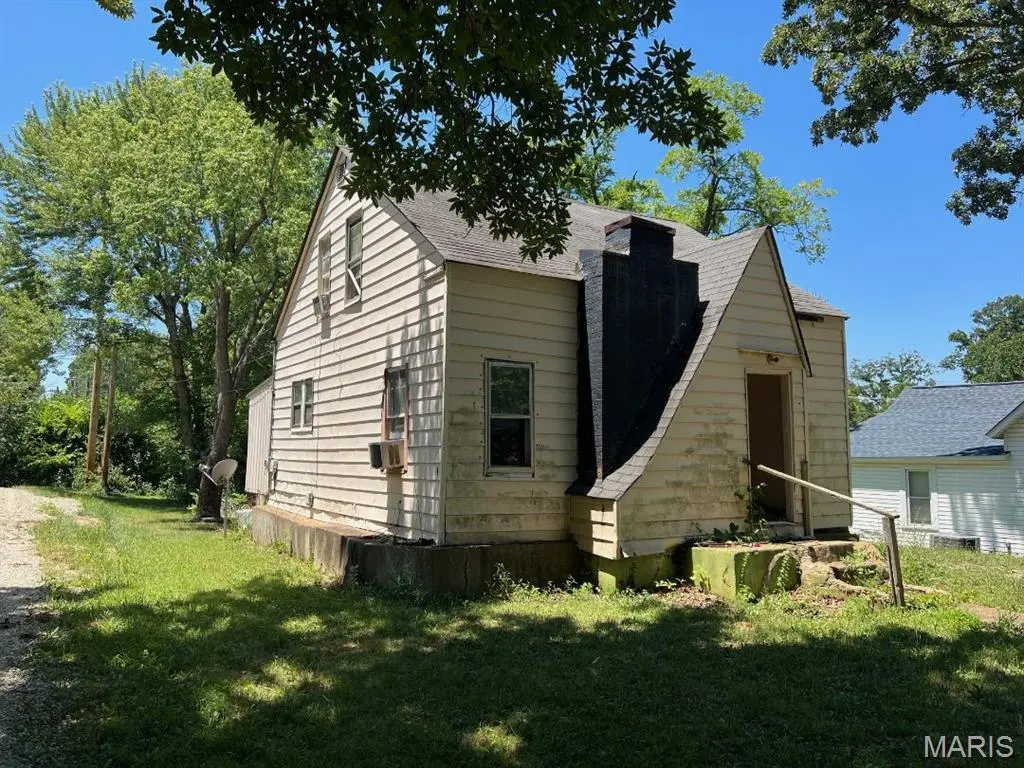
1009 Pine St · Bismarck, MO
Flood risk 1/10 · Minimal
- FEMA flood zone
- X (unshaded)
- Chance of flooding over 30 yrs
- 0.0%
- Est. flood insurance / yr
- $473 – $860
Fire risk 4/10 · Minor
- Est. fire insurance / yr
- $1,054 – $1,958
Heat risk 4/10 · Minor
- Hot days now (above 104°F)
- 7 days/yr
- Hot days in 30 yrs
- 21 days/yr
Wind risk 2/10 · Minimal
- Chance of severe wind over 30 yrs
- 1.0%
Air-quality risk 2/10 · Minimal
- Unhealthy air days now
- 0 days/yr
- Unhealthy air days in 30 yrs
- 1 days/yr
Risk factors via First Street. Map © Google.
Why this score? — see what drove the C- grade
The composite is a weighted blend of 9 inputs, each scored 0–100. Each bar is that input's sub-score; the figure is the points it added to the 100-point composite (weight × sub-score).
- Cash flow +15.0/30.0
- Appreciation +10.0/10.0
- ARV discount +7.5/15.0
- 1% rule +5.0/10.0
- DSCR +5.0/10.0
- Livability +2.9/5.0
- Rent growth +2.5/5.0
- Condition / age +2.5/5.0
- Schools +2.0/10.0
$15,000
🖨 Deal sheet 📄 Offer letter ✓ Due diligence
Listing remarks MLS
Investors Special!! Home is a must see for anyone looking to flip or build new. Great location in town. Within walking distance to everything! Don't miss this chance! There are storage units next to it that can be purchased as well. Ask agent for more info!! Home is being sold as is. Seller to do no repairs.
Key facts
- Walking distance
- Great location
- Storage units
Tags
Neighborhood map
What this means for you Summary
Snapshot
- This is a 4-bed/1.0-bath other listed at $15k.
Deal economics
- At list price, monthly cash flow is $608 ($7k/yr) — positive.
- The deal already cash-flows at list — no discount required.
- Meets the 1% rule at list price ($907 rent vs $15k).
- Recommended offer: $13k (12.0% below list) — sets the bar for market timing.
Location & tenants
- Location reads 58/100 on livability (#583 in MO) — a working-class tenant base; expect higher turnover. Strengths: cost of living A+, housing A+, crime B+; Watch: schools F, amenities F, commute F.
- Bismarck R-V (rural): math 18% / reading 31% proficiency, ranked #292 of 324 in MO (top 90%) — low school quality limits family demand, transient renter base, plan for 1-2y turnover.
- Market conditions: 23 active listings in the ZIP; 134 units permitted in St. Francois County in 2024 (32 in 5+ unit buildings).
Forward outlook
- In year one you build about $2k of equity ($104 loan paydown + $2k appreciation (10.0% local appreciation)).
- At projected returns (10.0% appreciation + 3.0% rent growth), your $4k cash investment doubles in ~1 year — after that, you're playing with house money.
Negotiation context
- It's been on market 161 days — a 12% lower offer ($13k) is reasonable based on typical stale-listing flexibility.
- 2 sale attempts since 4y ago; this cycle's ask has dropped $5k (25%) from the opening price — seller is motivated, your offer sets the floor, not the list.
Risks & watch-outs
- Watch-outs: built in 1940 — expect roof / HVAC / electrical / plumbing capex.
Questions for the listing agent
- It's been on market 161 days. Have you received any prior offers? Is the seller open to a 12% concession, seller financing, or rate buy-down credit?
- Built in 1940 — when were the roof, HVAC, electrical panel, plumbing, and water heater last replaced?
- Why hasn't it sold? Are there any deal-killer items the seller is aware of (foundation, flood, title, zoning, code violations)?
- Is there a deadline driving the sale (1031 exchange, divorce, estate, relocation)? That informs how much negotiation room exists.
- Schools are F-rated, which usually means shorter tenancies and higher turnover. Who's the typical renter profile here, and what's been the actual vacancy rate?
- What's the average days-on-market for RENTAL listings here right now (not sales)? A rising rental-DOM trend means longer vacancies and softer asking-rent achievability than the comps imply.
- What's the recent tenant-quality profile in this submarket — average credit score on applications, eviction rate, late-payment / NSF rate, and stable-employment percentage? A property-management company in the area should have these aggregated.
- How much new for-sale + rental construction is in the pipeline within 1–3 miles? Heavy new supply typically softens prices + rents 12–24 months out; constrained supply supports both.
Investment metrics
- 1% rule
- 6.05% ✓
- Cap rate
- 54.92%
- Cash-on-cash
- 173.66%
- DSCR
- 8.73
- GRM
- 1.4
CMA / ARV
- ARV (median comp)
- $94,214
- List price
- $15,000
- Delta
- -84.08%
- Verdict
- UNDERPRICED
- Comps
- 20 within 1.0 mi
Projected returns pro-forma
10.0% appreciation · 3.0% rent growth · sell at horizon
- IRR
- —
- Equity multiple
- 12.17×
- Total profit
- $46,897
- Equity at exit
- $13,513
- IRR
- —
- Equity multiple
- 26.64×
- Total profit
- $107,696
- Equity at exit
- $29,142
Cash invested: $4,200 (down + closing). Projections, not guarantees.
Landlord ↔ Tenant lean methodology
- Overall (STATE)
- 81 Strongly Landlord-Friendly
- State Missouri
- 81 Strongly Landlord-Friendly · R+10
- County
- — inherits STATE
- City
- — inherits STATE
ZIP-level market 63624
- Home prices YoY
- 23.8%
- Active inventory
- 23
- Price-to-rent
- 1.4×
Monthly cashflow live
- Estimated rent
- $907 medium interval (Pro) →
- Mortgage (P&I)
- −$79
- Tax from tax record
- −$24 /mo · $286/yr
- Insurance
- −$6
- HOA
- −$0
- Vacancy / Maint / Mgmt
- −$190
- Net cashflow
- $608
Break-even live
UW: 25.0% down · 7.5% · 30yr · 1.5% tax · 5.0% vac · 8.0% maint · 8.0% mgmt
Financing live
Cash to close
- Down payment
- $3,750
- Closing costs
- $450
- Reserves months
- —
- Total cash needed
- —
Loan-product check · same deal, 3 products live
Conventional
25% down · 7.5% · 30yr
- Down + closing
- —
- Monthly P&I
- —
- Monthly cashflow
- —
- DSCR
- —
- Eligible?
- —
Personal DTI + credit; lowest rate.
DSCR
20% down · 8.5% · 30yr
- Down + closing
- —
- Monthly P&I
- —
- Monthly cashflow
- —
- DSCR
- —
- Eligible?
- —
No personal income docs; deal must DSCR.
Hard money
10% down · 12.0% · 12mo
- Down + closing
- —
- Monthly P&I
- —
- Monthly cashflow
- —
- DSCR
- —
- Eligible?
- —
Short-term bridge; refi at stabilization.
Listing history 22 events
-
2026-06-18days on market $15,000 Active 161 DOM
-
2026-06-17days on market $15,000 Active 160 DOM
-
2026-06-16days on market $15,000 Active 159 DOM
-
2026-06-15days on market $15,000 Active 158 DOM
-
2026-06-13days on market $15,000 Active 156 DOM
-
2026-06-12days on market $15,000 Active 155 DOM
-
2026-06-09days on market $15,000 Active 152 DOM
-
2026-06-08days on market $15,000 Active 151 DOM
-
2026-06-07days on market $15,000 Active 150 DOM
-
2026-06-05days on market $15,000 Active 148 DOM
-
2026-06-04days on market $15,000 Active 146 DOM
-
2026-06-02days on market $15,000 Active 145 DOM
-
2026-06-01days on market $15,000 Active 144 DOM
-
2026-05-31days on market $15,000 Active 143 DOM
-
2026-04-01price $15,000 309-char remark
Show marketing remark (309 chars)
Investors Special!! Home is a must see for anyone looking to flip or build new. Great location in town. Within walking distance to everything! Don't miss this chance! There are storage units next to it that can be purchased as well. Ask agent for more info!! Home is being sold as is. Seller to do no repairs.
-
2026-01-08$20,000 Active 309-char remark
Show marketing remark (309 chars)
Investors Special!! Home is a must see for anyone looking to flip or build new. Great location in town. Within walking distance to everything! Don't miss this chance! There are storage units next to it that can be purchased as well. Ask agent for more info!! Home is being sold as is. Seller to do no repairs.
-
2023-04-11soldstatus Closed 127-char remark
Show marketing remark (127 chars)
Investment opportunity! Needs complete rehab. Spacious back yard with alley access and off-street parking. Motivated Seller!
-
2023-03-09status Pending 127-char remark
Show marketing remark (127 chars)
Investment opportunity! Needs complete rehab. Spacious back yard with alley access and off-street parking. Motivated Seller!
-
2022-11-04price $17,500 127-char remark
Show marketing remark (127 chars)
Investment opportunity! Needs complete rehab. Spacious back yard with alley access and off-street parking. Motivated Seller!
-
2022-08-27price $19,500 127-char remark
Show marketing remark (127 chars)
Investment opportunity! Needs complete rehab. Spacious back yard with alley access and off-street parking. Motivated Seller!
-
2022-08-17price $23,500 127-char remark
Show marketing remark (127 chars)
Investment opportunity! Needs complete rehab. Spacious back yard with alley access and off-street parking. Motivated Seller!
-
2022-08-01$26,500 Active 127-char remark
Show marketing remark (127 chars)
Investment opportunity! Needs complete rehab. Spacious back yard with alley access and off-street parking. Motivated Seller!
ⓘ Source: listings_history table (triggers on properties + properties_extension) + one-shot
backfill from property_details.listing_events for pre-trigger history.
Tax reassessment forecast MO · Resets to sale price
- Current annual tax
- $286 · $24/mo
- Projected year-2 tax
- $286 · $24/mo
- Expected delta
- $0/yr ($0/mo · 0.0%)
ⓘ Screening estimate from a state-policy table — verify with the county assessor before closing.
Climate risk First Street
- Flood 1/10 Low FEMA zone X (unshaded) · 0% chance over 30 yrs
- Wildfire 4/10 Moderate
- Heat 4/10 Moderate 7 d/yr ≥104°F today · 21 d/yr by 30 yrs out
- Wind 2/10 Low 100% chance of damaging wind over 30 yrs
- Air quality 2/10 Low 0 unhealthy d/yr today · 1 by 30 yrs out
Nearby sold comps map
Loading sold comps map…
Walkable amenities ~0.75 mi
Loading nearby amenities…
Taxation est. · year 1
- Rental income
- $10,884
- − Mortgage interest
- −$840
- − Property taxes
- −$286
- − Insurance
- −$75
- − Repairs & maintenance
- −$871
- − Management
- −$871
- − Depreciation
- −$436
- Taxable income
- $7,505
- Est. tax owed @ 24.0%
- −$1,801
- After-tax cash flow
- $5,492/yr
For passive investors: Depreciation is non-cash, so a rental often shows a tax loss while cash-flowing — sheltering income. Rental losses are passive: they offset passive income freely, and up to $25,000/yr can offset ordinary (W-2) income if you actively participate and your MAGI is under $100k (phasing out to $0 by $150k); unused losses carry forward. On sale, claimed depreciation is recaptured at up to 25%, and gains may owe capital-gains tax (a 1031 exchange can defer both). Figures are a year-1 estimate at your 24.0% rate — not tax advice; consult a CPA.
Schools (NCES district)
- District
- Bismarck R-V
- NCES district ID
- 2905130
- Math proficiency
- 18% ▼ -14.00%
- Reading proficiency
- 31% ▼ -6.00%
- Median HH income
- $37,135
- Composite
- 20.36/100
- National rank
- #8602
- State rank
- #292 of 324 in MO
Livability — Bismarck
- Score
- 58/100
- State rank
- #583
- US rank
- #20759
Category grades
Schools grade is shown separately in the Schools card above.
Census & demographics
- Census place
- Bismarck, MO
- Population (ZIP)
- 3,507
Population outlook (St. Francois County) Hauer SSP2
- Today (2025)
- 68,683 people
- By 2030
- 69,574 · +1.3%
- By 2040
- 70,665 · +2.9%
- By 2050
- 70,708 · +2.9%
- By 2075
- 67,917 · -1.1%
- By 2100
- 56,563 · -17.6%
Race, ethnicity, and origin ACS 2023
- Neighborhood character
- Predominantly White (90%)
- Race & ethnicity
- White 90% Two or more races 5% Native American 3% Hispanic / Latino 2%
- Common ancestry
- Slovak 5% Lithuanian 4% Italian 2%
- Foreign-born
- 2% · Canada, Jamaica
- Languages at home
- 99% English-only · German/W. Germanic 1%
Political lean MEDSL · St. Francois
- 2024 margin
- Solid R (+51.4) · D 23.8% · R 75.2%
- 2008→2024 swing
- -46.8pp toward R · 2008: -4.6pp · 2024: -51.4pp
- All cycles
- 2024: R+51.4 2020: R+48.1 2016: R+45.4 2012: R+19.5 2008: R+4.6
Not yet ingested
- Civics
- —
Market trends
- HPI YoY
- ▲ 61.65%
- Current HPI
- 320.8335
- Rent YoY
- —
- Metro
- —
- State GDP YoY
- ▲ 1.84%
- F500 in state
- 20
Industry mix (Fortune 500 HQ in MO)
| Industry | F500 HQs | Revenue |
|---|---|---|
| Healthcare | 1 | $163B |
|
||
| Insurance | 1 | $21B |
|
||
| Industrial Technology | 1 | $17B |
|
||
| Retail | 1 | $16B |
|
||
| Industrial Distribution | 1 | $10B |
|
||
| Utilities | 1 | $9B |
|
||
Price history
-43.4% since first listed8 events — show timeline
- 2026-04-01 Price Changed $15,000 MARIS as Distributed by MLS Grid
- 2026-01-08 Listed $20,000 MARIS as Distributed by MLS Grid
- 2023-04-11 Sold (MLS) — MARIS as Distributed by MLS Grid
- 2023-03-09 Pending — MARIS as Distributed by MLS Grid
- 2022-11-04 Price Changed $17,500 MARIS as Distributed by MLS Grid
- 2022-08-27 Price Changed $19,500 MARIS as Distributed by MLS Grid
- 2022-08-17 Price Changed $23,500 MARIS as Distributed by MLS Grid
- 2022-08-01 Listed $26,500 MARIS as Distributed by MLS Grid
Property tax history
+3.4%/yrLatest (2025): $286 · +7.7% YoY. Source: county tax records.
Cash-flow waterfall
monthlySold comps — $/sqft
last 12 mo · ≤1 miLoading sold comps…