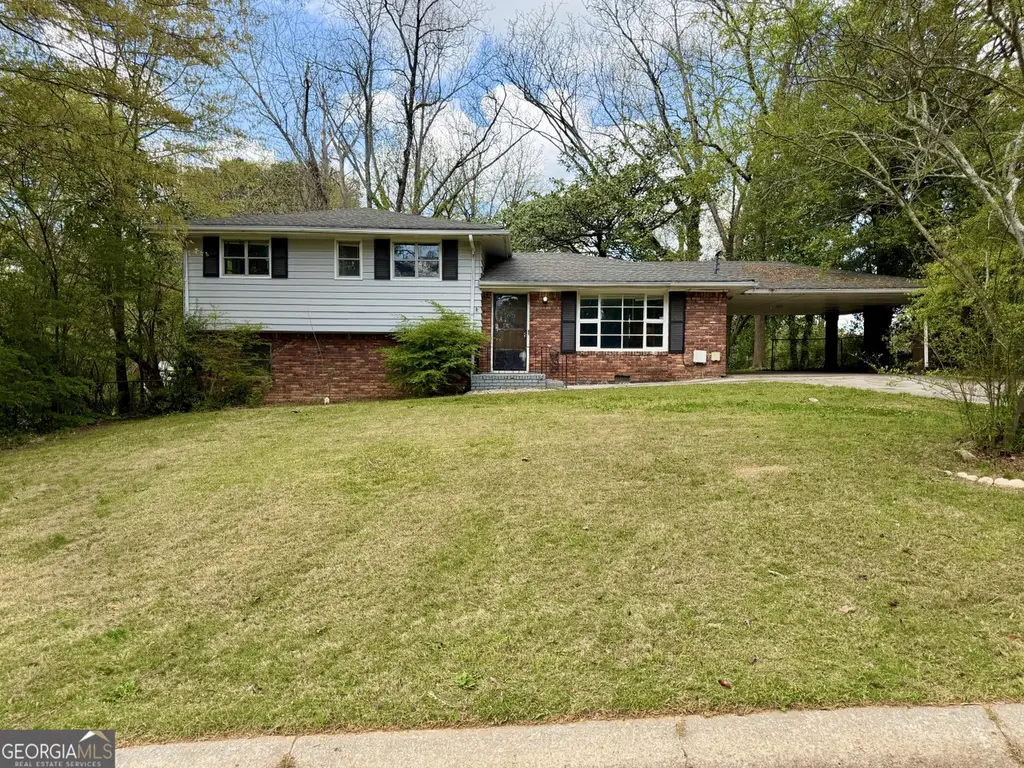
2705 Dunmoreland Ter · South Fulton, GA
Flood risk 1/10 · Minimal
- FEMA flood zone
- X (unshaded)
- Chance of flooding over 30 yrs
- 0.0%
- Est. flood insurance / yr
- $473 – $860
Fire risk 2/10 · Minimal
- Est. fire insurance / yr
- $963 – $1,789
Heat risk 5/10 · Moderate
- Hot days now (above 103°F)
- 7 days/yr
- Hot days in 30 yrs
- 18 days/yr
Wind risk 6/10 · Moderate
- Chance of severe wind over 30 yrs
- 27.0%
Air-quality risk 4/10 · Minor
- Unhealthy air days now
- 4 days/yr
- Unhealthy air days in 30 yrs
- 6 days/yr
Risk factors via First Street. Map © Google.
Why this score? — see what drove the C+ grade
The composite is a weighted blend of 9 inputs, each scored 0–100. Each bar is that input's sub-score; the figure is the points it added to the 100-point composite (weight × sub-score).
- Cash flow +15.5/30.0
- ARV discount +15.0/15.0
- Appreciation +10.0/10.0
- 1% rule +5.0/10.0
- DSCR +4.8/10.0
- Schools +4.5/10.0
- Rent growth +2.7/5.0
- Livability +2.5/5.0
- Condition / age +2.5/5.0
$169,900
🖨 Deal sheet 📄 Offer letter ✓ Due diligence
Listing remarks MLS
New listing in Atlanta that has just hit the market. This all-brick split-level home is situated on an expansive lot of nearly half an acre and includes a convenient double carport. Inside, the home features three spacious bedrooms, two full bathrooms, and one half bathroom. Please let me know if you would like to schedule a viewing. Must have pre-qualification to schedule showings. Agents, please see the MLS remarks. Thank you
Key facts
- Expansive lot
- Double carport
- 0.42 acre lot
Tags
Neighborhood map
What this means for you Summary
Snapshot
- This is a 3-bed/2.5-bath single-family listed at $170k.
Deal economics
- At list price, monthly cash flow is $69 ($826/yr) — positive.
- The deal already cash-flows at list — no discount required.
- Meets the 1% rule at list price ($2k rent vs $170k).
- Recommended offer: $165k (3.0% below list) — sets the bar for market timing.
- Cap rate 6.8% vs local median 4.6% in South Fulton — top-decile yield for the area; either an underpriced asset or a hidden risk that comps aren't pricing in. Stress-test before assuming the spread holds.
Location & tenants
- Location reads: area grade C — affects rentability + tenant quality, not the cash-flow math above.
- Fulton County (suburban): math 49% / reading 53% proficiency, ranked #12 of 174 in GA (top 7%) — acceptable for families but not a draw, mixed tenant base, ~2y average lease.
- Market conditions: Rents flat; 651 active listings in the ZIP; 30 comparable units currently listed for rent nearby; rentals leasing fast (median 13d on market — plan ~1-2 weeks tenant-placement turnaround); 11,565 units permitted in Fulton County in 2024 (8,159 in 5+ unit buildings).
- This rent runs 30% of the median local income ($67k/yr) — at the standard rent-burdened threshold; future hikes will face affordability resistance.
Forward outlook
- In year one you build about $18k of equity ($1k loan paydown + $17k appreciation (10.0% local appreciation)).
- Fulton County population projected at +38% by 2050 — long-run rental-demand tailwind backs the buy-and-hold thesis.
- At projected returns (10.0% appreciation + 0.9% rent growth), your $48k cash investment doubles in ~3 years — after that, you're playing with house money.
- By year 3, paydown + projected appreciation supports a ~$46k cash-out refi (75% LTV) — recoverable capital for the next deal without selling this one.
Negotiation context
- It's been on market 50 days — a 3% lower offer ($165k) is reasonable based on typical stale-listing flexibility.
- 11 sale attempts since 10y ago with the ask held roughly flat each time — persistent listings suggest the price (not the market) is what's stuck; bring a comps-based counter.
- Current owner paid $140k; 21% above their basis — modest negotiation headroom, anchor on the comps not their cost.
Risks & watch-outs
- Climate carrying-cost: major wind risk, 27% chance of damaging wind over 30y; extreme-heat days projected 7→18/yr by 2055 (HVAC capex compounding) — expect insurance premiums to compound above CPI over the hold.
Questions for the listing agent
- It's been on market 50 days. Have you received any prior offers? Is the seller open to a 3% concession, seller financing, or rate buy-down credit?
- Built in 1960 — when were the roof, HVAC, electrical panel, plumbing, and water heater last replaced?
- Is there a deadline driving the sale (1031 exchange, divorce, estate, relocation)? That informs how much negotiation room exists.
- What's the average days-on-market for RENTAL listings here right now (not sales)? A rising rental-DOM trend means longer vacancies and softer asking-rent achievability than the comps imply.
- What's the recent tenant-quality profile in this submarket — average credit score on applications, eviction rate, late-payment / NSF rate, and stable-employment percentage? A property-management company in the area should have these aggregated.
- How much new for-sale + rental construction is in the pipeline within 1–3 miles? Heavy new supply typically softens prices + rents 12–24 months out; constrained supply supports both.
Investment metrics
- 1% rule
- 1.00% ✓
- Cap rate
- 6.78%
- Cash-on-cash
- 1.74%
- DSCR
- 1.08
- GRM
- 8.3
CMA / ARV
- ARV (median comp)
- $261,170
- List price
- $169,900
- Delta
- -34.95%
- Verdict
- UNDERPRICED
- Comps
- 20 within 1.0 mi
Show comp detail 6 sales within ~0.75 mi
| Address | Dist | Beds/Ba | Sqft | Sold | Price | $/sf | Match |
|---|---|---|---|---|---|---|---|
| 5341 Sand Bar Ln | 0.36mi | 3/2.0 | 1,093 (-2%) | 1mo | $245,000 | $224 | 78 |
| 5312 Westford Cir | 0.14mi | 3/2.0 | 960 (-14%) | 9mo | $206,000 | $215 | 61 |
| 5370 Longmeadow Ln | 0.24mi | 3/1.5 | 1,248 (+12%) | 4mo | $87,500 | $70 | 61 |
| 5488 Deerfield Trl | 0.47mi | 3/2.5 | 1,008 (-9%) | 9mo | $190,000 | $188 | 55 |
| 5530 Old Bill Cook Rd | 0.69mi | 3/2.0 | 1,200 (+8%) | 4mo | $40,000 | $33 | 49 |
| 5633 Westhill Cir | 0.61mi | 3/2.0 | 1,080 (-3%) | 23mo | $160,000 | $148 | 46 |
Match score weights: distance 35% · size 25% · config 20% · recency 20%. Top-matched comps best support the ARV.
Projected returns pro-forma
10.0% appreciation · 0.95% rent growth · sell at horizon
- IRR
- 24.8%
- Equity multiple
- 2.97×
- Total profit
- $93,568
- Equity at exit
- $153,059
- IRR
- 21.4%
- Equity multiple
- 6.59×
- Total profit
- $265,864
- Equity at exit
- $330,078
Cash invested: $47,572 (down + closing). Projections, not guarantees.
Landlord ↔ Tenant lean methodology
- Overall (STATE)
- 90 Strongly Landlord-Friendly
- State Georgia
- 90 Strongly Landlord-Friendly · R+3
- County
- — inherits STATE
- City
- — inherits STATE
ZIP-level market 30349
- Home prices YoY
- 4.6%
- Rents YoY
- 0.9%
- Active inventory
- 651
- Price-to-rent
- 8.3×
Monthly cashflow live
- Estimated rent
- $1,699 high interval (Pro) →
- Mortgage (P&I)
- −$891
- Tax from tax record
- −$312 /mo · $3,742/yr
- Insurance
- −$71
- HOA
- −$0
- Vacancy / Maint / Mgmt
- −$357
- Net cashflow
- $69
Break-even live
UW: 25.0% down · 7.5% · 30yr · 1.5% tax · 5.0% vac · 8.0% maint · 8.0% mgmt
Financing live
Cash to close
- Down payment
- $42,475
- Closing costs
- $5,097
- Reserves months
- —
- Total cash needed
- —
Loan-product check · same deal, 3 products live
Conventional
25% down · 7.5% · 30yr
- Down + closing
- —
- Monthly P&I
- —
- Monthly cashflow
- —
- DSCR
- —
- Eligible?
- —
Personal DTI + credit; lowest rate.
DSCR
20% down · 8.5% · 30yr
- Down + closing
- —
- Monthly P&I
- —
- Monthly cashflow
- —
- DSCR
- —
- Eligible?
- —
No personal income docs; deal must DSCR.
Hard money
10% down · 12.0% · 12mo
- Down + closing
- —
- Monthly P&I
- —
- Monthly cashflow
- —
- DSCR
- —
- Eligible?
- —
Short-term bridge; refi at stabilization.
Rent comps 30 comps
| Address | Beds | Baths | Sqft | Rent | $/sqft | DOM | Units | Dist |
|---|---|---|---|---|---|---|---|---|
| 2710 Dunmoreland Ter Atlanta, GA | 3.0 | 1.0 | 1198 | $1,540 | $1.29 | 43d | 1 | 0.06mi |
| 5370 Longmeadow Ln Atlanta, GA | 3.0 | 2.0 | 1248 | $1,600 | $1.28 | 17d | 1 | 0.26mi |
| 3100 Godby Rd Atlanta, GA | 1.0–2.0 | 1.0–2.5 | 959 | $1,395 | $1.45 | 2d | 34 | 0.28mi |
| 3110 Godby Rd Unit 5d College Park, GA | 2.0 | 2.0 | 1016 | $1,150 | $1.13 | 2d | 1 | 0.35mi |
| 3110 Godby Rd Unit 15a College Park, GA | 2.0 | 1.5 | 1062 | $1,150 | $1.08 | 3d | 1 | 0.35mi |
| 5071 Windsor Forrest Ln Atlanta, GA | 3.0 | 2.5 | 1303 | $1,881 | $1.44 | 13d | 1 | 0.36mi |
| 2817 Windsor Forrest Ct Atlanta, GA | 3.0 | 2.5 | 1408 | $1,697 | $1.21 | 43d | 1 | 0.38mi |
| 5380 Sand Bar Ln Atlanta, GA | 3.0 | 2.0 | 1361 | $1,961 | $1.44 | 4d | 1 | 0.40mi |
| 2883 Windsor Forrest Ct Atlanta, GA | 3.0 | 2.5 | 1115 | $1,895 | $1.70 | 2d | 1 | 0.41mi |
| 2890 Jerome Rd Atlanta, GA | 3.0 | 1.5 | 1229 | $1,761 | $1.43 | 43d | 1 | 0.60mi |
| 5410 Twin Lakes Dr Atlanta, GA | 3.0 | 2.0 | 1277 | $2,040 | $1.60 | 43d | 1 | 0.61mi |
| 2431 Old National Pkwy College Park, GA | 1.0–3.0 | 1.0–2.0 | 1031 | $1,780 | $1.73 | 2d | 1 | 0.66mi |
| 5645 Deerfield Trl Atlanta, GA | 3.0 | 1.5 | 1496 | $1,495 | $1.00 | 22d | 1 | 0.66mi |
| 5712 Westhill Cir Atlanta, GA | 4.0 | 2.0 | 1441 | $1,710 | $1.19 | 3d | 1 | 0.71mi |
| 2301 Godby Rd Atlanta, GA | 2.0 | 1.0 | 1054 | $1,225 | $1.16 | 43d | 1 | 0.80mi |
| 5442 Scofield Rd Atlanta, GA | 3.0 | 1.5 | 1368 | $1,775 | $1.30 | 43d | 1 | 0.97mi |
| 2500 Pleasant Hill Rd Atlanta, GA | 2.0–3.0 | 1.5–2.5 | 1405 | $1,449 | $1.03 | 24d | 2 | 1.01mi |
| 5690 Hampton Ct Atlanta, GA | 2.0 | 3.0 | 1184 | $1,495 | $1.26 | 43d | 1 | 1.01mi |
| 5515 Scofield Rd Atlanta, GA | 3.0 | 2.0 | 1109 | $1,788 | $1.61 | 10d | 1 | 1.02mi |
| 2601 Roosevelt Hwy Atlanta, GA | 3.0 | 1.0–2.5 | 1000 | $1,550 | $1.55 | 1d | 9 | 1.05mi |
| 5267 Joan of Arc Pl Atlanta, GA | 3.0 | 1.0 | 1066 | $1,743 | $1.64 | 43d | 1 | 1.17mi |
| 2210 Sullivan Rd Atlanta, GA | 1.0–3.0 | 1.0–2.0 | 950 | $1,412 | $1.49 | 2d | 17 | 1.21mi |
| 5234 Norman Blvd Atlanta, GA | 3.0 | 2.0 | 1404 | $1,785 | $1.27 | 43d | 1 | 1.27mi |
| 395 Fox Trail Dr Atlanta, GA | 3.0 | 2.0 | 1400 | $1,980 | $1.41 | 11d | 1 | 1.32mi |
| 5850 Old Bill Cook Rd Atlanta, GA | 2.0 | 1.0 | 768 | $1,450 | $1.89 | 43d | 1 | 1.35mi |
| 2001 Godby Rd Atlanta, GA | 1.0–3.0 | 1.5–2.5 | 1275 | $1,425 | $1.12 | 3d | 5 | 1.36mi |
| 5477 Denny Dr Atlanta, GA | 4.0 | 3.0 | 1500 | $1,650 | $1.10 | 43d | 1 | 1.42mi |
| 1951 Southampton Rd Atlanta, GA | 2.0–3.0 | 1.5–2.5 | 1287 | $1,350 | $1.05 | 3d | 50 | 1.44mi |
| 5750 Buffington Rd Atlanta, GA | 1.0–3.0 | 1.0–2.0 | 1142 | $1,702 | $1.49 | 2d | 19 | 1.44mi |
| 5740 Buffington Rd Atlanta, GA | 1.0–3.0 | 1.0–2.5 | 964 | $2,149 | $2.23 | 3d | 16 | 1.46mi |
Listing history 37 events
-
2026-04-27price $169,900 431-char remark
Show marketing remark (431 chars)
New listing in Atlanta that has just hit the market. This all-brick split-level home is situated on an expansive lot of nearly half an acre and includes a convenient double carport. Inside, the home features three spacious bedrooms, two full bathrooms, and one half bathroom. Please let me know if you would like to schedule a viewing. Must have pre-qualification to schedule showings. Agents, please see the MLS remarks. Thank you
-
2026-03-31$174,900 New 431-char remark
Show marketing remark (431 chars)
New listing in Atlanta that has just hit the market. This all-brick split-level home is situated on an expansive lot of nearly half an acre and includes a convenient double carport. Inside, the home features three spacious bedrooms, two full bathrooms, and one half bathroom. Please let me know if you would like to schedule a viewing. Must have pre-qualification to schedule showings. Agents, please see the MLS remarks. Thank you
-
2026-03-31$174,900 Active 431-char remark
Show marketing remark (431 chars)
New listing in Atlanta that has just hit the market. This all-brick split-level home is situated on an expansive lot of nearly half an acre and includes a convenient double carport. Inside, the home features three spacious bedrooms, two full bathrooms, and one half bathroom. Please let me know if you would like to schedule a viewing. Must have pre-qualification to schedule showings. Agents, please see the MLS remarks. Thank you
-
2019-05-08soldstatus $140,000
-
2019-04-29soldstatus $140,000 Closed
-
2019-04-02status Pending
-
2019-03-13$139,900 Active
-
2018-10-24soldstatus $76,000
-
2018-10-04soldstatus $76,000 Sold
-
2018-10-04soldstatus $76,000 Sold
-
2018-09-03status Pending
-
2018-08-27status Under Contract
-
2018-08-27historical Contingent - Due Diligence
-
2018-08-13status Back on Market
-
2018-08-13status Active
-
2018-08-08status Pending
-
2018-07-31status Under Contract
-
2018-07-31historical Contingent - Due Diligence
-
2018-07-20status Back on Market
-
2018-07-20status Active
-
2018-07-07status Pending
-
2018-06-27status Under Contract
-
2018-06-27historical Contingent - Due Diligence
-
2018-06-20$91,900 Active
-
2018-06-20$91,900 New
-
2016-10-14soldstatus $45,000
-
2016-10-12soldstatus $45,000 Sold
-
2016-10-06status Pending Offer Approval
-
2016-09-28price $50,000
-
2016-09-18price $59,999
-
2016-09-02status Back on Market
-
2016-08-22status Under Contract
-
2016-08-04price $70,000
-
2016-06-28$85,000 New
-
1984-06-30soldstatus $52,500
-
1984-06-30soldstatus $52,500
ⓘ Source: listings_history table (triggers on properties + properties_extension) + one-shot
backfill from property_details.listing_events for pre-trigger history.
Tax reassessment forecast GA · Resets to sale price
- Current annual tax
- $3,742 · $312/mo
- Projected year-2 tax
- $3,742 · $312/mo
- Expected delta
- $0/yr ($0/mo · -0.0%)
ⓘ Screening estimate from a state-policy table — verify with the county assessor before closing.
Climate risk First Street
- Flood 1/10 Low FEMA zone X (unshaded) · 0% chance over 30 yrs
- Wildfire 2/10 Low
- Heat 5/10 Major 7 d/yr ≥103°F today · 18 d/yr by 30 yrs out
- Wind 6/10 Major 27% chance of damaging wind over 30 yrs
- Air quality 4/10 Moderate 4 unhealthy d/yr today · 6 by 30 yrs out
Nearby sold comps map
Loading sold comps map…
Walkable amenities ~0.75 mi
Loading nearby amenities…
Taxation est. · year 1
- Rental income
- $20,392
- − Mortgage interest
- −$9,517
- − Property taxes
- −$3,742
- − Insurance
- −$850
- − Repairs & maintenance
- −$1,631
- − Management
- −$1,631
- − Depreciation
- −$4,943
- Taxable loss
- −$1,922
- Est. tax savings @ 24.0%
- +$461
- After-tax cash flow
- $1,287/yr
For passive investors: Depreciation is non-cash, so a rental often shows a tax loss while cash-flowing — sheltering income. Rental losses are passive: they offset passive income freely, and up to $25,000/yr can offset ordinary (W-2) income if you actively participate and your MAGI is under $100k (phasing out to $0 by $150k); unused losses carry forward. On sale, claimed depreciation is recaptured at up to 25%, and gains may owe capital-gains tax (a 1031 exchange can defer both). Figures are a year-1 estimate at your 24.0% rate — not tax advice; consult a CPA.
Schools (NCES district)
- District
- Fulton County
- NCES district ID
- 1302280
- Math proficiency
- 49% ▼ -2.00%
- Reading proficiency
- 53% ▬ 0.00%
- Median HH income
- $68,035
- Composite
- 45.33/100
- National rank
- #2640
- State rank
- #12 of 174 in GA
Livability — South Fulton
No livability data for this city. (Only ~50 U.S. cities are tracked.)
Census & demographics
- Census place
- South Fulton, GA
- County
- Fulton County · 1,094,430 people
- City population
- 127,674
- Metro
- Atlanta-Sandy Springs-Alpharetta, GA
- Population (ZIP)
- 79,872
- Household income
- $67,023
- Rent vs Own
- Severe rent burden
- 4258.0
Population outlook (Fulton County) Hauer SSP2
- Today (2025)
- 1,203,707 people
- By 2030
- 1,299,706 · +8.0%
- By 2040
- 1,488,256 · +23.6%
- By 2050
- 1,664,580 · +38.3%
- By 2075
- 2,036,072 · +69.2%
- By 2100
- 2,222,402 · +84.6%
Race, ethnicity, and origin ACS 2023
- Neighborhood character
- Predominantly Black (89%)
- Race & ethnicity
- Black 89% Hispanic / Latino 5% Two or more races 4% White 3%
- Foreign-born
- 9% · Canada
- Languages at home
- 88% English-only · Spanish 6% French/Haitian/Cajun 1%
Political lean MEDSL · Fulton
- 2024 margin
- Solid D (+44.9) · D 71.9% · R 27.0% · Other 1.1%
- 2008→2024 swing
- +9.8pp toward D · 2008: 35.0pp · 2024: 44.9pp
- All cycles
- 2024: D+44.9 2020: D+46.4 2016: D+42.1 2012: D+29.6 2008: D+35.0
Not yet ingested
- Civics
- —
Market trends
- HPI YoY
- ▲ 18.01%
- Current HPI
- 407.99
- Rent YoY
- ▲ 0.95%
- Metro
- Atlanta-Sandy Springs-Alpharetta, GA
- State GDP YoY
- ▲ 2.66%
- F500 in state
- 28
Industry mix (Fortune 500 HQ in GA)
| Industry | F500 HQs | Revenue |
|---|---|---|
| Paper / Packaging | 2 | $29B |
|
||
| Retail | 1 | $160B |
|
||
| Transportation / Logistics | 1 | $91B |
|
||
| Airlines | 1 | $62B |
|
||
| Consumer Goods | 1 | $47B |
|
||
| Utilities | 1 | $25B |
|
||
Price history
+223.6% since first listed37 events — show timeline
- 2026-04-27 Price Changed $169,900 CBOR
- 2026-04-27 Price Changed $169,900 GAMLS
- 2026-03-31 Listed $174,900 CBOR
- 2026-03-31 Listed $174,900 GAMLS
- 2019-05-08 Sold (Public Records) $140,000 Public Records
- 2019-04-29 Sold (MLS) $140,000 FMLS
- 2019-04-02 Pending — FMLS
- 2019-03-13 Listed $139,900 FMLS
- 2018-10-24 Sold (Public Records) $76,000 Public Records
- 2018-10-04 Sold (MLS) $76,000 GAMLS
- 2018-10-04 Sold (MLS) $76,000 FMLS
- 2018-09-03 Pending — FMLS
- 2018-08-27 Pending — GAMLS
- 2018-08-27 Contingent — FMLS
- 2018-08-13 Relisted — GAMLS
- 2018-08-13 Relisted — FMLS
- 2018-08-08 Pending — FMLS
- 2018-07-31 Pending — GAMLS
- 2018-07-31 Contingent — FMLS
- 2018-07-20 Relisted — GAMLS
- 2018-07-20 Relisted — FMLS
- 2018-07-07 Pending — FMLS
- 2018-06-27 Pending — GAMLS
- 2018-06-27 Contingent — FMLS
- 2018-06-20 Listed $91,900 GAMLS
- 2018-06-20 Listed $91,900 FMLS
- 2016-10-14 Sold (Public Records) $45,000 Public Records
- 2016-10-12 Sold (MLS) $45,000 GAMLS
- 2016-10-06 Pending — GAMLS
- 2016-09-28 Price Changed $50,000 GAMLS
- 2016-09-18 Price Changed $59,999 GAMLS
- 2016-09-02 Relisted — GAMLS
- 2016-08-22 Pending — GAMLS
- 2016-08-04 Price Changed $70,000 GAMLS
- 2016-06-28 Listed $85,000 GAMLS
- 1984-06-30 Sold (Public Records) $52,500 Public Records
- 1984-06-30 Sold (Public Records) $52,500 Public Records
Property tax history
+6.9%/yrLatest (2025): $3,742 · -7.7% YoY. Source: county tax records.
Cash-flow waterfall
monthlySold comps — $/sqft
last 12 mo · ≤1 miLoading sold comps…