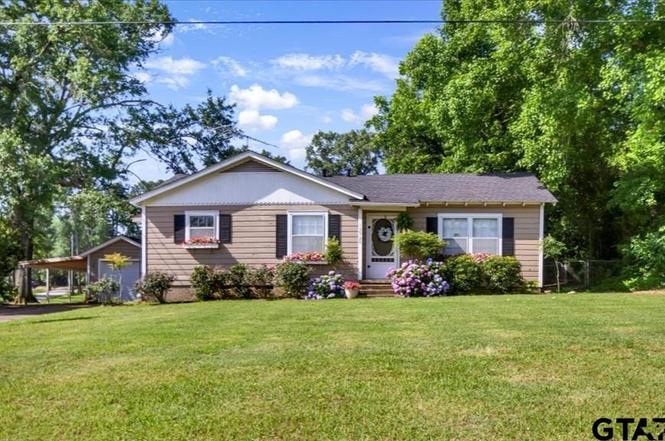
13926 State Highway 64 E · New Chapel Hill, TX
Flood risk 1/10 · Minimal
- FEMA flood zone
- X (unshaded)
- Chance of flooding over 30 yrs
- 0.0%
- Est. flood insurance / yr
- $507 – $1,088
Fire risk 5/10 · Moderate
- Est. fire insurance / yr
- $1,222 – $2,270
Heat risk 6/10 · Moderate
- Hot days now (above 109°F)
- 7 days/yr
- Hot days in 30 yrs
- 25 days/yr
Wind risk 6/10 · Moderate
- Chance of severe wind over 30 yrs
- 68.0%
Air-quality risk 2/10 · Minimal
- Unhealthy air days now
- 0 days/yr
- Unhealthy air days in 30 yrs
- 1 days/yr
Risk factors via First Street. Map © Google.
Why this score? — see what drove the C- grade
The composite is a weighted blend of 9 inputs, each scored 0–100. Each bar is that input's sub-score; the figure is the points it added to the 100-point composite (weight × sub-score).
- Cash flow +22.7/30.0
- ARV discount +7.5/15.0
- DSCR +7.3/10.0
- 1% rule +5.5/10.0
- Rent growth +3.1/5.0
- Livability +2.9/5.0
- Schools +2.5/10.0
- Condition / age +2.5/5.0
- Appreciation +0.0/10.0
$179,900
🖨 Deal sheet 📄 Offer letter ✓ Due diligence
Listing remarks
Step into this beautifully updated 3-bedroom, 1-bath Farmhouse Style Beauty! Enjoy a relaxed feel, very spacious and charming to say the least. Plenty of valuable updates, including the bright, refreshed kitchen with modern appliances and stylish finishes. Make it perfect for everyday and entertaining. Ship-lapped walls throughout. Major updates for peace of mind includes a new roof, HVAC system, and water heater. Beautiful hardwood floors and freshness throughout. Located near Chapel Hill High School, comes with a blend of convenience and charm. This home is move-in ready and full of personality.
Key facts
- Ship-lapped walls
- Modern appliances
- Water heater
Tags
Property features AI
Exterior
- Parking: 1-car garage; Paved parking
- Security: Smoke detector(s)
- Utilities: Cable available; Septic tank
- Home design: Single family residence (detached); Single-story
- Construction: Composition roof
- Exterior features: Chain link and wood fencing; Corner lot; Composition roof
Interior
- Kitchen: Dishwasher; Microwave; Range
- Flooring: Wood
- Bathrooms: 1 full bathroom
- Heating & cooling: Central heating (natural gas); Central air; Ceiling fan(s)
- Interior features: Dishwasher; Microwave; Range; Electric water heater; Wood floors; Ceiling fans; Central air; Central heating (natural gas); Smoke detectors
- Laundry & utility: Electric water heater
Neighborhood map
What this means for you Summary
Snapshot
- This is a 3-bed/1.0-bath single-family listed at $180k.
Deal economics
- At list price, monthly cash flow is $309 ($4k/yr) — positive.
- The deal already cash-flows at list — no discount required.
- Meets the 1% rule at list price ($2k rent vs $180k).
- Recommended offer: $158k (12.0% below list) — sets the bar for market timing.
Location & tenants
- Location reads 57/100 on livability (#1,275 in TX) — a working-class tenant base; expect higher turnover. Strengths: cost of living A+; Watch: employment D, crime D-, amenities F.
- Chapel Hill ISD (rural): math 25% / reading 33% proficiency, ranked #650 of 826 in TX (top 79%) — low school quality limits family demand, transient renter base, plan for 1-2y turnover; 64% free/reduced lunch — lower-income household profile, screen leases tightly.
- Zoned schools: Chapel Hill J H (math 27% / reading 35%, grade F, #1,015 of 1,662 statewide, top 62%, 502 students, 77% FRL); Chapel Hill H S (math 21% / reading 35%, grade F, #1,170 of 1,632 statewide, top 72%, 1,063 students, 75% FRL).
- Market conditions: Rents rising (+2.4%/yr); 188 active listings in the ZIP; solid renter incomes; 595 units permitted in Smith County in 2024 (45 in 5+ unit buildings).
Forward outlook
- Local home prices are declining (-3.0%/yr); year-one equity from $1k of loan paydown is wiped out by about $5k of value loss. Plan a longer hold.
- Smith County population projected at +24% by 2050 — long-run rental-demand tailwind backs the buy-and-hold thesis.
Negotiation context
- It's been on market 156 days — a 12% lower offer ($158k) is reasonable based on typical stale-listing flexibility.
- 2 sale attempts; this cycle's ask has dropped $20k (10%) from the opening price — seller is motivated, your offer sets the floor, not the list.
Risks & watch-outs
- Watch-outs: built in 1950 — expect roof / HVAC / electrical / plumbing capex.
- Climate carrying-cost: major wind risk, 68% chance of damaging wind over 30y; moderate wildfire risk; extreme-heat days projected 7→25/yr by 2055 (HVAC capex compounding) — expect insurance premiums to compound above CPI over the hold.
Questions for the listing agent
- It's been on market 156 days. Have you received any prior offers? Is the seller open to a 12% concession, seller financing, or rate buy-down credit?
- Built in 1950 — when were the roof, HVAC, electrical panel, plumbing, and water heater last replaced?
- Why hasn't it sold? Are there any deal-killer items the seller is aware of (foundation, flood, title, zoning, code violations)?
- Is there a deadline driving the sale (1031 exchange, divorce, estate, relocation)? That informs how much negotiation room exists.
- Schools are F-rated, which usually means shorter tenancies and higher turnover. Who's the typical renter profile here, and what's been the actual vacancy rate?
- Crime grade is D in this area — have there been break-ins, vandalism, or insurance claims at this property in the last 3 years? What carrier currently insures it and at what premium?
- What's the average days-on-market for RENTAL listings here right now (not sales)? A rising rental-DOM trend means longer vacancies and softer asking-rent achievability than the comps imply.
- What's the recent tenant-quality profile in this submarket — average credit score on applications, eviction rate, late-payment / NSF rate, and stable-employment percentage? A property-management company in the area should have these aggregated.
- How much new for-sale + rental construction is in the pipeline within 1–3 miles? Heavy new supply typically softens prices + rents 12–24 months out; constrained supply supports both.
Investment metrics
- 1% rule
- 1.05% ✓
- Cap rate
- 8.35%
- Cash-on-cash
- 7.35%
- DSCR
- 1.33
- GRM
- 8.0
CMA / ARV
No comps found within radius.
Projected returns pro-forma
-3.0% appreciation · 2.37% rent growth · sell at horizon
- IRR
- -5.7%
- Equity multiple
- 0.79×
- Total profit
- $-10,695
- Equity at exit
- $26,824
- IRR
- 3.2%
- Equity multiple
- 1.22×
- Total profit
- $11,144
- Equity at exit
- $15,554
Cash invested: $50,372 (down + closing). Projections, not guarantees.
Landlord ↔ Tenant lean methodology
- Overall (STATE)
- 87 Strongly Landlord-Friendly
- State Texas
- 87 Strongly Landlord-Friendly · R+5
- County
- — inherits STATE
- City
- — inherits STATE
ZIP-level market 75707
- Home prices YoY
- -24.8%
- Rents YoY
- 2.4%
- Active inventory
- 188
- Price-to-rent
- 8.0×
Monthly cashflow live
- Estimated rent
- $1,880 medium interval (Pro) →
- Mortgage (P&I)
- −$943
- Tax from tax record
- −$158 /mo · $1,899/yr
- Insurance
- −$75
- HOA
- −$0
- Vacancy / Maint / Mgmt
- −$395
- Net cashflow
- $309
Break-even live
UW: 25.0% down · 7.5% · 30yr · 1.5% tax · 5.0% vac · 8.0% maint · 8.0% mgmt
Financing live
Cash to close
- Down payment
- $44,975
- Closing costs
- $5,397
- Reserves months
- —
- Total cash needed
- —
Loan-product check · same deal, 3 products live
Conventional
25% down · 7.5% · 30yr
- Down + closing
- —
- Monthly P&I
- —
- Monthly cashflow
- —
- DSCR
- —
- Eligible?
- —
Personal DTI + credit; lowest rate.
DSCR
20% down · 8.5% · 30yr
- Down + closing
- —
- Monthly P&I
- —
- Monthly cashflow
- —
- DSCR
- —
- Eligible?
- —
No personal income docs; deal must DSCR.
Hard money
10% down · 12.0% · 12mo
- Down + closing
- —
- Monthly P&I
- —
- Monthly cashflow
- —
- DSCR
- —
- Eligible?
- —
Short-term bridge; refi at stabilization.
Listing history 23 events
-
2026-06-15status $179,900 Pending 156 DOM
-
2026-06-15days on market $179,900 Active 156 DOM
-
2026-06-14days on market $179,900 Active 154 DOM
-
2026-06-13days on market $179,900 Active 153 DOM
-
2026-06-10days on market $179,900 Active 151 DOM
-
2026-06-09days on market $179,900 Active 150 DOM
-
2026-06-08days on market $179,900 Active 149 DOM
-
2026-06-07days on market $179,900 Active 148 DOM
-
2026-06-02days on market $179,900 Active 143 DOM
-
2026-06-01days on market $179,900 Active 142 DOM
-
2026-05-31days on market $179,900 Active 141 DOM
-
2026-05-30days on market $179,900 Active 140 DOM
-
2026-05-24price $179,900
-
2026-04-22status Active
-
2026-03-07status Pending
-
2026-02-24price $184,900
-
2026-02-19price $189,500
-
2026-01-05price $194,900
-
2025-11-26$199,900 Active
-
2025-07-24price $195,000
-
2025-06-24price $199,000
-
2025-06-11price $215,000
-
2014-04-21soldstatus
ⓘ Source: listings_history table (triggers on properties + properties_extension) + one-shot
backfill from property_details.listing_events for pre-trigger history.
Tax reassessment forecast TX · Resets to sale price
- Current annual tax
- $1,899 · $158/mo
- Projected year-2 tax
- $3,292 · $274/mo
- Expected delta
- +$1,393/yr (+$116/mo · 73.3%)
ⓘ Screening estimate from a state-policy table — verify with the county assessor before closing.
Climate risk First Street
- Flood 1/10 Low FEMA zone X (unshaded) · 0% chance over 30 yrs
- Wildfire 5/10 Major
- Heat 6/10 Major 7 d/yr ≥109°F today · 25 d/yr by 30 yrs out
- Wind 6/10 Major 68% chance of damaging wind over 30 yrs
- Air quality 2/10 Low 0 unhealthy d/yr today · 1 by 30 yrs out
Nearby sold comps map
Loading sold comps map…
Walkable amenities ~0.75 mi
Loading nearby amenities…
Taxation est. · year 1
- Rental income
- $22,560
- − Mortgage interest
- −$10,077
- − Property taxes
- −$1,899
- − Insurance
- −$900
- − Repairs & maintenance
- −$1,805
- − Management
- −$1,805
- − Depreciation
- −$5,233
- Taxable income
- $841
- Est. tax owed @ 24.0%
- −$202
- After-tax cash flow
- $3,501/yr
For passive investors: Depreciation is non-cash, so a rental often shows a tax loss while cash-flowing — sheltering income. Rental losses are passive: they offset passive income freely, and up to $25,000/yr can offset ordinary (W-2) income if you actively participate and your MAGI is under $100k (phasing out to $0 by $150k); unused losses carry forward. On sale, claimed depreciation is recaptured at up to 25%, and gains may owe capital-gains tax (a 1031 exchange can defer both). Figures are a year-1 estimate at your 24.0% rate — not tax advice; consult a CPA.
Schools (NCES district)
- District
- Chapel Hill ISD
- NCES district ID
- 4813650
- Math proficiency
- 25% ▼ -10.00%
- Reading proficiency
- 33% ▼ -5.00%
- Median HH income
- $43,891
- Composite
- 24.76/100
- National rank
- #7603
- State rank
- #650 of 826 in TX
Livability — New Chapel Hill
- Score
- 57/100
- State rank
- #1275
- US rank
- #22160
Category grades
Schools grade is shown separately in the Schools card above.
Census & demographics
- Census place
- New Chapel Hill, TX
- County
- Smith County · 180,570 people
- City population
- 16,355
- Metro
- Tyler, TX
- Population (ZIP)
- 17,532
- Household income
- $84,954
- Rent vs Own
- Severe rent burden
- 304.0
Population outlook (Smith County) Hauer SSP2
- Today (2025)
- 248,890 people
- By 2030
- 261,665 · +5.1%
- By 2040
- 286,114 · +15.0%
- By 2050
- 308,006 · +23.8%
- By 2075
- 354,171 · +42.3%
- By 2100
- 372,828 · +49.8%
Race, ethnicity, and origin ACS 2023
- Neighborhood character
- Predominantly White (72%)
- Race & ethnicity
- White 72% Hispanic / Latino 14% Black 10% Two or more races 6% Asian 2%
- Hispanic origin (detail)
- Mexican 13%
- Common ancestry
- Slovak 1% Italian 1% Iranian 1%
- Foreign-born
- 5% · Canada
- Languages at home
- 88% English-only · Spanish 10% Other Indo-European 1% Tagalog/Filipino 1%
Political lean MEDSL · Smith
- 2024 margin
- Solid R (+45.1) · D 27.0% · R 72.1%
- 2008→2024 swing
- -5.6pp toward R · 2008: -39.5pp · 2024: -45.1pp
- All cycles
- 2024: R+45.1 2020: R+39.4 2016: R+43.9 2012: R+46.9 2008: R+39.5
Not yet ingested
- Civics
- —
Market trends
- HPI YoY
- ▼ -64.97%
- Current HPI
- 196.577
- Rent YoY
- ▲ 2.37%
- Metro
- Tyler, TX
- State GDP YoY
- ▲ 3.95%
- F500 in state
- 110
Industry mix (Fortune 500 HQ in TX)
| Industry | F500 HQs | Revenue |
|---|---|---|
| Energy | 16 | $1,198B |
|
||
| Technology | 5 | $198B |
|
||
| Engineering / Construction | 4 | $72B |
|
||
| Energy Services | 3 | $60B |
|
||
| Utilities | 3 | $41B |
|
||
| Healthcare | 2 | $330B |
|
||
Price history
-16.3% since first listed11 events — show timeline
- 2026-05-24 Price Changed $179,900 GTAR
- 2026-04-22 Relisted — GTAR
- 2026-03-07 Pending — GTAR
- 2026-02-24 Price Changed $184,900 GTAR
- 2026-02-19 Price Changed $189,500 GTAR
- 2026-01-05 Price Changed $194,900 GTAR
- 2025-11-26 Listed $199,900 GTAR
- 2025-07-24 Price Changed $195,000 GTAR
- 2025-06-24 Price Changed $199,000 GTAR
- 2025-06-11 Price Changed $215,000 GTAR
- 2014-04-21 Sold (Public Records) — Public Records
Property tax history
+6.4%/yrLatest (2024): $1,899 · +21.3% YoY. Source: county tax records.
Cash-flow waterfall
monthlySold comps — $/sqft
last 12 mo · ≤1 miLoading sold comps…