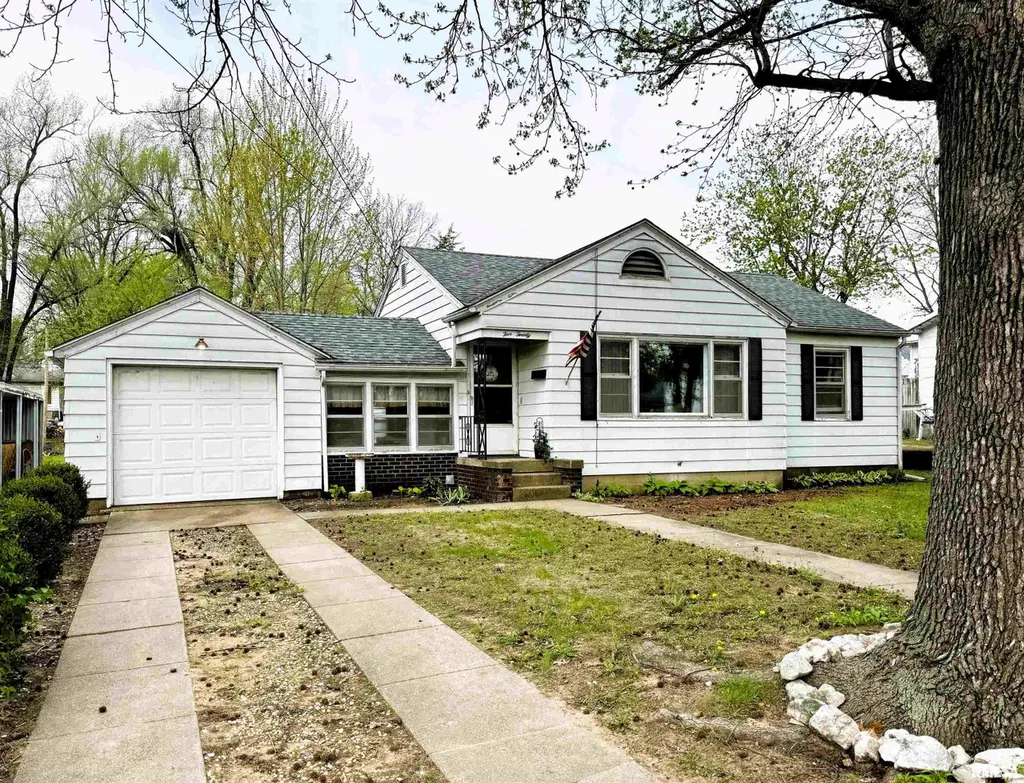
520 S Pearl St · Havana, IL
Flood risk 1/10 · Minimal
- FEMA flood zone
- X (unshaded)
- Chance of flooding over 30 yrs
- 0.0%
- Est. flood insurance / yr
- $473 – $860
Fire risk 1/10 · Minimal
- Est. fire insurance / yr
- $804 – $1,492
Heat risk 3/10 · Minor
- Hot days now (above 107°F)
- 7 days/yr
- Hot days in 30 yrs
- 19 days/yr
Wind risk 2/10 · Minimal
- Chance of severe wind over 30 yrs
- 1.0%
Air-quality risk 2/10 · Minimal
- Unhealthy air days now
- 1 days/yr
- Unhealthy air days in 30 yrs
- 2 days/yr
Risk factors via First Street. Map © Google.
Why this score? — see what drove the B- grade
The composite is a weighted blend of 9 inputs, each scored 0–100. Each bar is that input's sub-score; the figure is the points it added to the 100-point composite (weight × sub-score).
- Cash flow +30.0/30.0
- DSCR +10.0/10.0
- 1% rule +9.1/10.0
- ARV discount +7.5/15.0
- Livability +3.0/5.0
- Rent growth +2.5/5.0
- Condition / age +2.5/5.0
- Schools +1.7/10.0
- Appreciation +0.0/10.0
$89,000
🖨 Deal sheet 📄 Offer letter ✓ Due diligence
Listing remarks MLS
Charming and well-maintained 3-bedroom, 1-bath bungalow with an attached garage. The main level offers a bright living room, an eat-in kitchen, three comfortable bedrooms, a full bath, and the convenience of main-floor laundry. All kitchen appliances are included—plus the washer and dryer. The full basement provides excellent storage and potential for additional living space. Step outside to enjoy the rear patio, storage shed, and a generous backyard. Roof updated in 2019. This adorable home is move-in ready!
Key facts
- 0.23 acre lot
- Garage
- Built 1953
Neighborhood map
What this means for you Summary
Snapshot
- This is a 3-bed/1.0-bath single-family listed at $89k.
Deal economics
- At list price, monthly cash flow is $402 ($5k/yr) — positive.
- The deal already cash-flows at list — no discount required.
- Meets the 1% rule at list price ($1k rent vs $89k).
- Recommended offer: $88k (1.5% below list) — sets the bar for market timing.
Location & tenants
- Location reads 60/100 on livability (#989 in IL) — a middle-class / working-renter tenant base. Strengths: cost of living A+, housing A+; Watch: schools D-, crime F, amenities F.
- Havana CUSD 126 (town): math 17% / reading 22% proficiency, ranked #448 of 620 in IL (top 72%) — low school quality limits family demand, transient renter base, plan for 1-2y turnover.
- Market conditions: 36 active listings in the ZIP; 7 units permitted in Mason County in 2024 (0 in 5+ unit buildings).
Forward outlook
- Local home prices are declining (-3.0%/yr); year-one equity from $615 of loan paydown is wiped out by about $3k of value loss. Plan a longer hold.
- Mason County population projected at -30% by 2050 — secular population decline; favor cash flow + early exit over multi-decade hold.
- At projected returns (-3.0% appreciation + 3.0% rent growth), your $25k cash investment doubles in ~7 years — after that, you're playing with house money.
Negotiation context
- It's been on market 21 days — a 2% lower offer ($88k) is reasonable based on typical stale-listing flexibility.
Risks & watch-outs
- Watch-outs: built in 1953 — expect roof / HVAC / electrical / plumbing capex.
Questions for the listing agent
- Built in 1953 — when were the roof, HVAC, electrical panel, plumbing, and water heater last replaced?
- Is there a deadline driving the sale (1031 exchange, divorce, estate, relocation)? That informs how much negotiation room exists.
- Schools are D-rated, which usually means shorter tenancies and higher turnover. Who's the typical renter profile here, and what's been the actual vacancy rate?
- Crime grade is F in this area — have there been break-ins, vandalism, or insurance claims at this property in the last 3 years? What carrier currently insures it and at what premium?
- What's the average days-on-market for RENTAL listings here right now (not sales)? A rising rental-DOM trend means longer vacancies and softer asking-rent achievability than the comps imply.
- What's the recent tenant-quality profile in this submarket — average credit score on applications, eviction rate, late-payment / NSF rate, and stable-employment percentage? A property-management company in the area should have these aggregated.
- How much new for-sale + rental construction is in the pipeline within 1–3 miles? Heavy new supply typically softens prices + rents 12–24 months out; constrained supply supports both.
Investment metrics
- 1% rule
- 1.41% ✓
- Cap rate
- 11.71%
- Cash-on-cash
- 19.35%
- DSCR
- 1.86
- GRM
- 5.9
CMA / ARV
- ARV (median comp)
- $39,845
- List price
- $89,000
- Delta
- 123.36%
- Verdict
- OVERPRICED
- Comps
- 20 within 1.0 mi
Show comp detail 9 sales within ~0.75 mi
| Address | Dist | Beds/Ba | Sqft | Sold | Price | $/sf | Match |
|---|---|---|---|---|---|---|---|
| 520 S Pearl St | 0.00mi | 3/1.0 | 792 (0%) | 0mo | $82,000 | $104 | 100 |
| 128 E Dearborn St | 0.01mi | 2/1.0 (-1) | 840 (+6%) | 8mo | $45,000 | $54 | 77 |
| 529 S Schrader St | 0.28mi | 2/1.0 (-1) | 800 (+1%) | 13mo | $33,000 | $41 | 69 |
| 312 W 1st St | 0.25mi | 2/1.0 (-1) | 864 (+9%) | 8mo | $38,000 | $44 | 61 |
| 700 S Promenade St | 0.19mi | 2/1.0 (-1) | 905 (+14%) | 2mo | $60,000 | $66 | 61 |
| 313 N Pearl St | 0.58mi | 2/1.0 (-1) | 840 (+6%) | 4mo | $35,000 | $42 | 55 |
| 535 S Schrader St | 0.28mi | 2/1.0 (-1) | 728 (-8%) | 17mo | $30,000 | $41 | 55 |
| 1135 S Pear St | 0.62mi | 2/1.0 (-1) | 862 (+9%) | 2mo | $15,000 | $17 | 50 |
| 425 N Broadway St | 0.68mi | 2/1.0 (-1) | 888 (+12%) | 21mo | $47,000 | $53 | 26 |
Match score weights: distance 35% · size 25% · config 20% · recency 20%. Top-matched comps best support the ARV.
Projected returns pro-forma
-3.0% appreciation · 3.0% rent growth · sell at horizon
- IRR
- 11.3%
- Equity multiple
- 1.45×
- Total profit
- $11,175
- Equity at exit
- $13,270
- IRR
- 20.3%
- Equity multiple
- 2.71×
- Total profit
- $42,703
- Equity at exit
- $7,695
Cash invested: $24,920 (down + closing). Projections, not guarantees.
Landlord ↔ Tenant lean methodology
- Overall (STATE)
- 43 Moderately Tenant-Leaning
- State Illinois
- 43 Moderately Tenant-Leaning · D+7
- County
- — inherits STATE
- City
- — inherits STATE
ZIP-level market 62644
- Home prices YoY
- -14.0%
- Active inventory
- 36
- Price-to-rent
- 5.9×
Monthly cashflow live
- Estimated rent
- $1,256 medium interval (Pro) →
- Mortgage (P&I)
- −$467
- Tax from tax record
- −$87 /mo · $1,043/yr
- Insurance
- −$37
- HOA
- −$0
- Vacancy / Maint / Mgmt
- −$264
- Net cashflow
- $402
Break-even live
UW: 25.0% down · 7.5% · 30yr · 1.5% tax · 5.0% vac · 8.0% maint · 8.0% mgmt
Financing live
Cash to close
- Down payment
- $22,250
- Closing costs
- $2,670
- Reserves months
- —
- Total cash needed
- —
Loan-product check · same deal, 3 products live
Conventional
25% down · 7.5% · 30yr
- Down + closing
- —
- Monthly P&I
- —
- Monthly cashflow
- —
- DSCR
- —
- Eligible?
- —
Personal DTI + credit; lowest rate.
DSCR
20% down · 8.5% · 30yr
- Down + closing
- —
- Monthly P&I
- —
- Monthly cashflow
- —
- DSCR
- —
- Eligible?
- —
No personal income docs; deal must DSCR.
Hard money
10% down · 12.0% · 12mo
- Down + closing
- —
- Monthly P&I
- —
- Monthly cashflow
- —
- DSCR
- —
- Eligible?
- —
Short-term bridge; refi at stabilization.
Listing history 2 events
-
2026-05-05status Pending 520-char remark
Show marketing remark (520 chars)
Charming and well-maintained 3-bedroom, 1-bath bungalow with an attached garage. The main level offers a bright living room, an eat-in kitchen, three comfortable bedrooms, a full bath, and the convenience of main-floor laundry. All kitchen appliances are included—plus the washer and dryer. The full basement provides excellent storage and potential for additional living space. Step outside to enjoy the rear patio, storage shed, and a generous backyard. Roof updated in 2019. This adorable home is move-in ready!
-
2026-04-14$89,000 Active 520-char remark
Show marketing remark (520 chars)
Charming and well-maintained 3-bedroom, 1-bath bungalow with an attached garage. The main level offers a bright living room, an eat-in kitchen, three comfortable bedrooms, a full bath, and the convenience of main-floor laundry. All kitchen appliances are included—plus the washer and dryer. The full basement provides excellent storage and potential for additional living space. Step outside to enjoy the rear patio, storage shed, and a generous backyard. Roof updated in 2019. This adorable home is move-in ready!
ⓘ Source: listings_history table (triggers on properties + properties_extension) + one-shot
backfill from property_details.listing_events for pre-trigger history.
Tax reassessment forecast IL · Partial reset (capped growth)
- Current annual tax
- $1,043 · $87/mo
- Projected year-2 tax
- $1,531 · $128/mo
- Expected delta
- +$489/yr (+$41/mo · 46.9%)
ⓘ Screening estimate from a state-policy table — verify with the county assessor before closing.
Climate risk First Street
- Flood 1/10 Low FEMA zone X (unshaded) · 0% chance over 30 yrs
- Wildfire 1/10 Low
- Heat 3/10 Moderate 7 d/yr ≥107°F today · 19 d/yr by 30 yrs out
- Wind 2/10 Low 100% chance of damaging wind over 30 yrs
- Air quality 2/10 Low 1 unhealthy d/yr today · 2 by 30 yrs out
Nearby sold comps map
Loading sold comps map…
Walkable amenities ~0.75 mi
Loading nearby amenities…
Taxation est. · year 1
- Rental income
- $15,076
- − Mortgage interest
- −$4,985
- − Property taxes
- −$1,043
- − Insurance
- −$445
- − Repairs & maintenance
- −$1,206
- − Management
- −$1,206
- − Depreciation
- −$2,589
- Taxable income
- $3,602
- Est. tax owed @ 24.0%
- −$864
- After-tax cash flow
- $3,958/yr
For passive investors: Depreciation is non-cash, so a rental often shows a tax loss while cash-flowing — sheltering income. Rental losses are passive: they offset passive income freely, and up to $25,000/yr can offset ordinary (W-2) income if you actively participate and your MAGI is under $100k (phasing out to $0 by $150k); unused losses carry forward. On sale, claimed depreciation is recaptured at up to 25%, and gains may owe capital-gains tax (a 1031 exchange can defer both). Figures are a year-1 estimate at your 24.0% rate — not tax advice; consult a CPA.
Schools (NCES district)
- District
- Havana CUSD 126
- NCES district ID
- 1718510
- Math proficiency
- 17% ▼ -10.00%
- Reading proficiency
- 22% ▼ -16.00%
- Median HH income
- $39,881
- Composite
- 16.52/100
- National rank
- #9181
- State rank
- #448 of 620 in IL
Livability — Havana
- Score
- 60/100
- State rank
- #989
- US rank
- #19077
Category grades
Schools grade is shown separately in the Schools card above.
Census & demographics
- Census place
- Havana, IL
- City population
- 4,657
- Population (ZIP)
- 4,657
Population outlook (Mason County) Hauer SSP2
- Today (2025)
- 12,087 people
- By 2030
- 11,283 · -6.7%
- By 2040
- 9,766 · -19.2%
- By 2050
- 8,421 · -30.3%
- By 2075
- 5,785 · -52.1%
- By 2100
- 3,888 · -67.8%
Race, ethnicity, and origin ACS 2023
- Neighborhood character
- Predominantly White (93%)
- Race & ethnicity
- White 93% Two or more races 3% Hispanic / Latino 3%
- Common ancestry
- Slovak 3% Lithuanian 2% Italian 2%
- Foreign-born
- 1% · Canada, Jamaica
- Languages at home
- 98% English-only · Spanish 2%
Political lean MEDSL · Mason
- 2024 margin
- Solid R (+42.2) · D 27.8% · R 70.1% · Other 2.1%
- 2008→2024 swing
- -48.1pp toward R · 2008: 5.9pp · 2024: -42.2pp
- All cycles
- 2024: R+42.2 2020: R+39.5 2016: R+31.8 2012: R+6.3 2008: D+5.9
Not yet ingested
- Civics
- —
Market trends
- HPI YoY
- ▼ -18.81%
- Current HPI
- 115.1077
- Rent YoY
- —
- Metro
- —
- State GDP YoY
- ▲ 1.59%
- F500 in state
- 60
Industry mix (Fortune 500 HQ in IL)
| Industry | F500 HQs | Revenue |
|---|---|---|
| Insurance | 4 | $201B |
|
||
| Consumer Goods | 4 | $87B |
|
||
| Industrial Machinery | 3 | $64B |
|
||
| Healthcare | 2 | $55B |
|
||
| Retail / Pharmacy | 1 | $148B |
|
||
| Agriculture / Food | 1 | $86B |
|
||
Price history
2 events — show timeline
- 2026-05-05 Pending — RMLSA as Distributed by MLS Grid
- 2026-04-14 Listed $89,000 RMLSA as Distributed by MLS Grid
Property tax history
-5.1%/yrLatest (2024): $1,043 · -4.5% YoY. Source: county tax records.
Cash-flow waterfall
monthlySold comps — $/sqft
last 12 mo · ≤1 miLoading sold comps…