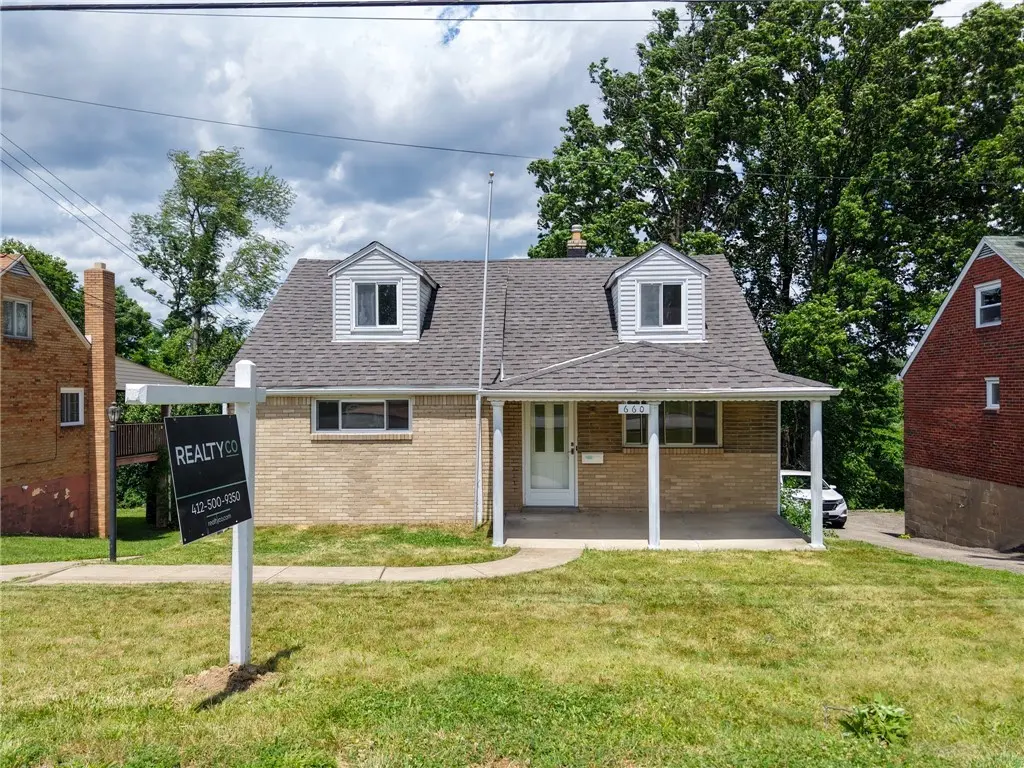
660 Valemont Dr · Penn Hills, PA
Flood risk 1/10 · Minimal
- FEMA flood zone
- X (unshaded)
- Chance of flooding over 30 yrs
- 0.0%
- Est. flood insurance / yr
- $473 – $860
Fire risk 1/10 · Minimal
- Est. fire insurance / yr
- $511 – $949
Heat risk 3/10 · Minor
- Hot days now (above 96°F)
- 6 days/yr
- Hot days in 30 yrs
- 13 days/yr
Wind risk 2/10 · Minimal
- Chance of severe wind over 30 yrs
- —
Air-quality risk 4/10 · Minor
- Unhealthy air days now
- 5 days/yr
- Unhealthy air days in 30 yrs
- 7 days/yr
Risk factors via First Street. Map © Google.
Why this score? — see what drove the C grade
The composite is a weighted blend of 9 inputs, each scored 0–100. Each bar is that input's sub-score; the figure is the points it added to the 100-point composite (weight × sub-score).
- Cash flow +21.1/30.0
- ARV discount +15.0/15.0
- DSCR +6.7/10.0
- 1% rule +5.6/10.0
- Rent growth +2.5/5.0
- Livability +2.5/5.0
- Condition / age +2.5/5.0
- Schools +1.6/10.0
- Appreciation +0.0/10.0
$165,000
🖨 Deal sheet 📄 Offer letter ✓ Due diligence
Listing remarks MLS
Well Maintained Cape Cod on Quiet Dead End Street. Move In Ready!!! Awesome Eat-In-Kitchen with Twin Sinks, Nice Counters, & Custom Built Cabinetry. Tile Flooring. Updated Bath. Well Insulated Plastered Walls. Custom-Built Woodwork Thoughout. Hardwood Floors Under Carpet. Comfy Front Porch & Rear Deck. Beautiful Slated Entry. Bright Newly Painted Full Basement with High Ceiling. Ample Parking Spaces in Back. Home Warranty Included!!!
Key facts
- 0.24 acre lot
- Garage
- Built 1955
Property features AI
Exterior
- Parking: Attached garage; Off-street parking
- Utilities: Public water; Public sewer
- Home design: 2-story; Resale property
- Construction: Brick construction; Asphalt roof
Interior
- Kitchen: Dishwasher; Microwave; Stove; Refrigerator; Some gas appliances
- Flooring: Carpet
- Bathrooms: 2 full bathrooms
- Heating & cooling: Gas heating
- Interior features: Basement; Window screens
- Laundry & utility: Washer; Dryer
Neighborhood map
What this means for you Summary
Snapshot
- This is a 3-bed/2.0-bath single-family listed at $165k.
Deal economics
- At list price, monthly cash flow is $235 ($3k/yr) — positive.
- The deal already cash-flows at list — no discount required.
- Meets the 1% rule at list price ($2k rent vs $165k).
Location & tenants
- Location reads: area grade C — affects rentability + tenant quality, not the cash-flow math above.
- Penn Hills SD (suburban): math 13% / reading 24% proficiency, ranked #496 of 539 in PA (top 92%) — low school quality limits family demand, transient renter base, plan for 1-2y turnover.
- Market conditions: 64 active listings in the ZIP; 13 comparable units currently listed for rent nearby; rentals leasing fast (median 8d on market — plan ~1-2 weeks tenant-placement turnaround); 2,996 units permitted in Allegheny County in 2024 (1,588 in 5+ unit buildings).
- This rent runs 31% of the median local income ($67k/yr) — at the standard rent-burdened threshold; future hikes will face affordability resistance.
Forward outlook
- Local home prices are declining (-3.0%/yr); year-one equity from $1k of loan paydown is wiped out by about $5k of value loss. Plan a longer hold.
Negotiation context
- Only 1 days on market — expect competitive offers; lowballing is unlikely to land.
- 3 sale attempts since 12y ago with the ask held roughly flat each time — persistent listings suggest the price (not the market) is what's stuck; bring a comps-based counter.
- Current owner paid $61k; list at $165k implies a 170% gain — meaningful room to come down on a strong offer.
Risks & watch-outs
- Watch-outs: built in 1955 — expect roof / HVAC / electrical / plumbing capex.
Questions for the listing agent
- Built in 1955 — when were the roof, HVAC, electrical panel, plumbing, and water heater last replaced?
- Is there a deadline driving the sale (1031 exchange, divorce, estate, relocation)? That informs how much negotiation room exists.
- What's the average days-on-market for RENTAL listings here right now (not sales)? A rising rental-DOM trend means longer vacancies and softer asking-rent achievability than the comps imply.
- What's the recent tenant-quality profile in this submarket — average credit score on applications, eviction rate, late-payment / NSF rate, and stable-employment percentage? A property-management company in the area should have these aggregated.
- How much new for-sale + rental construction is in the pipeline within 1–3 miles? Heavy new supply typically softens prices + rents 12–24 months out; constrained supply supports both.
Investment metrics
- 1% rule
- 1.06% ✓
- Cap rate
- 8.00%
- Cash-on-cash
- 6.10%
- DSCR
- 1.27
- GRM
- 7.9
CMA / ARV
- ARV (on-the-fly)
- $199,200
- Comps found
- 12
Show comp detail 12 sales within ~0.75 mi
| Address | Dist | Beds/Ba | Sqft | Sold | Price | $/sf | Match |
|---|---|---|---|---|---|---|---|
| 620 Sara Ln | 0.12mi | 3/2.0 | 1,232 (+3%) | 2mo | $205,000 | $166 | 88 |
| 863 Hamil Rd | 0.23mi | 3/2.0 | 1,224 (+2%) | 8mo | $169,000 | $138 | 80 |
| 168 Lois Dr | 0.45mi | 3/2.0 | 1,224 (+2%) | 2mo | $249,900 | $204 | 74 |
| 237 Northmont Dr | 0.25mi | 3/1.5 | 1,118 (-7%) | 9mo | $183,000 | $164 | 68 |
| 127 Greenview Dr | 0.33mi | 4/2.0 (+1) | 1,224 (+2%) | 11mo | $242,000 | $198 | 67 |
| 138 Glenhurst Dr | 0.32mi | 3/2.0 | 1,318 (+10%) | 5mo | $210,000 | $159 | 65 |
| 125 Glenhurst Dr | 0.32mi | 3/2.0 | 1,346 (+12%) | 1mo | $240,501 | $179 | 64 |
| 624 Elm Dr | 0.39mi | 2/1.0 (-1) | 1,296 (+8%) | 1mo | $114,000 | $88 | 59 |
| 107 Agate Dr | 0.40mi | 3/2.5 | 1,324 (+10%) | 6mo | $220,000 | $166 | 57 |
| 559 Hamil Rd | 0.54mi | 3/1.0 | 1,056 (-12%) | 2mo | $174,900 | $166 | 49 |
| 819 8th St | 0.71mi | 3/1.0 | 1,125 (-6%) | 5mo | $169,000 | $150 | 49 |
| 669 Idaho Ave | 0.55mi | 3/2.0 | 1,346 (+12%) | 11mo | $200,000 | $149 | 45 |
Match score weights: distance 35% · size 25% · config 20% · recency 20%. Top-matched comps best support the ARV.
Projected returns pro-forma
-3.0% appreciation · 3.0% rent growth · sell at horizon
- IRR
- -6.9%
- Equity multiple
- 0.75×
- Total profit
- $-11,738
- Equity at exit
- $24,602
- IRR
- 2.8%
- Equity multiple
- 1.20×
- Total profit
- $9,176
- Equity at exit
- $14,266
Cash invested: $46,200 (down + closing). Projections, not guarantees.
Landlord ↔ Tenant lean methodology
- Overall (STATE)
- 62 Landlord-Friendly
- State Pennsylvania
- 62 Landlord-Friendly · EVEN
- County
- — inherits STATE
- City
- — inherits STATE
ZIP-level market 15147
- Home prices YoY
- -26.0%
- Active inventory
- 64
- Price-to-rent
- 7.9×
Monthly cashflow live
- Estimated rent
- $1,748 high interval (Pro) →
- Mortgage (P&I)
- −$865
- Tax from tax record
- −$212 /mo · $2,541/yr
- Insurance
- −$69
- HOA
- −$0
- Vacancy / Maint / Mgmt
- −$367
- Net cashflow
- $235
Break-even live
UW: 25.0% down · 7.5% · 30yr · 1.5% tax · 5.0% vac · 8.0% maint · 8.0% mgmt
Financing live
Cash to close
- Down payment
- $41,250
- Closing costs
- $4,950
- Reserves months
- —
- Total cash needed
- —
Loan-product check · same deal, 3 products live
Conventional
25% down · 7.5% · 30yr
- Down + closing
- —
- Monthly P&I
- —
- Monthly cashflow
- —
- DSCR
- —
- Eligible?
- —
Personal DTI + credit; lowest rate.
DSCR
20% down · 8.5% · 30yr
- Down + closing
- —
- Monthly P&I
- —
- Monthly cashflow
- —
- DSCR
- —
- Eligible?
- —
No personal income docs; deal must DSCR.
Hard money
10% down · 12.0% · 12mo
- Down + closing
- —
- Monthly P&I
- —
- Monthly cashflow
- —
- DSCR
- —
- Eligible?
- —
Short-term bridge; refi at stabilization.
Rent comps 13 comps
| Address | Beds | Baths | Sqft | Rent | $/sqft | DOM | Units | Dist |
|---|---|---|---|---|---|---|---|---|
| 624 Elm Dr Verona, PA | 3.0 | 1.0 | 1296 | $1,600 | $1.23 | 2d | 1 | 0.42mi |
| 724 7th St Verona, PA | 2.0 | 2.0 | 1157 | $1,899 | $1.64 | 7d | 1 | 0.74mi |
| 1666 Relative Dr Verona, PA | 2.0–3.0 | 1.0–1.5 | 1255 | $1,499 | $1.19 | 1d | 3 | 1.01mi |
| 149 Parkwood Dr Verona, PA | 3.0 | 1.0 | 1085 | $1,500 | $1.38 | 43d | 1 | 1.01mi |
| 6184 Poketa Rd Verona, PA | 3.0 | 2.0 | 1325 | $1,750 | $1.32 | 3d | 1 | 1.28mi |
| 635 Valley St Oakmont, PA | 3.0 | 2.0 | 1320 | $2,100 | $1.59 | 1d | 1 | 1.30mi |
| 635 Valley St Oakmont, PA | 3.0 | 2.0 | 1320 | $2,100 | $1.59 | 7d | 1 | 1.30mi |
| 635 Valley St Unit NA Oakmont, PA | 3.0 | 2.0 | 1320 | $2,000 | $1.52 | 10d | 1 | 1.30mi |
| 635 Valley St Oakmont, PA | 3.0 | 2.0 | 1320 | $2,100 | $1.59 | 14d | 1 | 1.30mi |
| 6388 Saltsburg Rd Pittsburgh, PA | 2.0 | 1.5 | 875 | $1,300 | $1.49 | 3d | 1 | 1.35mi |
| 6703 W Barivista Dr Verona, PA | 3.0 | 2.0 | 1100 | $1,399 | $1.27 | 4d | 1 | 1.43mi |
| 225 Alcoma Blvd Penn Hills, PA | 1.0–2.0 | 1.0–2.5 | 834 | $1,075 | $1.29 | 43d | 1 | 1.44mi |
| 1911 Nash Ave Pittsburgh, PA | 3.0 | 1.5 | 910 | $1,595 | $1.75 | 43d | 1 | 1.49mi |
Listing history 2 events
-
2026-06-19remarks 450-char remark
-
2026-06-19$165,000 Active 1 DOM
ⓘ Source: listings_history table (triggers on properties + properties_extension) + one-shot
backfill from property_details.listing_events for pre-trigger history.
Tax reassessment forecast PA · Partial reset (capped growth)
- Current annual tax
- $2,541 · $212/mo
- Projected year-2 tax
- $2,574 · $214/mo
- Expected delta
- +$33/yr (+$3/mo · 1.3%)
ⓘ Screening estimate from a state-policy table — verify with the county assessor before closing.
Climate risk First Street
- Flood 1/10 Low FEMA zone X (unshaded) · 0% chance over 30 yrs
- Wildfire 1/10 Low
- Heat 3/10 Moderate 6 d/yr ≥96°F today · 13 d/yr by 30 yrs out
- Wind 2/10 Low
- Air quality 4/10 Moderate 5 unhealthy d/yr today · 7 by 30 yrs out
Nearby sold comps map
Loading sold comps map…
Walkable amenities ~0.75 mi
Loading nearby amenities…
Taxation est. · year 1
- Rental income
- $20,974
- − Mortgage interest
- −$9,243
- − Property taxes
- −$2,541
- − Insurance
- −$825
- − Repairs & maintenance
- −$1,678
- − Management
- −$1,678
- − Depreciation
- −$4,800
- Taxable income
- $210
- Est. tax owed @ 24.0%
- −$50
- After-tax cash flow
- $2,770/yr
For passive investors: Depreciation is non-cash, so a rental often shows a tax loss while cash-flowing — sheltering income. Rental losses are passive: they offset passive income freely, and up to $25,000/yr can offset ordinary (W-2) income if you actively participate and your MAGI is under $100k (phasing out to $0 by $150k); unused losses carry forward. On sale, claimed depreciation is recaptured at up to 25%, and gains may owe capital-gains tax (a 1031 exchange can defer both). Figures are a year-1 estimate at your 24.0% rate — not tax advice; consult a CPA.
Schools (NCES district)
- District
- Penn Hills SD
- NCES district ID
- 4218590
- Math proficiency
- 13% ▼ -6.00%
- Reading proficiency
- 24% ▼ -14.00%
- Median HH income
- $47,794
- Composite
- 16.42/100
- National rank
- #9192
- State rank
- #496 of 539 in PA
Livability — Penn Hills
No livability data for this city. (Only ~50 U.S. cities are tracked.)
Census & demographics
- County
- Allegheny County · 1,022,028 people
- Metro
- Pittsburgh, PA
- Population (ZIP)
- 15,798
- Household income
- $66,757
- Rent vs Own
- Severe rent burden
- 511.0
Population outlook (Allegheny County) Hauer SSP2
- Today (2025)
- 1,250,282 people
- By 2030
- 1,256,482 · +0.5%
- By 2040
- 1,256,318 · +0.5%
- By 2050
- 1,244,169 · -0.5%
- By 2075
- 1,197,693 · -4.2%
- By 2100
- 1,093,187 · -12.6%
Race, ethnicity, and origin ACS 2023
- Neighborhood character
- Predominantly White (69%)
- Race & ethnicity
- White 69% Black 21% Two or more races 6% Hispanic / Latino 4%
- Common ancestry
- Romanian 6% Slovak 2% Serbian 1%
- Foreign-born
- 3% · Canada
- Languages at home
- 95% English-only · Spanish 3% Other Indo-European 1%
Political lean MEDSL · Allegheny
- 2024 margin
- Strong D (+20.3) · D 59.7% · R 39.4%
- 2008→2024 swing
- +4.8pp toward D · 2008: 15.5pp · 2024: 20.3pp
- All cycles
- 2024: D+20.3 2020: D+20.4 2016: D+16.4 2012: D+14.4 2008: D+15.5
Not yet ingested
- Civics
- —
Market trends
- HPI YoY
- ▼ -87.47%
- Current HPI
- 249.3773
- Rent YoY
- —
- Metro
- Pittsburgh, PA
- State GDP YoY
- ▲ 1.68%
- F500 in state
- 34
Industry mix (Fortune 500 HQ in PA)
| Industry | F500 HQs | Revenue |
|---|---|---|
| Healthcare | 2 | $309B |
|
||
| Insurance | 2 | $27B |
|
||
| Telecommunications / Media | 1 | $124B |
|
||
| Industrial Distribution | 1 | $22B |
|
||
| Financial Services | 1 | $20B |
|
||
| Chemicals / Materials | 1 | $18B |
|
||
Price history
+112.9% since first listed7 events — show timeline
- 2026-06-19 Relisted — West Penn MLS
- 2026-06-16 Listed $165,000 West Penn MLS
- 2015-04-14 Sold (Public Records) $61,000 Public Records
- 2015-04-13 Price Changed $61,000 West Penn MLS
- 2015-04-09 Price Changed $77,500 West Penn MLS
- 2015-04-09 Sold (MLS) $61,000 West Penn MLS
- 2014-09-08 Listed $77,500 West Penn MLS
Property tax history
+2.0%/yrLatest (2026): $2,541 · +0.0% YoY. Source: county tax records.
Cash-flow waterfall
monthlySold comps — $/sqft
last 12 mo · ≤1 miLoading sold comps…