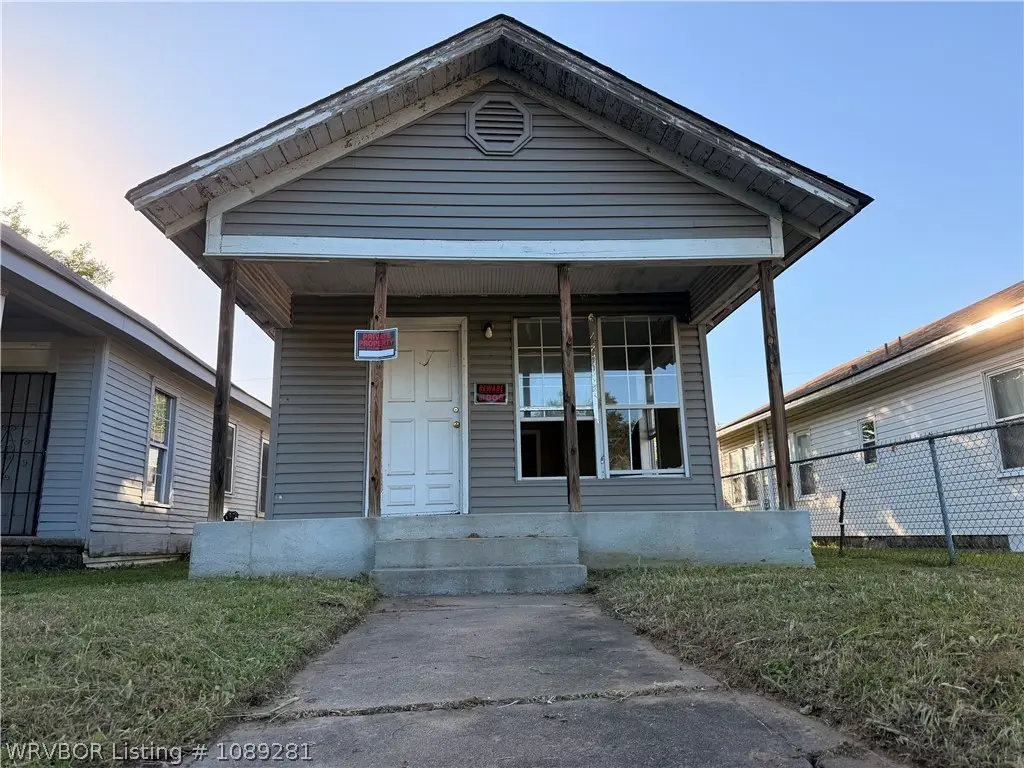
1821 N 9th St · Fort Smith, AR
Flood risk 1/10 · Minimal
- FEMA flood zone
- X (unshaded)
- Chance of flooding over 30 yrs
- 0.0%
- Est. flood insurance / yr
- $507 – $1,088
Fire risk 3/10 · Minor
- Est. fire insurance / yr
- $1,499 – $2,785
Heat risk 7/10 · Major
- Hot days now (above 111°F)
- 7 days/yr
- Hot days in 30 yrs
- 21 days/yr
Wind risk 2/10 · Minimal
- Chance of severe wind over 30 yrs
- 3.0%
Air-quality risk 2/10 · Minimal
- Unhealthy air days now
- 0 days/yr
- Unhealthy air days in 30 yrs
- 1 days/yr
Risk factors via First Street. Map © Google.
Why this score? — see what drove the B- grade
The composite is a weighted blend of 9 inputs, each scored 0–100. Each bar is that input's sub-score; the figure is the points it added to the 100-point composite (weight × sub-score).
- Cash flow +30.0/30.0
- DSCR +10.0/10.0
- 1% rule +9.7/10.0
- ARV discount +7.5/15.0
- Livability +3.2/5.0
- Schools +3.1/10.0
- Rent growth +2.5/5.0
- Condition / age +2.5/5.0
- Appreciation +0.0/10.0
$49,700
🖨 Deal sheet 📄 Offer letter ✓ Due diligence
Listing remarks
Investor Special! Motivated Seller! This 1 bedroom, 1 bathroom home offers 832 sq ft of opportunity and potential. Perfect for investors, flippers, or buyers looking for their next renovation project. Property needs TLC but has great possibilities for a rental, resale, or starter home makeover. Bring your vision and transform this fixer-upper into something special. Sold as-is.
Key facts
- 3,476 sq ft lot
- Built 1955
- Listed 26 days
Property features AI
Exterior
- Utilities: Public water; Electricity available; Sewer available; Water available
- Home design: Single-family house; One story
- Construction: Vinyl siding; Asphalt/shingle roof
- Exterior features: Covered patio/porch; Cleared lot
Interior
- Kitchen: Range
- Flooring: Wood flooring
- Bathrooms: 1 full bathroom
- Heating & cooling: Baseboard heating
- Interior features: Electric water heater; Range
- Laundry & utility: No laundry hookups inside
Neighborhood map
What this means for you Summary
Snapshot
- This is a 1-bed/1.0-bath single-family listed at $50k.
Deal economics
- At list price, monthly cash flow is $273 ($3k/yr) — positive.
- The deal already cash-flows at list — no discount required.
- Meets the 1% rule at list price ($729 rent vs $50k).
- Recommended offer: $49k (1.5% below list) — sets the bar for market timing.
- Cap rate 12.9% vs local median 4.3% in Fort Smith — top-decile yield for the area; either an underpriced asset or a hidden risk that comps aren't pricing in. Stress-test before assuming the spread holds.
Location & tenants
- Location reads 65/100 on livability (#151 in AR) — a middle-class / working-renter tenant base. Strengths: cost of living A+, housing A+, health & safety A+; Watch: crime F, amenities F, commute F.
- Fort Smith School District (urban): math 35% / reading 39% proficiency, ranked #106 of 238 in AR (top 44%) — families likely to look elsewhere, expect single-tenant / working-renter base with shorter leases; 64% free/reduced lunch — lower-income household profile, screen leases tightly.
- Zoned schools: Howard Elementary School (math 22% / reading 22%, grade F, #365 of 454 statewide, top 82%, 263 students, 92% FRL); William O. Darby Jr. High Sch. (math 20% / reading 30%, grade F, #164 of 201 statewide, top 82%, 700 students, 87% FRL); Northside High School (math 12% / reading 27%, grade F, #239 of 292 statewide, top 85%, 2,433 students, 74% FRL) — zoned schools average 84% FRL vs 64% district-wide (20 pts higher); higher-poverty schools than district average — tighter screening recommended.
- Zoned-school proficiency averages 22% at this address vs 37% district-wide (-15 pts) — the specific schools serving this property underperform the Fort Smith School District average; the district grade overstates school quality for this exact location.
- Market conditions: 96 active listings in the ZIP; 10 comparable units currently listed for rent nearby; rentals leasing fast (median 13d on market — plan ~1-2 weeks tenant-placement turnaround); lower-income renter base — watch delinquency; 388 units permitted in Sebastian County in 2024 (16 in 5+ unit buildings).
Forward outlook
- Local home prices are declining (-3.0%/yr); year-one equity from $344 of loan paydown is wiped out by about $1k of value loss. Plan a longer hold.
- Sebastian County population projected at +7% by 2050 — modest demand growth; plan on rents tracking national, not racing it.
- At projected returns (-3.0% appreciation + 3.0% rent growth), your $14k cash investment doubles in ~6 years — after that, you're playing with house money.
Negotiation context
- It's been on market 26 days — a 2% lower offer ($49k) is reasonable based on typical stale-listing flexibility.
- Current owner paid $41k; 21% above their basis — modest negotiation headroom, anchor on the comps not their cost.
Risks & watch-outs
- Watch-outs: built in 1955 — expect roof / HVAC / electrical / plumbing capex.
- Climate carrying-cost: extreme-heat days projected 7→21/yr by 2055 (HVAC capex compounding) — expect insurance premiums to compound above CPI over the hold.
Questions for the listing agent
- Built in 1955 — when were the roof, HVAC, electrical panel, plumbing, and water heater last replaced?
- Is there a deadline driving the sale (1031 exchange, divorce, estate, relocation)? That informs how much negotiation room exists.
- Schools are D-rated, which usually means shorter tenancies and higher turnover. Who's the typical renter profile here, and what's been the actual vacancy rate?
- Crime grade is F in this area — have there been break-ins, vandalism, or insurance claims at this property in the last 3 years? What carrier currently insures it and at what premium?
- What's the average days-on-market for RENTAL listings here right now (not sales)? A rising rental-DOM trend means longer vacancies and softer asking-rent achievability than the comps imply.
- What's the recent tenant-quality profile in this submarket — average credit score on applications, eviction rate, late-payment / NSF rate, and stable-employment percentage? A property-management company in the area should have these aggregated.
- How much new for-sale + rental construction is in the pipeline within 1–3 miles? Heavy new supply typically softens prices + rents 12–24 months out; constrained supply supports both.
Investment metrics
- 1% rule
- 1.47% ✓
- Cap rate
- 12.87%
- Cash-on-cash
- 23.50%
- DSCR
- 2.05
- GRM
- 5.7
CMA / ARV
No comps found within radius.
Projected returns pro-forma
-3.0% appreciation · 3.0% rent growth · sell at horizon
- IRR
- 16.6%
- Equity multiple
- 1.67×
- Total profit
- $9,291
- Equity at exit
- $7,410
- IRR
- 25.1%
- Equity multiple
- 3.18×
- Total profit
- $30,386
- Equity at exit
- $4,297
Cash invested: $13,916 (down + closing). Projections, not guarantees.
Landlord ↔ Tenant lean methodology
- Overall (STATE)
- 92 Strongly Landlord-Friendly
- State Arkansas
- 92 Strongly Landlord-Friendly · R+14
- County
- — inherits STATE
- City
- — inherits STATE
ZIP-level market 72904
- Active inventory
- 96
- Price-to-rent
- 5.7×
Monthly cashflow live
- Estimated rent
- $729 high interval (Pro) →
- Mortgage (P&I)
- −$261
- Tax from tax record
- −$22 /mo · $263/yr
- Insurance
- −$21
- HOA
- −$0
- Vacancy / Maint / Mgmt
- −$153
- Net cashflow
- $273
Break-even live
UW: 25.0% down · 7.5% · 30yr · 1.5% tax · 5.0% vac · 8.0% maint · 8.0% mgmt
Financing live
Cash to close
- Down payment
- $12,425
- Closing costs
- $1,491
- Reserves months
- —
- Total cash needed
- —
Loan-product check · same deal, 3 products live
Conventional
25% down · 7.5% · 30yr
- Down + closing
- —
- Monthly P&I
- —
- Monthly cashflow
- —
- DSCR
- —
- Eligible?
- —
Personal DTI + credit; lowest rate.
DSCR
20% down · 8.5% · 30yr
- Down + closing
- —
- Monthly P&I
- —
- Monthly cashflow
- —
- DSCR
- —
- Eligible?
- —
No personal income docs; deal must DSCR.
Hard money
10% down · 12.0% · 12mo
- Down + closing
- —
- Monthly P&I
- —
- Monthly cashflow
- —
- DSCR
- —
- Eligible?
- —
Short-term bridge; refi at stabilization.
Rent comps 10 comps
| Address | Beds | Baths | Sqft | Rent | $/sqft | DOM | Units | Dist |
|---|---|---|---|---|---|---|---|---|
| 1117 N 32nd St Fort Smith, AR | 2.0 | 1.0 | 744 | $850 | $1.14 | 13d | 1 | 0.99mi |
| 1218 D St N Unit 1218 Fort Smith, AR | 1.0 | 1.0 | 726 | $550 | $0.76 | 21d | 1 | 1.00mi |
| 322 N 6th St Fort Smith, AR | 1.0 | 1.0 | 525 | $725 | $1.38 | 3d | 2 | 1.01mi |
| 2905 Alabama Ave Fort Smith, AR | 1.0 | 1.0 | 711 | $795 | $1.12 | 3d | 1 | 1.09mi |
| 3711 Birnie Ave Unit 8 Fort Smith, AR | 2.0 | 1.0 | 600 | $700 | $1.17 | 21d | 1 | 1.13mi |
| 101 N 11th St Unit 203 Fort Smith, AR | 1.0 | 1.0 | 573 | $990 | $1.73 | 21d | 1 | 1.14mi |
| 101 N 11th St Fort Smith, AR | 1.0–2.0 | 1.0–2.0 | 806 | $940 | $1.17 | 3d | 9 | 1.14mi |
| 3510 Alabama Ave Unit 1 Fort Smith, AR | 1.0 | 1.0 | 532 | $500 | $0.94 | 13d | 1 | 1.32mi |
| 2520 N E St Fort Smith, AR | 1.0 | 1.0 | 550 | $675 | $1.23 | 2d | 1 | 1.33mi |
| 1224 N Albert Pike Ave Fort Smith, AR | 1.0–2.0 | 1.0 | 735 | $595 | $0.81 | 13d | 6 | 1.48mi |
Listing history 21 events
-
2026-06-18status $49,700 Pending 26 DOM
-
2026-06-18days on market $49,700 Active 26 DOM
-
2026-06-17days on market $49,700 Active 25 DOM
-
2026-06-16days on market $49,700 Active 24 DOM
-
2026-06-15days on market $49,700 Active 23 DOM
-
2026-06-14days on market $49,700 Active 21 DOM
-
2026-06-13days on market $49,700 Active 20 DOM
-
2026-06-10days on market $49,700 Active 18 DOM
-
2026-06-09days on market $49,700 Active 17 DOM
-
2026-06-08days on market $49,700 Active 16 DOM
-
2026-06-07days on market $49,700 Active 15 DOM
-
2026-06-03days on market $49,700 Active 11 DOM
-
2026-06-02days on market $49,700 Active 10 DOM
-
2026-06-01days on market $49,700 Active 9 DOM
-
2026-05-31days on market $49,700 Active 8 DOM
-
2026-05-30days on market $49,700 Active 7 DOM
-
2026-05-23$49,700 Active
-
2022-11-15historical
-
2016-09-29soldstatus $41,000
-
2004-07-06soldstatus $36,000
-
1988-08-01soldstatus $11,000
ⓘ Source: listings_history table (triggers on properties + properties_extension) + one-shot
backfill from property_details.listing_events for pre-trigger history.
Tax reassessment forecast AR · Resets to sale price
- Current annual tax
- $263 · $22/mo
- Projected year-2 tax
- $318 · $27/mo
- Expected delta
- +$55/yr (+$5/mo · 21.1%)
ⓘ Screening estimate from a state-policy table — verify with the county assessor before closing.
Climate risk First Street
- Flood 1/10 Low FEMA zone X (unshaded) · 0% chance over 30 yrs
- Wildfire 3/10 Moderate
- Heat 7/10 Severe 7 d/yr ≥111°F today · 21 d/yr by 30 yrs out
- Wind 2/10 Low 3% chance of damaging wind over 30 yrs
- Air quality 2/10 Low 0 unhealthy d/yr today · 1 by 30 yrs out
Nearby sold comps map
Loading sold comps map…
Walkable amenities ~0.75 mi
Loading nearby amenities…
Taxation est. · year 1
- Rental income
- $8,746
- − Mortgage interest
- −$2,784
- − Property taxes
- −$263
- − Insurance
- −$248
- − Repairs & maintenance
- −$700
- − Management
- −$700
- − Depreciation
- −$1,446
- Taxable income
- $2,606
- Est. tax owed @ 24.0%
- −$625
- After-tax cash flow
- $2,645/yr
For passive investors: Depreciation is non-cash, so a rental often shows a tax loss while cash-flowing — sheltering income. Rental losses are passive: they offset passive income freely, and up to $25,000/yr can offset ordinary (W-2) income if you actively participate and your MAGI is under $100k (phasing out to $0 by $150k); unused losses carry forward. On sale, claimed depreciation is recaptured at up to 25%, and gains may owe capital-gains tax (a 1031 exchange can defer both). Figures are a year-1 estimate at your 24.0% rate — not tax advice; consult a CPA.
Schools (NCES district)
- District
- Fort Smith School District
- NCES district ID
- 0506330
- Math proficiency
- 35% ▼ -11.00%
- Reading proficiency
- 39% ▼ -7.00%
- Median HH income
- $36,066
- Composite
- 30.66/100
- National rank
- #6183
- State rank
- #106 of 238 in AR
Livability — Fort Smith
- Score
- 65/100
- State rank
- #151
- US rank
- #13185
Category grades
Schools grade is shown separately in the Schools card above.
Census & demographics
- Census place
- Fort Smith, AR
- County
- Sebastian County · 99,312 people
- City population
- 94,356
- Metro
- Fort Smith, AR-OK
- Population (ZIP)
- 21,296
- Household income
- $41,909
- Rent vs Own
- Severe rent burden
- 851.0
Population outlook (Sebastian County) Hauer SSP2
- Today (2025)
- 133,992 people
- By 2030
- 136,620 · +2.0%
- By 2040
- 140,832 · +5.1%
- By 2050
- 143,301 · +6.9%
- By 2075
- 147,964 · +10.4%
- By 2100
- 145,848 · +8.8%
Race, ethnicity, and origin ACS 2023
- Neighborhood character
- Diverse neighborhood (Simpson 0.69)
- Race & ethnicity
- Hispanic / Latino 44% White 31% Two or more races 11% Black 9% Asian 9% Native American 1%
- Hispanic origin (detail)
- Mexican 30%
- Common ancestry
- Iranian 0%
- Foreign-born
- 26% · Canada, Vietnam
- Languages at home
- 53% English-only · Spanish 37% Other Asian/Pacific 7% Vietnamese 3%
Political lean MEDSL · Sebastian
- 2024 margin
- Solid R (+37.5) · D 30.0% · R 67.6% · Other 2.4%
- 2008→2024 swing
- -2.9pp toward R · 2008: -34.6pp · 2024: -37.5pp
- All cycles
- 2024: R+37.5 2020: R+35.5 2016: R+38.1 2012: R+37.1 2008: R+34.6
Not yet ingested
- Civics
- —
Market trends
- HPI YoY
- ▼ -81.65%
- Current HPI
- 146.2281
- Rent YoY
- —
- Metro
- Fort Smith, AR-OK
- State GDP YoY
- ▲ 3.80%
- F500 in state
- 10
Industry mix (Fortune 500 HQ in AR)
| Industry | F500 HQs | Revenue |
|---|---|---|
| Retail | 1 | $681B |
|
||
| Food / Agriculture | 1 | $53B |
|
||
| Retail / Energy | 1 | $22B |
|
||
| Transportation / Logistics | 1 | $12B |
|
||
| Energy | 1 | $4B |
|
||
Price history
+351.8% since first listed5 events — show timeline
- 2026-05-23 Listed $49,700 WRVBOR
- 2022-11-15 Rental Removed — RENT.
- 2016-09-29 Sold (Public Records) $41,000 Public Records
- 2004-07-06 Sold (Public Records) $36,000 Public Records
- 1988-08-01 Sold (Public Records) $11,000 Public Records
Property tax history
+4.0%/yrLatest (2025): $263 · +5.0% YoY. Source: county tax records.
Cash-flow waterfall
monthlySold comps — $/sqft
last 12 mo · ≤1 miLoading sold comps…