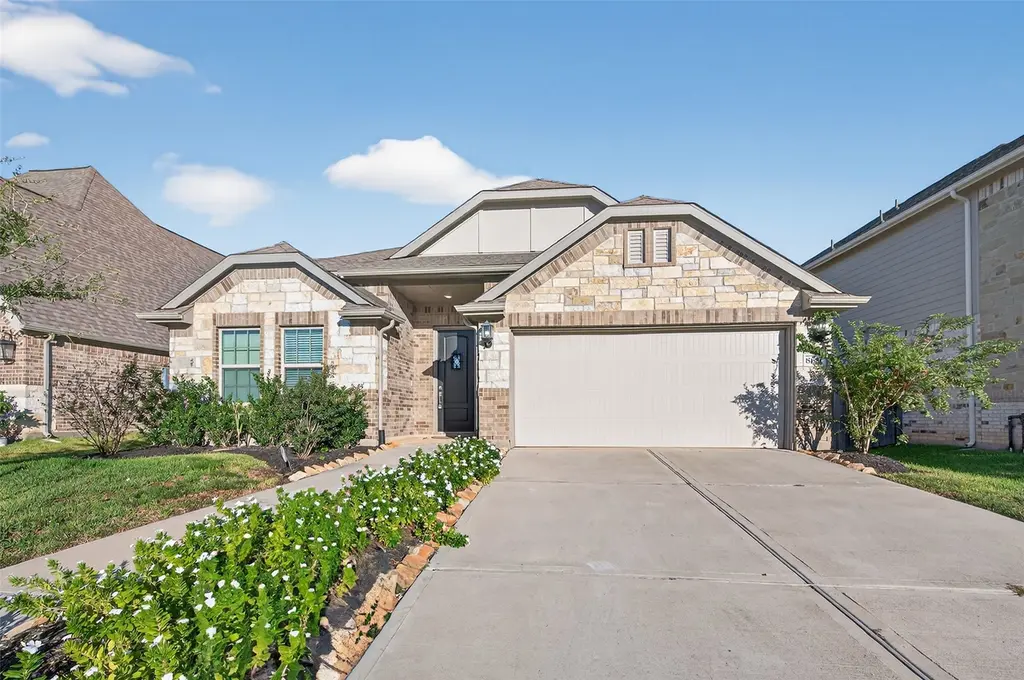
8831 Morning Glow Dr · Sienna, TX
Flood risk 4/10 · Minor
- FEMA flood zone
- X
- Chance of flooding over 30 yrs
- 0.24%
- Est. flood insurance / yr
- $507 – $1,088
Fire risk 4/10 · Minor
- Est. fire insurance / yr
- $1,222 – $2,270
Heat risk 9/10 · Severe
- Hot days now (above 111°F)
- 7 days/yr
- Hot days in 30 yrs
- 23 days/yr
Wind risk 9/10 · Severe
- Chance of severe wind over 30 yrs
- 99.0%
Air-quality risk 2/10 · Minimal
- Unhealthy air days now
- 2 days/yr
- Unhealthy air days in 30 yrs
- 2 days/yr
Risk factors via First Street. Map © Google.
Why this score? — see what drove the C+ grade
The composite is a weighted blend of 9 inputs, each scored 0–100. Each bar is that input's sub-score; the figure is the points it added to the 100-point composite (weight × sub-score).
- Cash flow +18.9/30.0
- ARV discount +11.5/15.0
- 1% rule +7.4/10.0
- DSCR +6.0/10.0
- Schools +4.5/10.0
- Appreciation +4.2/10.0
- Condition / age +4.0/5.0
- Rent growth +2.5/5.0
- Livability +2.5/5.0
$370,000
🖨 Deal sheet 📄 Offer letter ✓ Due diligence
Listing remarks
Welcome Home to Your Sienna Retreat! Step into this beautiful single-story home designed for comfort and style. Enjoy a spacious kitchen with granite countertops and stainless-steel appliances, a large primary suite with a spa-inspired bath, and an abundance of natural light throughout. The open floor plan features a dedicated office, an inviting foyer, and a versatile study. Relax in the expansive backyard or take advantage of the 2-car garage and the many amenities offered in the desirable Sienna community — including pools, walking trails, and parks. Perfectly located near top-rated Fort Bend ISD schools, shopping, dining, and grocery stores. Experience the ideal blend of luxury
Key facts
- Spacious kitchen
- Primary suite
- Natural light
Tags
Property features AI
Finance
- HOA & community: Homeowners association (SPCAI) with annual fee of $1,543; Community features include golf
Exterior
- Parking: Attached garage; 2-car garage
- Utilities: Public water; Public sewer
- Home design: Residential property; Entry level on the first floor
- Construction: Built in 2021; Brick, cement siding, and stone exterior; Composition roof; Slab foundation
- Exterior features: Near golf course; Located in a subdivision
Interior
- Kitchen: Kitchen on the first floor (19 x 11)
- Bedrooms: Primary bedroom on the first floor; Additional bedrooms on the first floor (three bedrooms)
- Bathrooms: Three full bathrooms
- Heating & cooling: Central heating (gas); Central electric air conditioning
- Interior features: Office on the first floor; Family room on the first floor; Total of 8 rooms
Neighborhood map
What this means for you Summary
Snapshot
- This is a 4-bed/3.0-bath single-family listed at $370k. Condition is rated good.
Deal economics
- At list price, monthly cash flow is $380 ($5k/yr) — positive.
- The deal already cash-flows at list — no discount required.
- Meets the 1% rule at list price ($5k rent vs $370k).
- Cap rate 7.5% vs local median 3.3% in Sienna — top-decile yield for the area; either an underpriced asset or a hidden risk that comps aren't pricing in. Stress-test before assuming the spread holds.
Location & tenants
- Location reads: area grade C — affects rentability + tenant quality, not the cash-flow math above.
- Fort Bend ISD (suburban): math 44% / reading 53% proficiency, ranked #140 of 826 in TX (top 17%) — families likely to look elsewhere, expect single-tenant / working-renter base with shorter leases.
- Zoned schools: Ronald Thornton Middle (math 40% / reading 52%, grade D+, #462 of 1,662 statewide, top 28%, 1,529 students, 41% FRL).
- Market conditions: Rents soft (-0.1%/yr); 1215 active listings in the ZIP; 4 comparable units currently listed for rent nearby; rentals at typical pace (median 22d on market — plan ~3-4 weeks tenant-placement turnaround); high-income renter base; 12,093 units permitted in Fort Bend County in 2024 (815 in 5+ unit buildings).
- This rent runs 43% of the median local income ($129k/yr) — at the standard rent-burdened threshold; future hikes will face affordability resistance.
Forward outlook
- Local home prices are declining (-1.7%/yr); year-one equity from $3k of loan paydown is wiped out by about $6k of value loss. Plan a longer hold.
- Fort Bend County population projected at +75% by 2050 — long-run rental-demand tailwind backs the buy-and-hold thesis.
Negotiation context
- Only 2 days on market — expect competitive offers; lowballing is unlikely to land.
- 6 sale attempts since 5y ago with the ask held roughly flat each time — persistent listings suggest the price (not the market) is what's stuck; bring a comps-based counter.
Risks & watch-outs
- Watch-outs: property tax is 3.4% of price.
- Climate carrying-cost: severe wind risk, 99% chance of damaging wind over 30y; extreme-heat days projected 7→23/yr by 2055 (HVAC capex compounding) — expect insurance premiums to compound above CPI over the hold.
Questions for the listing agent
- Property tax is high relative to price — has the assessment been appealed recently, and will the sale trigger a re-assessment?
- What does the HOA fee cover, when was the last increase, and are there any pending special assessments or reserve-fund shortfalls?
- Is there a deadline driving the sale (1031 exchange, divorce, estate, relocation)? That informs how much negotiation room exists.
- What's the average days-on-market for RENTAL listings here right now (not sales)? A rising rental-DOM trend means longer vacancies and softer asking-rent achievability than the comps imply.
- What's the recent tenant-quality profile in this submarket — average credit score on applications, eviction rate, late-payment / NSF rate, and stable-employment percentage? A property-management company in the area should have these aggregated.
- How much new for-sale + rental construction is in the pipeline within 1–3 miles? Heavy new supply typically softens prices + rents 12–24 months out; constrained supply supports both.
Investment metrics
- 1% rule
- 1.24% ✓
- Cap rate
- 7.53%
- Cash-on-cash
- 4.40%
- DSCR
- 1.20
- GRM
- 6.7
CMA / ARV
- ARV (on-the-fly)
- $405,960
- Comps found
- 12
Show comp detail 12 sales within ~0.75 mi
| Address | Dist | Beds/Ba | Sqft | Sold | Price | $/sf | Match |
|---|---|---|---|---|---|---|---|
| 1610 Country Air Ln | 0.07mi | 4/3.0 | 2,388 (0%) | 0mo | $369,900 | $155 | 96 |
| 8723 Arbor Trail Dr | 0.26mi | 4/3.0 | 2,381 (-0%) | 3mo | $365,000 | $153 | 85 |
| 8711 Fairbrook Dr | 0.18mi | 4/3.5 | 2,413 (+1%) | 6mo | $409,900 | $170 | 83 |
| 8726 Windsong Trail Dr | 0.28mi | 4/3.0 | 2,517 (+5%) | 5mo | $359,900 | $143 | 74 |
| 1743 Country Air Ln | 0.16mi | 3/2.5 (-1) | 2,290 (-4%) | 6mo | $385,000 | $168 | 74 |
| 1919 Waters Branch Dr | 0.28mi | 4/3.0 | 2,591 (+8%) | 7mo | $439,990 | $170 | 67 |
| 1706 Country Air Ln | 0.09mi | 4/3.5 | 2,700 (+13%) | 6mo | $375,000 | $139 | 67 |
| 2119 Long Spring Dr | 0.56mi | 4/3.0 | 2,522 (+6%) | 8mo | $410,989 | $163 | 58 |
| 1306 Shaded Rock Dr | 0.45mi | 4/2.5 | 2,046 (-14%) | 2mo | $365,915 | $179 | 52 |
| 2023 Green Haven Ct | 0.58mi | 4/3.0 | 2,623 (+10%) | 8mo | $450,000 | $172 | 50 |
| 8703 Red Heron Ln | 0.66mi | 3/3.5 (-1) | 2,615 (+10%) | 8mo | $459,000 | $176 | 40 |
| 10210 Water Harbor Dr | 0.64mi | 3/3.0 (-1) | 2,033 (-15%) | 2mo | $344,900 | $170 | 38 |
Match score weights: distance 35% · size 25% · config 20% · recency 20%. Top-matched comps best support the ARV.
Projected returns pro-forma
-1.67% appreciation · 0.0% rent growth · sell at horizon
- IRR
- -6.7%
- Equity multiple
- 0.73×
- Total profit
- $-27,668
- Equity at exit
- $77,600
- IRR
- -3.2%
- Equity multiple
- 0.77×
- Total profit
- $-23,932
- Equity at exit
- $71,876
Cash invested: $103,600 (down + closing). Projections, not guarantees.
Landlord ↔ Tenant lean methodology
- Overall (STATE)
- 87 Strongly Landlord-Friendly
- State Texas
- 87 Strongly Landlord-Friendly · R+5
- County
- — inherits STATE
- City
- — inherits STATE
ZIP-level market 77459
- Home prices YoY
- -0.8%
- Rents YoY
- -0.1%
- Active inventory
- 1215
- Price-to-rent
- 6.7×
Monthly cashflow live
- Estimated rent
- $4,606 medium interval (Pro) →
- Mortgage (P&I)
- −$1,940
- Tax from tax record
- −$1,035 /mo · $12,422/yr
- Insurance
- −$154
- HOA
- −$129
- Vacancy / Maint / Mgmt
- −$967
- Net cashflow
- $380
Break-even live
UW: 25.0% down · 7.5% · 30yr · 1.5% tax · 5.0% vac · 8.0% maint · 8.0% mgmt
Financing live
Cash to close
- Down payment
- $92,500
- Closing costs
- $11,100
- Reserves months
- —
- Total cash needed
- —
Loan-product check · same deal, 3 products live
Conventional
25% down · 7.5% · 30yr
- Down + closing
- —
- Monthly P&I
- —
- Monthly cashflow
- —
- DSCR
- —
- Eligible?
- —
Personal DTI + credit; lowest rate.
DSCR
20% down · 8.5% · 30yr
- Down + closing
- —
- Monthly P&I
- —
- Monthly cashflow
- —
- DSCR
- —
- Eligible?
- —
No personal income docs; deal must DSCR.
Hard money
10% down · 12.0% · 12mo
- Down + closing
- —
- Monthly P&I
- —
- Monthly cashflow
- —
- DSCR
- —
- Eligible?
- —
Short-term bridge; refi at stabilization.
Rent comps 4 comps
| Address | Beds | Baths | Sqft | Rent | $/sqft | DOM | Units | Dist |
|---|---|---|---|---|---|---|---|---|
| 8719 Fox Trail Dr Missouri City, TX | 4.0 | 3.5 | 2143 | $6,000 | $2.80 | 21d | 1 | 0.38mi |
| 2142 Ironwood Pass Dr Missouri City, TX | 4.0 | 3.0 | 2140 | $6,000 | $2.80 | 1d | 1 | 0.61mi |
| 1714 Forest Mist Dr Missouri City, TX | 3.0 | 3.0 | 1979 | $3,000 | $1.52 | 43d | 1 | 0.64mi |
| 2718 Van Gogh Ln Missouri City, TX | 4.0 | 2.5 | 3036 | $3,595 | $1.18 | 10d | 1 | 1.33mi |
HOA detail
- Monthly dues
- $129 · $1,548/yr
- Likely covers
- pool
Listing history 16 events
-
2026-05-22$370,000 Active
-
2026-04-30historical
-
2026-04-10price $364,900
-
2026-04-01price $369,000
-
2026-01-15$380,000 Active
-
2026-01-14historical
-
2025-10-30$395,000 Active
-
2025-10-29historical
-
2025-07-12$395,000 Active
-
2025-07-12historical
-
2025-05-10$408,000 Active
-
2025-05-05historical
-
2022-02-10soldstatus
-
2022-01-31soldstatus Sold
-
2021-10-08status Pending
-
2021-08-27$396,690 Active
ⓘ Source: listings_history table (triggers on properties + properties_extension) + one-shot
backfill from property_details.listing_events for pre-trigger history.
Tax reassessment forecast TX · Resets to sale price
- Current annual tax
- $12,422 · $1,035/mo
- Projected year-2 tax
- $12,422 · $1,035/mo
- Expected delta
- $0/yr ($0/mo · 0.0%)
ⓘ Screening estimate from a state-policy table — verify with the county assessor before closing.
Climate risk First Street
- Flood 4/10 Moderate FEMA zone X · 24% chance over 30 yrs
- Wildfire 4/10 Moderate
- Heat 9/10 Extreme 7 d/yr ≥111°F today · 23 d/yr by 30 yrs out
- Wind 9/10 Extreme 99% chance of damaging wind over 30 yrs
- Air quality 2/10 Low 2 unhealthy d/yr today · 2 by 30 yrs out
Nearby sold comps map
Loading sold comps map…
Walkable amenities ~0.75 mi
Loading nearby amenities…
Taxation est. · year 1
- Rental income
- $55,270
- − Mortgage interest
- −$20,726
- − Property taxes
- −$12,422
- − Insurance
- −$1,850
- − Repairs & maintenance
- −$4,422
- − Management
- −$4,422
- − HOA
- −$1,548
- − Depreciation
- −$10,764
- Taxable loss
- −$883
- Est. tax savings @ 24.0%
- +$212
- After-tax cash flow
- $4,771/yr
For passive investors: Depreciation is non-cash, so a rental often shows a tax loss while cash-flowing — sheltering income. Rental losses are passive: they offset passive income freely, and up to $25,000/yr can offset ordinary (W-2) income if you actively participate and your MAGI is under $100k (phasing out to $0 by $150k); unused losses carry forward. On sale, claimed depreciation is recaptured at up to 25%, and gains may owe capital-gains tax (a 1031 exchange can defer both). Figures are a year-1 estimate at your 24.0% rate — not tax advice; consult a CPA.
Condition & rehab AI · 1 photo
This single-story home in Sienna is in good condition with a good condition score of 80. It is move-in ready with minimal cosmetic improvements needed to enhance its curb appeal and interior aesthetics.
Value-add opportunities
- Both Painting exterior and interior walls — Enhances curb appeal and interior aesthetics.
- Both Landscaping improvements — Enhances curb appeal and adds value to the property.
Renovation cost estimate screening
Value-add ROI direction
- Both Painting exterior and interior walls — Enhances curb appeal and interior aesthetics. ↑
- Both Landscaping improvements — Enhances curb appeal and adds value to the property. ↑
ⓘ Cost ranges are severity-bucket heuristics (US national rule-of-thumb). Get contractor quotes + a written scope before underwriting a rehab budget.
Schools (NCES district)
- District
- Fort Bend ISD
- NCES district ID
- 4819650
- Math proficiency
- 44% ▼ -15.00%
- Reading proficiency
- 53% ▼ -4.00%
- Median HH income
- $82,360
- Composite
- 44.61/100
- National rank
- #2779
- State rank
- #140 of 826 in TX
Livability — Sienna
No livability data for this city. (Only ~50 U.S. cities are tracked.)
Census & demographics
- Census place
- Sienna, TX
- County
- Fort Bend County · 836,777 people
- Metro
- Houston-The Woodlands-Sugar Land, TX
- Population (ZIP)
- 84,221
- Household income
- $129,151
- Rent vs Own
- Severe rent burden
- 1004.0
Population outlook (Fort Bend County) Hauer SSP2
- Today (2025)
- 1,004,526 people
- By 2030
- 1,153,104 · +14.8%
- By 2040
- 1,453,718 · +44.7%
- By 2050
- 1,753,781 · +74.6%
- By 2075
- 2,455,772 · +144.5%
- By 2100
- 2,930,528 · +191.7%
Race, ethnicity, and origin ACS 2023
- Neighborhood character
- Highly diverse neighborhood (Simpson 0.75)
- Race & ethnicity
- White 34% Black 26% Asian 22% Hispanic / Latino 13% Two or more races 10%
- Hispanic origin (detail)
- Mexican 7%
- Common ancestry
- Lithuanian 2% Slovak 1% Italian 1%
- Foreign-born
- 21% · Canada, China, Vietnam
- Languages at home
- 73% English-only · Other Asian/Pacific 8% Spanish 7% Other Indo-European 5%
Political lean MEDSL · Fort Bend
- 2024 margin
- Toss-up / Even · D 49.5% · R 47.9% · Other 2.6%
- 2008→2024 swing
- +4.0pp toward D · 2008: -2.4pp · 2024: 1.6pp
- All cycles
- 2024: D+1.6 2020: D+10.6 2016: D+6.6 2012: R+6.8 2008: R+2.4
Not yet ingested
- Civics
- —
Market trends
- HPI YoY
- ▼ -1.67%
- Current HPI
- 212.3573
- Rent YoY
- ▼ -0.15%
- Metro
- Houston-The Woodlands-Sugar Land, TX
- State GDP YoY
- ▲ 3.95%
- F500 in state
- 110
Industry mix (Fortune 500 HQ in TX)
| Industry | F500 HQs | Revenue |
|---|---|---|
| Energy | 16 | $1,198B |
|
||
| Technology | 5 | $198B |
|
||
| Engineering / Construction | 4 | $72B |
|
||
| Energy Services | 3 | $60B |
|
||
| Utilities | 3 | $41B |
|
||
| Healthcare | 2 | $330B |
|
||
Price history
-6.7% since first listed16 events — show timeline
- 2026-05-22 Listed $370,000 HARMLS
- 2026-04-30 Listing Removed — HARMLS
- 2026-04-10 Price Changed $364,900 HARMLS
- 2026-04-01 Price Changed $369,000 HARMLS
- 2026-01-15 Listed $380,000 HARMLS
- 2026-01-14 Listing Removed — HARMLS
- 2025-10-30 Listed $395,000 HARMLS
- 2025-10-29 Listing Removed — HARMLS
- 2025-07-12 Listing Removed — HARMLS
- 2025-07-12 Listed $395,000 HARMLS
- 2025-05-10 Listed $408,000 HARMLS
- 2025-05-05 Coming Soon — HARMLS
- 2022-02-10 Sold (Public Records) — Public Records
- 2022-01-31 Sold (MLS) — HARMLS
- 2021-10-08 Pending — HARMLS
- 2021-08-27 Listed $396,690 HARMLS
Property tax history
+6.9%/yrLatest (2025): $12,422 · +1.6% YoY. Source: county tax records.
Cash-flow waterfall
monthlySold comps — $/sqft
last 12 mo · ≤1 miLoading sold comps…