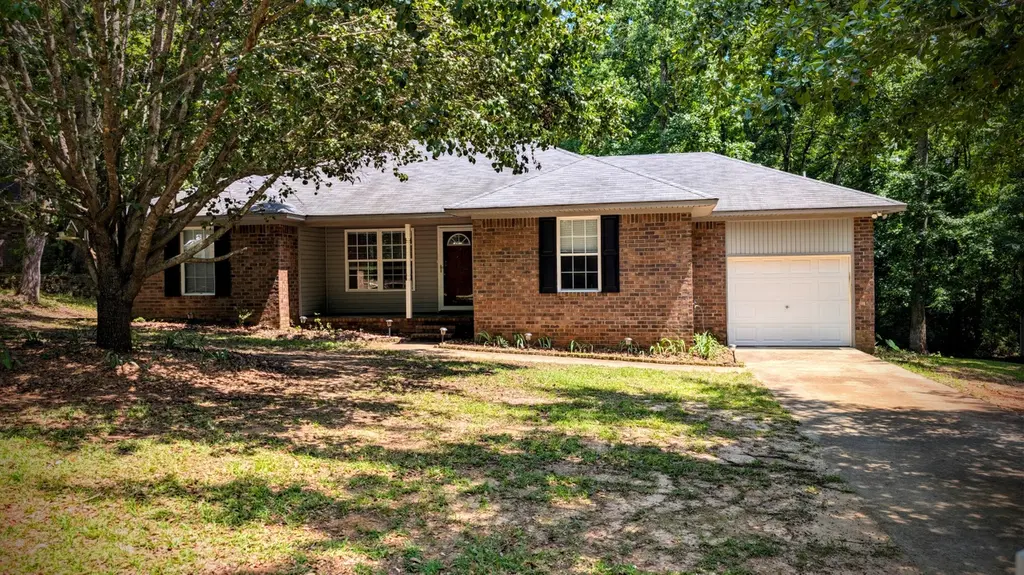
20 Spanish Moss Cir · Oakland, SC
Flood risk 1/10 · Minimal
- FEMA flood zone
- X (unshaded)
- Chance of flooding over 30 yrs
- 0.0%
- Est. flood insurance / yr
- $507 – $1,088
Fire risk 3/10 · Minor
- Est. fire insurance / yr
- $783 – $1,453
Heat risk 6/10 · Moderate
- Hot days now (above 106°F)
- 7 days/yr
- Hot days in 30 yrs
- 15 days/yr
Wind risk 8/10 · Major
- Chance of severe wind over 30 yrs
- 80.0%
Air-quality risk 2/10 · Minimal
- Unhealthy air days now
- 2 days/yr
- Unhealthy air days in 30 yrs
- 2 days/yr
Risk factors via First Street. Map © Google.
Why this score? — see what drove the F grade
The composite is a weighted blend of 9 inputs, each scored 0–100. Each bar is that input's sub-score; the figure is the points it added to the 100-point composite (weight × sub-score).
- Cash flow +14.4/30.0
- DSCR +4.4/10.0
- Livability +3.3/5.0
- 1% rule +2.8/10.0
- Rent growth +2.5/5.0
- Condition / age +2.5/5.0
- ARV discount +2.1/15.0
- Schools +1.9/10.0
- Appreciation +0.0/10.0
$214,900
🖨 Deal sheet 📄 Offer letter ✓ Due diligence
Listing remarks MLS
GRANITE, all laminated hardwood floors, new paint and all brick, three bedrooms and two bath home. Vaulted ceiling in great room. Kitchen has new granite, breakfast bar, new stainless appliances to include refrigerator and two pantry closets. Three bedroom with split floor plan. Deck, storage building, warranty, garage and all located on . 52 of an acre lot on a culdesac.
Key facts
- Wooded backyard
- One story layout
- Granite countertops
Tags
Property features AI
Exterior
- Parking: 1-car garage
- Utilities: Public water; Septic tank
- Home design: Single-family house; One level
- Construction: Vinyl siding; Asphalt roof; Slab foundation; Built as single family residence
- Exterior features: Front porch; Deck; Shed(s); Paved road; Publicly maintained road
Interior
- Kitchen: Dishwasher; Microwave; Range; Refrigerator
- Flooring: Laminate
- Bathrooms: 2 full bathrooms
- Heating & cooling: Heat pump; Ceiling fan(s)
- Interior features: Cathedral ceilings; Walk-in closet(s); Open floor plan; Blinds
- Laundry & utility: Washer hookup; Electric dryer hookup
Neighborhood map
What this means for you Summary
Snapshot
- This is a 3-bed/2.0-bath single-family listed at $215k.
Deal economics
- At list price, monthly cash flow is $44 ($529/yr) — positive.
- The deal already cash-flows at list — no discount required.
- To meet the 1% rule (rent ≥ 1% of price), the offer needs to be $168k (21.7% below list).
- Recommended offer: $168k (21.7% below list) — sets the bar for 1% rule.
Location & tenants
- Location reads 66/100 on livability (#115 in SC) — a middle-class / working-renter tenant base. Strengths: cost of living A+, housing A+, crime A; Watch: employment C-, amenities F, commute F.
- Sumter 01 (urban): math 18% / reading 28% proficiency, ranked #64 of 80 in SC (top 80%) — low school quality limits family demand, transient renter base, plan for 1-2y turnover; 64% free/reduced lunch — lower-income household profile, screen leases tightly.
- Zoned schools: Hillcrest Middle (math 26% / reading 33%, grade F, #139 of 229 statewide, top 61%, 364 students, 100% FRL); Crestwood High (math 32% / reading 71%, grade D+, #146 of 196 statewide, top 75%, 1,100 students, 100% FRL) — zoned schools average 100% FRL vs 64% district-wide (36 pts higher); higher-poverty schools than district average — tighter screening recommended.
- Zoned-school proficiency averages 40% at this address vs 23% district-wide (+18 pts) — the actual schools serving this property are materially stronger than the Sumter 01 average implies; a family-tenant draw the district grade alone would hide.
- Market conditions: 51 active listings in the ZIP; 386 units permitted in Sumter County in 2024 (0 in 5+ unit buildings).
- This rent runs 31% of the median local income ($66k/yr) — at the standard rent-burdened threshold; future hikes will face affordability resistance.
Forward outlook
- Local home prices are declining (-3.0%/yr); year-one equity from $1k of loan paydown is wiped out by about $6k of value loss. Plan a longer hold.
- Sumter County population projected at -14% by 2050 — secular population decline; favor cash flow + early exit over multi-decade hold.
Negotiation context
- Only 12 days on market — expect competitive offers; lowballing is unlikely to land.
- 2 sale attempts since 8y ago with the ask held roughly flat each time — persistent listings suggest the price (not the market) is what's stuck; bring a comps-based counter.
- Current owner paid $129k; list at $215k implies a 67% gain — meaningful room to come down on a strong offer.
Risks & watch-outs
- Climate carrying-cost: severe wind risk, 80% chance of damaging wind over 30y; extreme-heat days projected 7→15/yr by 2055 (HVAC capex compounding) — expect insurance premiums to compound above CPI over the hold.
Questions for the listing agent
- Is there a deadline driving the sale (1031 exchange, divorce, estate, relocation)? That informs how much negotiation room exists.
- Schools are F-rated, which usually means shorter tenancies and higher turnover. Who's the typical renter profile here, and what's been the actual vacancy rate?
- The area grade is low — what's the realistic commute time and amenity access for the typical tenant pool here? Any planned neighborhood developments (good or bad) we should know about?
- What's the average days-on-market for RENTAL listings here right now (not sales)? A rising rental-DOM trend means longer vacancies and softer asking-rent achievability than the comps imply.
- What's the recent tenant-quality profile in this submarket — average credit score on applications, eviction rate, late-payment / NSF rate, and stable-employment percentage? A property-management company in the area should have these aggregated.
- How much new for-sale + rental construction is in the pipeline within 1–3 miles? Heavy new supply typically softens prices + rents 12–24 months out; constrained supply supports both.
Investment metrics
- 1% rule
- 0.78% ✗
- Cap rate
- 6.54%
- Cash-on-cash
- 0.88%
- DSCR
- 1.04
- GRM
- 10.6
CMA / ARV
- ARV (on-the-fly)
- $191,770
- Comps found
- 12
Show comp detail 12 sales within ~0.75 mi
| Address | Dist | Beds/Ba | Sqft | Sold | Price | $/sf | Match |
|---|---|---|---|---|---|---|---|
| 2487 Drexel Dr | 0.40mi | 3/2.0 | 1,288 (+1%) | 12mo | $194,000 | $151 | 69 |
| 30 Rainmaker Ct | 0.08mi | 3/2.0 | 1,449 (+14%) | 9mo | $222,000 | $153 | 66 |
| 2790 Watermark Dr | 0.42mi | 3/2.0 | 1,246 (-2%) | 14mo | $189,000 | $152 | 65 |
| 5884 Fish Rd | 0.48mi | 3/2.0 | 1,333 (+5%) | 12mo | $230,000 | $173 | 59 |
| 2460 Woodhaven Rd | 0.54mi | 3/1.5 | 1,151 (-9%) | 1mo | $160,000 | $139 | 56 |
| 2390 Valleybrook Rd | 0.68mi | 3/2.0 | 1,274 (+0%) | 15mo | $170,000 | $133 | 55 |
| 2460 Hummingbird Rd | 0.42mi | 3/2.0 | 1,204 (-5%) | 22mo | $190,000 | $158 | 54 |
| 2881 Candlewood Ln | 0.41mi | 3/1.5 | 1,160 (-9%) | 14mo | $170,000 | $147 | 53 |
| 5671 Longview Rd | 0.51mi | 3/2.0 | 1,175 (-8%) | 14mo | $162,500 | $138 | 52 |
| 2410 Hummingbird Rd | 0.53mi | 3/2.0 | 1,168 (-8%) | 16mo | $170,000 | $146 | 48 |
| 2401 Hunt Club Rd | 0.66mi | 3/2.0 | 1,330 (+5%) | 19mo | $185,000 | $139 | 45 |
| 2361 Drexel Ct | 0.65mi | 3/1.5 | 1,169 (-8%) | 22mo | $194,500 | $166 | 36 |
Match score weights: distance 35% · size 25% · config 20% · recency 20%. Top-matched comps best support the ARV.
Projected returns pro-forma
-3.0% appreciation · 3.0% rent growth · sell at horizon
- IRR
- -15.0%
- Equity multiple
- 0.47×
- Total profit
- $-32,115
- Equity at exit
- $32,042
- IRR
- -6.4%
- Equity multiple
- 0.59×
- Total profit
- $-24,747
- Equity at exit
- $18,581
Cash invested: $60,172 (down + closing). Projections, not guarantees.
Landlord ↔ Tenant lean methodology
- Overall (STATE)
- 90 Strongly Landlord-Friendly
- State South Carolina
- 90 Strongly Landlord-Friendly · R+6
- County
- — inherits STATE
- City
- — inherits STATE
ZIP-level market 29040
- Home prices YoY
- -14.3%
- Active inventory
- 51
- Price-to-rent
- 10.6×
Monthly cashflow live
- Estimated rent
- $1,683 medium interval (Pro) →
- Mortgage (P&I)
- −$1,127
- Tax from tax record
- −$69 /mo · $828/yr
- Insurance
- −$90
- HOA
- −$0
- Vacancy / Maint / Mgmt
- −$353
- Net cashflow
- $44
Break-even live
UW: 25.0% down · 7.5% · 30yr · 1.5% tax · 5.0% vac · 8.0% maint · 8.0% mgmt
Financing live
Cash to close
- Down payment
- $53,725
- Closing costs
- $6,447
- Reserves months
- —
- Total cash needed
- —
Loan-product check · same deal, 3 products live
Conventional
25% down · 7.5% · 30yr
- Down + closing
- —
- Monthly P&I
- —
- Monthly cashflow
- —
- DSCR
- —
- Eligible?
- —
Personal DTI + credit; lowest rate.
DSCR
20% down · 8.5% · 30yr
- Down + closing
- —
- Monthly P&I
- —
- Monthly cashflow
- —
- DSCR
- —
- Eligible?
- —
No personal income docs; deal must DSCR.
Hard money
10% down · 12.0% · 12mo
- Down + closing
- —
- Monthly P&I
- —
- Monthly cashflow
- —
- DSCR
- —
- Eligible?
- —
Short-term bridge; refi at stabilization.
Listing history 11 events
-
2026-06-19days on market $214,900 Active 12 DOM
-
2026-06-18days on market $214,900 Active 11 DOM
-
2026-06-17days on market $214,900 Active 10 DOM
-
2026-06-16days on market $214,900 Active 9 DOM
-
2026-06-15days on market $214,900 Active 8 DOM
-
2026-06-14days on market $214,900 Active 6 DOM
-
2026-06-13days on market $214,900 Active 5 DOM
-
2026-06-10days on market $214,900 Active 3 DOM
-
2026-06-09days on market $214,900 Active 2 DOM
-
2026-06-08remarks 699-char remark
-
2026-06-08$214,900 Active 1 DOM
ⓘ Source: listings_history table (triggers on properties + properties_extension) + one-shot
backfill from property_details.listing_events for pre-trigger history.
Tax reassessment forecast SC · Resets to sale price
- Current annual tax
- $828 · $69/mo
- Projected year-2 tax
- $1,225 · $102/mo
- Expected delta
- +$397/yr (+$33/mo · 48.0%)
ⓘ Screening estimate from a state-policy table — verify with the county assessor before closing.
Climate risk First Street
- Flood 1/10 Low FEMA zone X (unshaded) · 0% chance over 30 yrs
- Wildfire 3/10 Moderate
- Heat 6/10 Major 7 d/yr ≥106°F today · 15 d/yr by 30 yrs out
- Wind 8/10 Severe 80% chance of damaging wind over 30 yrs
- Air quality 2/10 Low 2 unhealthy d/yr today · 2 by 30 yrs out
Nearby sold comps map
Loading sold comps map…
Walkable amenities ~0.75 mi
Loading nearby amenities…
Taxation est. · year 1
- Rental income
- $20,196
- − Mortgage interest
- −$12,038
- − Property taxes
- −$828
- − Insurance
- −$1,074
- − Repairs & maintenance
- −$1,616
- − Management
- −$1,616
- − Depreciation
- −$6,252
- Taxable loss
- −$3,227
- Est. tax savings @ 24.0%
- +$775
- After-tax cash flow
- $1,303/yr
For passive investors: Depreciation is non-cash, so a rental often shows a tax loss while cash-flowing — sheltering income. Rental losses are passive: they offset passive income freely, and up to $25,000/yr can offset ordinary (W-2) income if you actively participate and your MAGI is under $100k (phasing out to $0 by $150k); unused losses carry forward. On sale, claimed depreciation is recaptured at up to 25%, and gains may owe capital-gains tax (a 1031 exchange can defer both). Figures are a year-1 estimate at your 24.0% rate — not tax advice; consult a CPA.
Schools (NCES district)
- District
- Sumter 01
- NCES district ID
- 4503902
- Math proficiency
- 18% ▼ -13.00%
- Reading proficiency
- 28% ▼ -6.00%
- Median HH income
- $40,423
- Composite
- 19.45/100
- National rank
- #8775
- State rank
- #64 of 80 in SC
Livability — Oakland
- Score
- 66/100
- State rank
- #115
- US rank
- #11683
Category grades
Schools grade is shown separately in the Schools card above.
Census & demographics
- County
- Sumter County · 76,912 people
- Metro
- Sumter, SC
- Population (ZIP)
- 8,920
- Household income
- $65,978
- Rent vs Own
- Severe rent burden
- 206.0
Population outlook (Sumter County) Hauer SSP2
- Today (2025)
- 104,585 people
- By 2030
- 102,282 · -2.2%
- By 2040
- 96,258 · -8.0%
- By 2050
- 89,592 · -14.3%
- By 2075
- 74,715 · -28.6%
- By 2100
- 60,235 · -42.4%
Race, ethnicity, and origin ACS 2023
- Neighborhood character
- Diverse neighborhood (Simpson 0.56)
- Race & ethnicity
- White 55% Black 38% Two or more races 4% Hispanic / Latino 3%
- Common ancestry
- Slovak 2% Romanian 2% Lithuanian 1%
- Foreign-born
- 3% · Canada
- Languages at home
- 96% English-only · Spanish 2% German/W. Germanic 1%
Political lean MEDSL · Sumter
- 2024 margin
- Toss-up / Even · D 51.9% · R 47.0% · Other 1.2%
- 2008→2024 swing
- -10.6pp toward R · 2008: 15.4pp · 2024: 4.9pp
- All cycles
- 2024: D+4.9 2020: D+13.0 2016: D+12.0 2012: D+17.5 2008: D+15.4
Not yet ingested
- Civics
- —
Market trends
- HPI YoY
- ▼ -28.54%
- Current HPI
- 171.5211
- Rent YoY
- —
- Metro
- Sumter, SC
- State GDP YoY
- ▲ 4.51%
- F500 in state
- 2
Industry mix (Fortune 500 HQ in SC)
| Industry | F500 HQs | Revenue |
|---|---|---|
| Packaging | 1 | $7B |
|
||
Price history
+795.4% since first listed6 events — show timeline
- 2026-06-07 Listed $214,900 SBOR
- 2018-04-24 Sold (Public Records) $128,900 Public Records
- 2018-04-20 Sold (MLS) $128,900 SBOR
- 2018-03-06 Listed $128,900 SBOR
- 2011-06-29 Sold (Public Records) $119,900 Public Records
- 2007-01-05 Sold (Public Records) $24,000 Public Records
Property tax history
+1.3%/yrLatest (2025): $828 · +0.2% YoY. Source: county tax records.
Cash-flow waterfall
monthlySold comps — $/sqft
last 12 mo · ≤1 miLoading sold comps…