58 Keaau 9 1/2 Mile Cp · Keaau, HI
Flood risk 6/10 · Moderate
- FEMA flood zone
- X (unshaded)
- Chance of flooding over 30 yrs
- 0.73%
- Est. flood insurance / yr
- $507 – $1,088
Fire risk No data
- Est. fire insurance / yr
- —
Heat risk No data
- Hot days now (above threshold)
- —
- Hot days in 30 yrs
- —
Wind risk No data
- Chance of severe wind over 30 yrs
- —
Air-quality risk 1/10 · Minimal
- Unhealthy air days now
- —
- Unhealthy air days in 30 yrs
- —
Risk factors via First Street. Map © Google.
Why this score? — see what drove the A- grade
The composite is a weighted blend of 9 inputs, each scored 0–100. Each bar is that input's sub-score; the figure is the points it added to the 100-point composite (weight × sub-score).
- Cash flow +30.0/30.0
- ARV discount +15.0/15.0
- DSCR +10.0/10.0
- 1% rule +9.0/10.0
- Appreciation +5.5/10.0
- Schools +3.7/10.0
- Livability +3.6/5.0
- Rent growth +2.5/5.0
- Condition / age +1.0/5.0
$150,000
🖨 Deal sheet 📄 Offer letter ✓ Due diligence
Listing remarks MLS
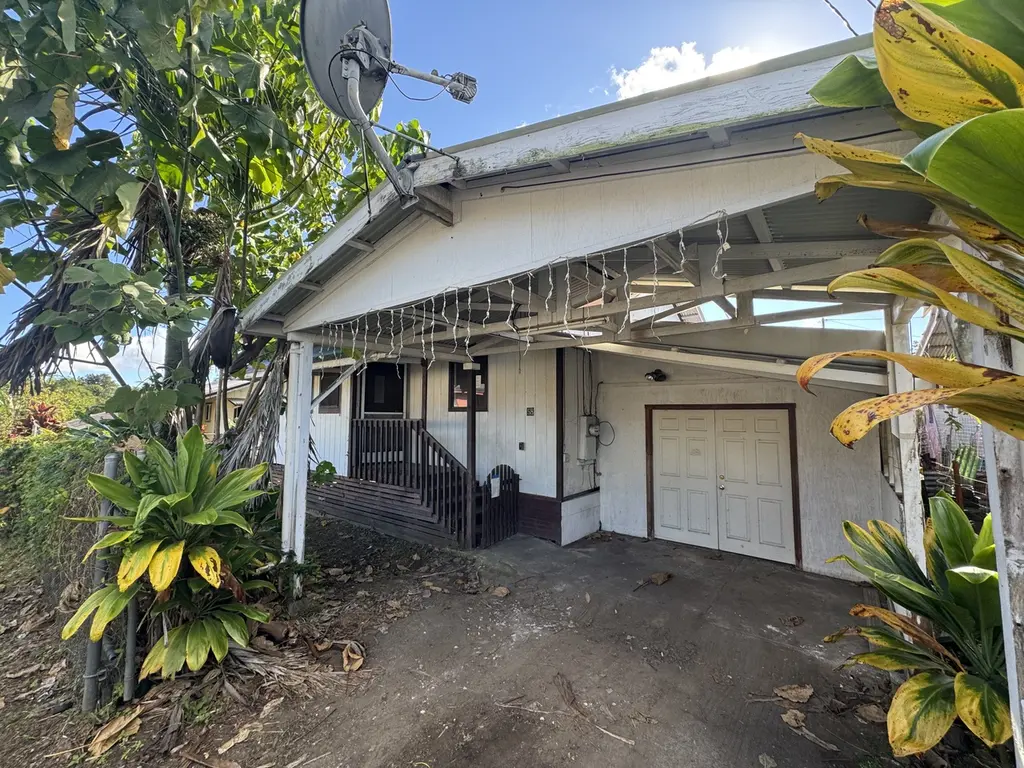
1920 built home available in 9 1/2 Mile Camp. Property is located within a half mile of shopping, dining, gas, schools, park and other amenities. On county water and regular electric.
Key facts
- County water
- Half mile shopping
- Half mile gas
Tags
Neighborhood map
What this means for you Summary
Snapshot
- This is a 2-bed/1.0-bath single-family listed at $150k. Condition is rated poor.
Deal economics
- At list price, monthly cash flow is $621 ($7k/yr) — positive.
- The deal already cash-flows at list — no discount required.
- Meets the 1% rule at list price ($2k rent vs $150k).
- Recommended offer: $136k (9.0% below list) — sets the bar for market timing.
Location & tenants
- Location reads 71/100 on livability (#24 in HI) — a middle-class / working-renter tenant base. Strengths: crime A+, employment A+, health & safety A+; Watch: schools D, amenities F, commute F.
- Hawaii Department Of Education (suburban): math 32% / reading 50% proficiency, ranked #1 of 1 in HI (top 100%) — families likely to look elsewhere, expect single-tenant / working-renter base with shorter leases.
- Market conditions: 189 active listings in the ZIP; solid renter incomes; 982 units permitted in Hawaii County in 2024 (0 in 5+ unit buildings).
Forward outlook
- In year one you build about $2k of equity ($1k loan paydown + $1k appreciation (0.9% local appreciation)).
- Hawaii County population projected at +24% by 2050 — long-run rental-demand tailwind backs the buy-and-hold thesis.
- At projected returns (0.9% appreciation + 3.0% rent growth), your $42k cash investment doubles in ~4 years — after that, you're playing with house money.
Negotiation context
- It's been on market 109 days — a 9% lower offer ($136k) is reasonable based on typical stale-listing flexibility.
Risks & watch-outs
- Watch-outs: built in 1920 — expect roof / HVAC / electrical / plumbing capex.
- Climate carrying-cost: major flood risk — expect insurance premiums to compound above CPI over the hold.
Questions for the listing agent
- It's been on market 109 days. Have you received any prior offers? Is the seller open to a 9% concession, seller financing, or rate buy-down credit?
- Have any recent inspections been done? Can we get a copy of the seller's disclosures and any deferred-maintenance estimates?
- Built in 1920 — when were the roof, HVAC, electrical panel, plumbing, and water heater last replaced?
- Why hasn't it sold? Are there any deal-killer items the seller is aware of (foundation, flood, title, zoning, code violations)?
- Is there a deadline driving the sale (1031 exchange, divorce, estate, relocation)? That informs how much negotiation room exists.
- Schools are D-rated, which usually means shorter tenancies and higher turnover. Who's the typical renter profile here, and what's been the actual vacancy rate?
- What's the average days-on-market for RENTAL listings here right now (not sales)? A rising rental-DOM trend means longer vacancies and softer asking-rent achievability than the comps imply.
- What's the recent tenant-quality profile in this submarket — average credit score on applications, eviction rate, late-payment / NSF rate, and stable-employment percentage? A property-management company in the area should have these aggregated.
- How much new for-sale + rental construction is in the pipeline within 1–3 miles? Heavy new supply typically softens prices + rents 12–24 months out; constrained supply supports both.
Investment metrics
- 1% rule
- 1.40% ✓
- Cap rate
- 11.26%
- Cash-on-cash
- 17.75%
- DSCR
- 1.79
- GRM
- 6.0
CMA / ARV
- ARV (median comp)
- $287,910
- List price
- $150,000
- Delta
- -47.90%
- Verdict
- UNDERPRICED
- Comps
- 2 within 2.0 mi
Projected returns pro-forma
0.93% appreciation · 3.0% rent growth · sell at horizon
- IRR
- 19.6%
- Equity multiple
- 2.00×
- Total profit
- $41,906
- Equity at exit
- $50,678
- IRR
- 22.8%
- Equity multiple
- 3.74×
- Total profit
- $115,125
- Equity at exit
- $66,938
Cash invested: $42,000 (down + closing). Projections, not guarantees.
Landlord ↔ Tenant lean methodology
- Overall (STATE)
- 37 Tenant-Leaning
- State Hawaii
- 37 Tenant-Leaning · D+13
- County
- — inherits STATE
- City
- — inherits STATE
ZIP-level market 96749
- Home prices YoY
- 0.5%
- Active inventory
- 189
- Price-to-rent
- 6.0×
Monthly cashflow live
- Estimated rent
- $2,099 medium interval (Pro) →
- Mortgage (P&I)
- −$787
- Tax est. 1.5%
- −$188 /mo · $2,250/yr
- Insurance
- −$62
- HOA
- −$0
- Vacancy / Maint / Mgmt
- −$441
- Net cashflow
- $621
Break-even live
UW: 25.0% down · 7.5% · 30yr · 1.5% tax · 5.0% vac · 8.0% maint · 8.0% mgmt
Financing live
Cash to close
- Down payment
- $37,500
- Closing costs
- $4,500
- Reserves months
- —
- Total cash needed
- —
Loan-product check · same deal, 3 products live
Conventional
25% down · 7.5% · 30yr
- Down + closing
- —
- Monthly P&I
- —
- Monthly cashflow
- —
- DSCR
- —
- Eligible?
- —
Personal DTI + credit; lowest rate.
DSCR
20% down · 8.5% · 30yr
- Down + closing
- —
- Monthly P&I
- —
- Monthly cashflow
- —
- DSCR
- —
- Eligible?
- —
No personal income docs; deal must DSCR.
Hard money
10% down · 12.0% · 12mo
- Down + closing
- —
- Monthly P&I
- —
- Monthly cashflow
- —
- DSCR
- —
- Eligible?
- —
Short-term bridge; refi at stabilization.
Listing history 17 events
-
2026-06-18days on market $150,000 Active 109 DOM
-
2026-06-17days on market $150,000 Active 108 DOM
-
2026-06-16days on market $150,000 Active 107 DOM
-
2026-06-15days on market $150,000 Active 106 DOM
-
2026-06-13days on market $150,000 Active 104 DOM
-
2026-06-13days on market $150,000 Active 103 DOM
-
2026-06-10days on market $150,000 Active 101 DOM
-
2026-06-09days on market $150,000 Active 100 DOM
-
2026-06-08days on market $150,000 Active 99 DOM
-
2026-06-07days on market $150,000 Active 98 DOM
-
2026-06-05days on market $150,000 Active 95 DOM
-
2026-06-03days on market $150,000 Active 94 DOM
-
2026-06-02days on market $150,000 Active 93 DOM
-
2026-06-01days on market $150,000 Active 92 DOM
-
2026-05-31days on market $150,000 Active 91 DOM
-
2026-04-02price $150,000 183-char remark
Show marketing remark (183 chars)
1920 built home available in 9 1/2 Mile Camp. Property is located within a half mile of shopping, dining, gas, schools, park and other amenities. On county water and regular electric.
-
2026-02-27$160,000 Active 183-char remark
Show marketing remark (183 chars)
1920 built home available in 9 1/2 Mile Camp. Property is located within a half mile of shopping, dining, gas, schools, park and other amenities. On county water and regular electric.
ⓘ Source: listings_history table (triggers on properties + properties_extension) + one-shot
backfill from property_details.listing_events for pre-trigger history.
Climate risk First Street
- Flood 6/10 Major FEMA zone X (unshaded) · 73% chance over 30 yrs
- Air quality 1/10 Low
Nearby sold comps map
Loading sold comps map…
Walkable amenities ~0.75 mi
Loading nearby amenities…
Taxation est. · year 1
- Rental income
- $25,183
- − Mortgage interest
- −$8,402
- − Property taxes
- −$2,250
- − Insurance
- −$750
- − Repairs & maintenance
- −$2,015
- − Management
- −$2,015
- − Depreciation
- −$4,364
- Taxable income
- $5,387
- Est. tax owed @ 24.0%
- −$1,293
- After-tax cash flow
- $6,162/yr
For passive investors: Depreciation is non-cash, so a rental often shows a tax loss while cash-flowing — sheltering income. Rental losses are passive: they offset passive income freely, and up to $25,000/yr can offset ordinary (W-2) income if you actively participate and your MAGI is under $100k (phasing out to $0 by $150k); unused losses carry forward. On sale, claimed depreciation is recaptured at up to 25%, and gains may owe capital-gains tax (a 1031 exchange can defer both). Figures are a year-1 estimate at your 24.0% rate — not tax advice; consult a CPA.
Condition & rehab AI · 12 photos
This 1920-built home requires extensive repairs and updates to become move-in ready. Immediate attention is needed to address structural issues and improve the living environment.
Repairs flagged
- Major Exposed ceiling — Structural damage
- Major Missing cabinets — No storage
- Major Dirty floor — Unhygienic
Value-add opportunities
- Both Paint interior walls — Enhances curb appeal and interior aesthetics
- Both Replace missing cabinets — Provides storage and improves functionality
- Both Clean and re-lay flooring — Improves hygiene and appearance
Renovation cost estimate screening
| Repair item | Severity | Est. cost |
|---|---|---|
| Exposed ceiling · Structural damage | Major | $15,000–50,000 |
| Missing cabinets · No storage | Major | $15,000–50,000 |
| Dirty floor · Unhygienic | Major | $15,000–50,000 |
| Total estimated repair cost · 3 items | $45,000–150,000 |
Value-add ROI direction
- Both Paint interior walls — Enhances curb appeal and interior aesthetics ↑
- Both Replace missing cabinets — Provides storage and improves functionality ↑
- Both Clean and re-lay flooring — Improves hygiene and appearance ↑
ⓘ Cost ranges are severity-bucket heuristics (US national rule-of-thumb). Get contractor quotes + a written scope before underwriting a rehab budget.
Schools (NCES district)
- District
- Hawaii Department Of Education
- NCES district ID
- 1500030
- Math proficiency
- 32% ▼ -10.00%
- Reading proficiency
- 50% ▼ -3.00%
- Median HH income
- $69,005
- Composite
- 37.07/100
- National rank
- #4504
- State rank
- #1 of 1 in HI
Livability — Keaau
- Score
- 71/100
- State rank
- #24
- US rank
- #7285
Category grades
Schools grade is shown separately in the Schools card above.
Census & demographics
- Census place
- Keaau, HI
- County
- Hawaii County · 119,311 people
- City population
- 19,132
- Metro
- Hilo, HI
- Population (ZIP)
- 19,132
- Household income
- $85,399
- Rent vs Own
- Severe rent burden
- 290.0
Population outlook (Hawaii County) Hauer SSP2
- Today (2025)
- 220,733 people
- By 2030
- 232,156 · +5.2%
- By 2040
- 252,486 · +14.4%
- By 2050
- 272,703 · +23.5%
- By 2075
- 332,113 · +50.5%
- By 2100
- 398,342 · +80.5%
Race, ethnicity, and origin ACS 2023
- Neighborhood character
- Highly diverse neighborhood (Simpson 0.87)
- Race & ethnicity
- Two or more races 33% White 24% Asian 22% Pacific Islander 14% Hispanic / Latino 13% Black 1%
- Hispanic origin (detail)
- Mexican 7% Puerto Rican 3%
- Common ancestry
- Russian 9% Lithuanian 3% Italian 2%
- Foreign-born
- 14% · Vietnam, Canada
- Languages at home
- 73% English-only · Other Asian/Pacific 15% Vietnamese 2% Spanish 2%
Political lean MEDSL · Hawaii
- 2024 margin
- Strong D (+28.3) · D 63.0% · R 34.7% · Other 2.3%
- 2008→2024 swing
- -25.4pp toward R · 2008: 53.7pp · 2024: 28.3pp
- All cycles
- 2024: D+28.3 2020: D+36.2 2016: D+36.6 2012: D+51.3 2008: D+53.7
Not yet ingested
- Civics
- —
Market trends
- HPI YoY
- ▲ 0.93%
- Current HPI
- 183.9836
- Rent YoY
- —
- Metro
- Hilo, HI
- State GDP YoY
- —
- F500 in state
- 0
Price history
-6.2% since first listed2 events — show timeline
- 2026-04-02 Price Changed $150,000 HI Information Service
- 2026-02-27 Listed $160,000 HI Information Service
Cash-flow waterfall
monthlySold comps — $/sqft
last 12 mo · ≤1 miLoading sold comps…