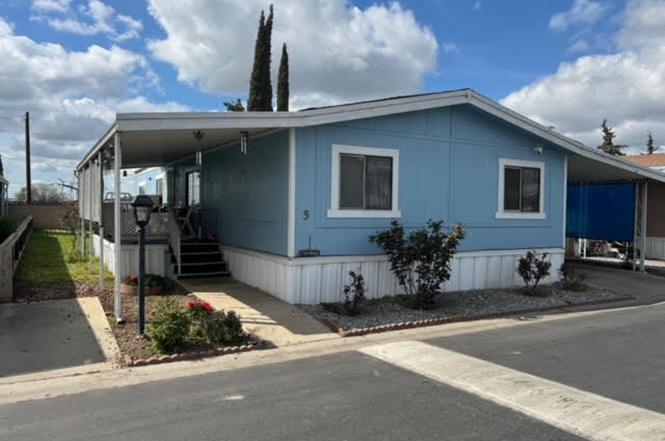
900 E Rankin Rd #5 · Tulare, CA
Flood risk 8/10 · Major
- FEMA flood zone
- A
- Chance of flooding over 30 yrs
- 0.99%
- Est. flood insurance / yr
- $1,009 – $1,996
Fire risk 4/10 · Minor
- Est. fire insurance / yr
- $659 – $1,223
Heat risk 8/10 · Major
- Hot days now (above 106°F)
- 7 days/yr
- Hot days in 30 yrs
- 18 days/yr
Wind risk 1/10 · Minimal
- Chance of severe wind over 30 yrs
- —
Air-quality risk 10/10 · Severe
- Unhealthy air days now
- 33 days/yr
- Unhealthy air days in 30 yrs
- 38 days/yr
Risk factors via First Street. Map © Google.
Why this score? — see what drove the B- grade
The composite is a weighted blend of 9 inputs, each scored 0–100. Each bar is that input's sub-score; the figure is the points it added to the 100-point composite (weight × sub-score).
- Cash flow +30.0/30.0
- 1% rule +10.0/10.0
- DSCR +10.0/10.0
- ARV discount +5.9/15.0
- Rent growth +3.2/5.0
- Schools +3.0/10.0
- Livability +2.9/5.0
- Condition / age +2.5/5.0
- Appreciation +0.0/10.0
$87,000
🖨 Deal sheet 📄 Offer letter ✓ Due diligence
Listing remarks
You are looking at a 3 Bedroom, 2 Bathroom Double Wide Manufactured Home on the Outskirts of Tulare. Home is approximately 1,400 Square Feet. Brand New HVAC A/C Unit which is still under Warranty. Brand New Water Heater, also still under Warranty. Located on an Oversize Lot Space with plenty of Yard Space. Property boast's easy access to HWY 99. Among the amenities in the community are a swimming pool, basketball court, shuffleboard court, and clubhouse with Internet cafe and pool table.
Key facts
- Oversize lot space
- Swimming pool
- Basketball court
Tags
Property features AI
Exterior
- Utilities: Public water; Public sewer; Electricity connected; Water connected; Sewer connected; Natural gas connected; Natural gas available
- Home design: Manufactured in park; Manufactured home (double wide); Single-story (manufactured home layout)
- Construction: 24 ft by 60 ft double wide mobile home; Aluminum skirting
- Exterior features: Composition roof; Private pool (on the property); Community pool access
Interior
- Bedrooms: Double wide manufactured home (dimensions provided separately)
- Bathrooms: 2 full bathrooms
- Heating & cooling: Central heating; Central air conditioning
- Interior features: Central heating; Central air conditioning
Neighborhood map
What this means for you Summary
Snapshot
- This is a 3-bed/2.0-bath manufactured listed at $87k.
Deal economics
- At list price, monthly cash flow is $946 ($11k/yr) — positive.
- The deal already cash-flows at list — no discount required.
- Meets the 1% rule at list price ($2k rent vs $87k).
- Recommended offer: $77k (12.0% below list) — sets the bar for market timing.
- Cap rate 21.1% vs local median 3.3% in Tulare — top-decile yield for the area; either an underpriced asset or a hidden risk that comps aren't pricing in. Stress-test before assuming the spread holds.
Location & tenants
- Location reads 58/100 on livability (#701 in CA) — a working-class tenant base; expect higher turnover. Strengths: housing A+; Watch: commute C-, employment D+, schools D-.
- Tulare Joint Union High (suburban): math 18% / reading 52% proficiency, ranked #280 of 517 in CA (top 54%) — families likely to look elsewhere, expect single-tenant / working-renter base with shorter leases.
- Market conditions: Rents rising (+2.7%/yr); 352 active listings in the ZIP; 1,447 units permitted in Tulare County in 2024 (307 in 5+ unit buildings).
- This rent runs 35% of the median local income ($73k/yr) — at the standard rent-burdened threshold; future hikes will face affordability resistance.
Forward outlook
- Local home prices are declining (-3.0%/yr); year-one equity from $601 of loan paydown is wiped out by about $3k of value loss. Plan a longer hold.
- Tulare County population projected at +10% by 2050 — modest demand growth; plan on rents tracking national, not racing it.
- At projected returns (-3.0% appreciation + 2.7% rent growth), your $24k cash investment doubles in ~3 years — after that, you're playing with house money.
Negotiation context
- It's been on market 269 days — a 12% lower offer ($77k) is reasonable based on typical stale-listing flexibility.
- 3 sale attempts since 2y ago with the ask held roughly flat each time — persistent listings suggest the price (not the market) is what's stuck; bring a comps-based counter.
Risks & watch-outs
- Watch-outs: flood insurance adds $125/mo.
- Climate carrying-cost: in FEMA flood zone A (mandatory federal flood insurance); extreme-heat days projected 7→18/yr by 2055 (HVAC capex compounding) — expect insurance premiums to compound above CPI over the hold.
Questions for the listing agent
- It's been on market 269 days. Have you received any prior offers? Is the seller open to a 12% concession, seller financing, or rate buy-down credit?
- What's the actual annual flood-insurance premium (NFIP or private), and is the property in a SFHA with mandatory coverage?
- Why hasn't it sold? Are there any deal-killer items the seller is aware of (foundation, flood, title, zoning, code violations)?
- Is there a deadline driving the sale (1031 exchange, divorce, estate, relocation)? That informs how much negotiation room exists.
- Schools are D-rated, which usually means shorter tenancies and higher turnover. Who's the typical renter profile here, and what's been the actual vacancy rate?
- Crime grade is F in this area — have there been break-ins, vandalism, or insurance claims at this property in the last 3 years? What carrier currently insures it and at what premium?
- What's the average days-on-market for RENTAL listings here right now (not sales)? A rising rental-DOM trend means longer vacancies and softer asking-rent achievability than the comps imply.
- What's the recent tenant-quality profile in this submarket — average credit score on applications, eviction rate, late-payment / NSF rate, and stable-employment percentage? A property-management company in the area should have these aggregated.
- How much new for-sale + rental construction is in the pipeline within 1–3 miles? Heavy new supply typically softens prices + rents 12–24 months out; constrained supply supports both.
Investment metrics
- 1% rule
- 2.43% ✓
- Cap rate
- 21.07%
- Cash-on-cash
- 52.78%
- DSCR
- 3.35
- GRM
- 3.4
CMA / ARV
- ARV (on-the-fly)
- $84,000
- Comps found
- 6
Show comp detail 6 sales within ~0.75 mi
| Address | Dist | Beds/Ba | Sqft | Sold | Price | $/sf | Match |
|---|---|---|---|---|---|---|---|
| 900 E Rankin Rd Rd SE #72 | 0.11mi | 3/2.0 | 1,440 (+3%) | 2mo | $129,000 | $90 | 88 |
| 900 E Rankin Rd #69 | 0.11mi | 4/2.0 (+1) | 1,400 (0%) | 6mo | $45,000 | $32 | 85 |
| 900 E Rankin Ave #3 | 0.11mi | 3/2.0 | 1,440 (+3%) | 6mo | $79,000 | $55 | 85 |
| 900 E Rankin Rd #134 | 0.11mi | 3/2.0 | 1,500 (+7%) | 11mo | $90,000 | $60 | 74 |
| 900 E Rankin Ave #70 | 0.11mi | 3/2.0 | 1,560 (+11%) | 21mo | $82,000 | $53 | 58 |
| 900 E Rankin Rd #98 | 0.12mi | 3/2.0 | 1,248 (-11%) | 23mo | $110,000 | $88 | 57 |
Match score weights: distance 35% · size 25% · config 20% · recency 20%. Top-matched comps best support the ARV.
Projected returns pro-forma
-3.0% appreciation · 2.67% rent growth · sell at horizon
- IRR
- 43.6%
- Equity multiple
- 2.87×
- Total profit
- $45,572
- Equity at exit
- $12,972
- IRR
- 49.4%
- Equity multiple
- 5.72×
- Total profit
- $114,866
- Equity at exit
- $7,522
Cash invested: $24,360 (down + closing). Projections, not guarantees.
Landlord ↔ Tenant lean methodology
- Overall (STATE)
- 18 Strongly Tenant-Friendly
- State California
- 18 Strongly Tenant-Friendly · D+13
- County
- — inherits STATE
- City
- — inherits STATE
ZIP-level market 93274
- Rents YoY
- 2.7%
- Active inventory
- 352
- Price-to-rent
- 3.4×
Monthly cashflow live
- Estimated rent
- $2,117 medium interval (Pro) →
- Mortgage (P&I)
- −$456
- Tax est. 1.5%
- −$109 /mo · $1,305/yr
- Insurance
- −$36
- Flood insurance flood zone
- −$125 /mo · $1,502/yr
- HOA
- −$0
- Vacancy / Maint / Mgmt
- −$445
- Net cashflow
- $946
Break-even live
UW: 25.0% down · 7.5% · 30yr · 1.5% tax · 5.0% vac · 8.0% maint · 8.0% mgmt
Financing live
Cash to close
- Down payment
- $21,750
- Closing costs
- $2,610
- Reserves months
- —
- Total cash needed
- —
Loan-product check · same deal, 3 products live
Conventional
25% down · 7.5% · 30yr
- Down + closing
- —
- Monthly P&I
- —
- Monthly cashflow
- —
- DSCR
- —
- Eligible?
- —
Personal DTI + credit; lowest rate.
DSCR
20% down · 8.5% · 30yr
- Down + closing
- —
- Monthly P&I
- —
- Monthly cashflow
- —
- DSCR
- —
- Eligible?
- —
No personal income docs; deal must DSCR.
Hard money
10% down · 12.0% · 12mo
- Down + closing
- —
- Monthly P&I
- —
- Monthly cashflow
- —
- DSCR
- —
- Eligible?
- —
Short-term bridge; refi at stabilization.
Listing history 24 events
-
2026-06-18days on market $87,000 Active 269 DOM
-
2026-06-17days on market $87,000 Active 268 DOM
-
2026-06-16days on market $87,000 Active 267 DOM
-
2026-06-15days on market $87,000 Active 266 DOM
-
2026-06-14days on market $87,000 Active 264 DOM
-
2026-06-13days on market $87,000 Active 263 DOM
-
2026-06-10days on market $87,000 Active 261 DOM
-
2026-06-09days on market $87,000 Active 260 DOM
-
2026-06-08days on market $87,000 Active 259 DOM
-
2026-06-07days on market $87,000 Active 258 DOM
-
2026-06-05days on market $87,000 Active 255 DOM
-
2026-06-03days on market $87,000 Active 254 DOM
-
2026-06-02days on market $87,000 Active 253 DOM
-
2026-06-01days on market $87,000 Active 252 DOM
-
2026-05-31days on market $87,000 Active 251 DOM
-
2026-05-30days on market $87,000 Active 250 DOM
-
2025-09-22$87,000 Active
-
2025-03-01price $89,000
-
2024-10-12price $92,000
-
2024-10-02price $94,900
-
2024-09-13status Active
-
2024-04-17price $96,000
-
2024-04-05price $97,900
-
2024-03-12$99,900 Active
ⓘ Source: listings_history table (triggers on properties + properties_extension) + one-shot
backfill from property_details.listing_events for pre-trigger history.
Climate risk First Street
- Flood 8/10 Severe FEMA zone A · 99% chance over 30 yrs
- Wildfire 4/10 Moderate
- Heat 8/10 Severe 7 d/yr ≥106°F today · 18 d/yr by 30 yrs out
- Wind 1/10 Low
- Air quality 10/10 Extreme 33 unhealthy d/yr today · 38 by 30 yrs out
Nearby sold comps map
Loading sold comps map…
Walkable amenities ~0.75 mi
Loading nearby amenities…
Taxation est. · year 1
- Rental income
- $25,407
- − Mortgage interest
- −$4,873
- − Property taxes
- −$1,305
- − Insurance
- −$1,937
- − Repairs & maintenance
- −$2,033
- − Management
- −$2,033
- − Depreciation
- −$2,531
- Taxable income
- $10,695
- Est. tax owed @ 24.0%
- −$2,567
- After-tax cash flow
- $8,787/yr
For passive investors: Depreciation is non-cash, so a rental often shows a tax loss while cash-flowing — sheltering income. Rental losses are passive: they offset passive income freely, and up to $25,000/yr can offset ordinary (W-2) income if you actively participate and your MAGI is under $100k (phasing out to $0 by $150k); unused losses carry forward. On sale, claimed depreciation is recaptured at up to 25%, and gains may owe capital-gains tax (a 1031 exchange can defer both). Figures are a year-1 estimate at your 24.0% rate — not tax advice; consult a CPA.
Schools (NCES district)
- District
- Tulare Joint Union High
- NCES district ID
- 0639930
- Math proficiency
- 18% ▼ -6.00%
- Reading proficiency
- 52% ▼ -1.00%
- Median HH income
- $46,858
- Composite
- 29.91/100
- National rank
- #6384
- State rank
- #280 of 517 in CA
Livability — Tulare
- Score
- 58/100
- State rank
- #701
- US rank
- #21185
Category grades
Schools grade is shown separately in the Schools card above.
Census & demographics
- Census place
- Tulare, CA
- County
- Tulare County · 323,826 people
- City population
- 80,026
- Metro
- Visalia, CA
- Population (ZIP)
- 80,026
- Household income
- $72,650
- Rent vs Own
- Severe rent burden
- 2393.0
Population outlook (Tulare County) Hauer SSP2
- Today (2025)
- 484,681 people
- By 2030
- 496,241 · +2.4%
- By 2040
- 518,507 · +7.0%
- By 2050
- 534,920 · +10.4%
- By 2075
- 548,417 · +13.2%
- By 2100
- 513,085 · +5.9%
Race, ethnicity, and origin ACS 2023
- Neighborhood character
- Majority Hispanic (64%)
- Race & ethnicity
- Hispanic / Latino 64% White 29% Two or more races 24% Asian 2% Black 2%
- Hispanic origin (detail)
- Mexican 60%
- Common ancestry
- Russian 7% Iranian 1% Italian 1%
- Foreign-born
- 19% · Canada, Vietnam
- Languages at home
- 52% English-only · Spanish 42% Other Indo-European 3% Other Asian/Pacific 1%
Political lean MEDSL · Tulare
- 2024 margin
- Strong R (+20.7) · D 38.5% · R 59.2% · Other 2.3%
- 2008→2024 swing
- -5.4pp toward R · 2008: -15.3pp · 2024: -20.7pp
- All cycles
- 2024: R+20.7 2020: R+7.8 2016: R+12.1 2012: R+17.8 2008: R+15.3
Not yet ingested
- Civics
- —
Market trends
- HPI YoY
- ▼ -402.03%
- Current HPI
- 316.0806
- Rent YoY
- ▲ 2.67%
- Metro
- Visalia, CA
- State GDP YoY
- ▲ 3.21%
- F500 in state
- 116
Industry mix (Fortune 500 HQ in CA)
| Industry | F500 HQs | Revenue |
|---|---|---|
| Technology | 27 | $1,492B |
|
||
| Financial Services | 3 | $174B |
|
||
| Retail | 3 | $44B |
|
||
| Insurance | 3 | $26B |
|
||
| Media / Entertainment | 2 | $115B |
|
||
| Pharmaceuticals / Biotech | 2 | $62B |
|
||
Price history
-12.9% since first listed8 events — show timeline
- 2025-09-22 Listed $87,000 TCMLS
- 2025-03-01 Price Changed $89,000 TCMLS
- 2024-10-12 Price Changed $92,000 TCMLS
- 2024-10-02 Price Changed $94,900 TCMLS
- 2024-09-13 Relisted — TCMLS
- 2024-04-17 Price Changed $96,000 TCMLS
- 2024-04-05 Price Changed $97,900 TCMLS
- 2024-03-12 Listed $99,900 TCMLS
Cash-flow waterfall
monthlySold comps — $/sqft
last 12 mo · ≤1 miLoading sold comps…