325 W State Route 89a -- #40 · Cottonwood, AZ
Flood risk 1/10 · Minimal
- FEMA flood zone
- X (unshaded)
- Chance of flooding over 30 yrs
- 0.0%
- Est. flood insurance / yr
- $507 – $1,088
Fire risk 5/10 · Moderate
- Est. fire insurance / yr
- $610 – $1,132
Heat risk 6/10 · Moderate
- Hot days now (above 102°F)
- 7 days/yr
- Hot days in 30 yrs
- 18 days/yr
Wind risk 1/10 · Minimal
- Chance of severe wind over 30 yrs
- —
Air-quality risk 1/10 · Minimal
- Unhealthy air days now
- 0 days/yr
- Unhealthy air days in 30 yrs
- 0 days/yr
Risk factors via First Street. Map © Google.
Why this score? — see what drove the B- grade
The composite is a weighted blend of 9 inputs, each scored 0–100. Each bar is that input's sub-score; the figure is the points it added to the 100-point composite (weight × sub-score).
- Cash flow +30.0/30.0
- 1% rule +10.0/10.0
- DSCR +10.0/10.0
- ARV discount +7.5/15.0
- Livability +4.0/5.0
- Rent growth +2.4/5.0
- Condition / age +2.2/5.0
- Schools +1.9/10.0
- Appreciation +0.0/10.0
$80,000
🖨 Deal sheet 📄 Offer letter ✓ Due diligence
Listing remarks MLS
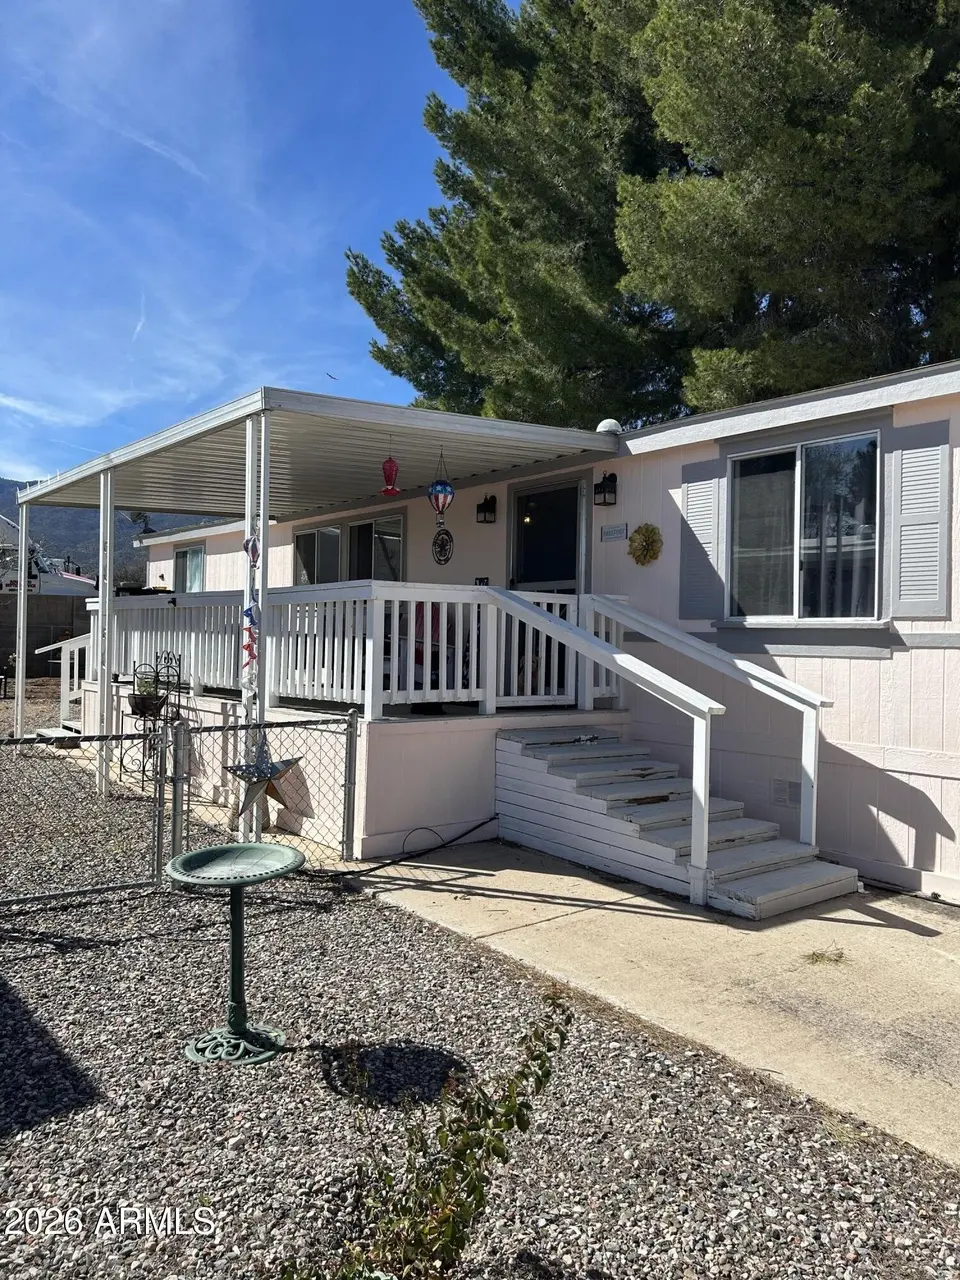
Beautiful 3-bedroom, 2-bath home featuring a large open floor plan and new ceiling fans. Located in the 55+ community of El Rio De Oro Mobile Home Park, this home offers convenient access to the medical center and a variety of nearby amenities. Buyer must be approved by park management. Lot rent applies; buyer to verify current amount and park details.
Key facts
- New ceiling fans
- 2 parking spots
- Community pool
Tags
Property features AI
Finance
- HOA & community: Land lease (monthly); Monthly land lease payment: $780; Community pool; Association covers sewer, water, trash, street maintenance and other items
Exterior
- Parking: 2 covered parking spaces; 2 carport spaces
- Utilities: Propane; City water; Public sewer
- Home design: Manufactured/mobile home; Leasehold ownership; Mountain views
- Construction: Aluminum siding; Steel frame; Wood frame; Composition roof
- Exterior features: Private yard; Storage; Shed(s); Chain-link fencing; Gravel/stone front and back; Asphalt road access (private and city maintained sections)
Interior
- Kitchen: Refrigerator
- Bedrooms: Up to 3 possible bedrooms
- Flooring: Carpet; Laminate
- Bathrooms: 1 full bathroom; 1 half bathroom
- Heating & cooling: Has heating; Central air; Ceiling fans
- Interior features: High-speed internet; Granite counters; Eat-in kitchen; No interior steps; Full bathroom in primary bedroom; Workshop area (12 x 12)
- Laundry & utility: Indoor laundry with washer/dryer hookup only
Neighborhood map
What this means for you Summary
Snapshot
- This is a 3-bed/1.5-bath single-family listed at $80k. Condition is rated fair.
Deal economics
- At list price, monthly cash flow is $1k ($15k/yr) — positive.
- The deal already cash-flows at list — no discount required.
- Meets the 1% rule at list price ($2k rent vs $80k).
- Recommended offer: $75k (6.0% below list) — sets the bar for market timing.
- Cap rate 25.2% vs local median 3.8% in Cottonwood — top-decile yield for the area; either an underpriced asset or a hidden risk that comps aren't pricing in. Stress-test before assuming the spread holds.
Location & tenants
- Location reads 79/100 on livability (#7 in AZ, #2,176 nationally) — a middle-class / working-renter tenant base. Strengths: health & safety A+, commute A, cost of living A; Watch: employment D, amenities F.
- Cottonwood-Oak Creek Elementary District (4487) (town): math 17% / reading 28% proficiency, ranked #174 of 249 in AZ (top 70%) — low school quality limits family demand, transient renter base, plan for 1-2y turnover.
- Zoned schools: Dr Daniel Bright Elementary School (math 11% / reading 26%, grade F, #790 of 1,109 statewide, top 72%, 625 students, 72% FRL) — zoned schools average 72% FRL vs 52% district-wide (20 pts higher); higher-poverty schools than district average — tighter screening recommended.
- Market conditions: Rents soft (-0.2%/yr); 266 active listings in the ZIP; 6 comparable units currently listed for rent nearby; rentals leasing fast (median 14d on market — plan ~1-2 weeks tenant-placement turnaround); 2,062 units permitted in Yavapai County in 2024 (98 in 5+ unit buildings).
- At $2,292/mo this rent would consume 48% of the median local household income ($57k/yr) (locally 894% of renters already pay >50% of income on rent) — very limited rent-growth headroom before tenants either downsize or default.
Forward outlook
- Local home prices are declining (-3.0%/yr); year-one equity from $553 of loan paydown is wiped out by about $2k of value loss. Plan a longer hold.
- Yavapai County population projected at +10% by 2050 — modest demand growth; plan on rents tracking national, not racing it.
- At projected returns (-3.0% appreciation + 0.0% rent growth), your $22k cash investment doubles in ~2 years — after that, you're playing with house money.
Negotiation context
- It's been on market 85 days — a 6% lower offer ($75k) is reasonable based on typical stale-listing flexibility.
- 2 sale attempts; this cycle's ask has dropped $12k (13%) from the opening price — seller is motivated, your offer sets the floor, not the list.
Risks & watch-outs
- Climate carrying-cost: moderate wildfire risk; extreme-heat days projected 7→18/yr by 2055 (HVAC capex compounding) — expect insurance premiums to compound above CPI over the hold.
Questions for the listing agent
- It's been on market 85 days. Have you received any prior offers? Is the seller open to a 6% concession, seller financing, or rate buy-down credit?
- Have any recent inspections been done? Can we get a copy of the seller's disclosures and any deferred-maintenance estimates?
- Why hasn't it sold? Are there any deal-killer items the seller is aware of (foundation, flood, title, zoning, code violations)?
- Is there a deadline driving the sale (1031 exchange, divorce, estate, relocation)? That informs how much negotiation room exists.
- What's the average days-on-market for RENTAL listings here right now (not sales)? A rising rental-DOM trend means longer vacancies and softer asking-rent achievability than the comps imply.
- What's the recent tenant-quality profile in this submarket — average credit score on applications, eviction rate, late-payment / NSF rate, and stable-employment percentage? A property-management company in the area should have these aggregated.
- How much new for-sale + rental construction is in the pipeline within 1–3 miles? Heavy new supply typically softens prices + rents 12–24 months out; constrained supply supports both.
Investment metrics
- 1% rule
- 2.86% ✓
- Cap rate
- 25.16%
- Cash-on-cash
- 67.38%
- DSCR
- 4.00
- GRM
- 2.9
CMA / ARV
- ARV (on-the-fly)
- $473,555
- Comps found
- 10
Show comp detail 10 sales within ~0.75 mi
| Address | Dist | Beds/Ba | Sqft | Sold | Price | $/sf | Match |
|---|---|---|---|---|---|---|---|
| 1285 W Wagon Wheel Rd | 0.52mi | 3/2.0 | 1,702 (-5%) | 15mo | $425,000 | $250 | 53 |
| 1660 W Bronco Ln | 0.72mi | 3/2.0 | 1,695 (-5%) | 6mo | $395,000 | $233 | 51 |
| 807 S Tigres Trl | 0.61mi | 3/2.0 | 1,527 (-14%) | 4mo | $445,000 | $291 | 42 |
| 1650 W Wagon Wheel Rd | 0.69mi | 4/2.0 (+1) | 1,858 (+4%) | 17mo | $485,000 | $261 | 40 |
| 1824 Mountainside Dr | 0.74mi | 4/2.0 (+1) | 1,760 (-2%) | 22mo | $467,000 | $265 | 38 |
| 912 S 3rd St | 0.72mi | 3/2.0 | 1,620 (-9%) | 14mo | $410,000 | $253 | 38 |
| 1755 W Desert Willow Dr | 0.73mi | 3/2.0 | 1,887 (+6%) | 22mo | $430,000 | $228 | 36 |
| 1645 W Cedar Post Ln | 0.73mi | 3/2.0 | 1,695 (-5%) | 24mo | $515,000 | $304 | 36 |
| 812 S Tigres Trl | 0.60mi | 3/2.0 | 1,538 (-14%) | 19mo | $440,000 | $286 | 31 |
| 935 S Tigres Trl | 0.70mi | 3/2.0 | 1,590 (-11%) | 19mo | $436,500 | $275 | 31 |
Match score weights: distance 35% · size 25% · config 20% · recency 20%. Top-matched comps best support the ARV.
Projected returns pro-forma
-3.0% appreciation · 0.0% rent growth · sell at horizon
- IRR
- 63.3%
- Equity multiple
- 3.70×
- Total profit
- $60,456
- Equity at exit
- $11,928
- IRR
- 66.8%
- Equity multiple
- 6.80×
- Total profit
- $129,972
- Equity at exit
- $6,917
Cash invested: $22,400 (down + closing). Projections, not guarantees.
Landlord ↔ Tenant lean methodology
- Overall (STATE)
- 87 Strongly Landlord-Friendly
- State Arizona
- 87 Strongly Landlord-Friendly · R+3
- County
- — inherits STATE
- City
- — inherits STATE
ZIP-level market 86326
- Home prices YoY
- -32.2%
- Rents YoY
- -0.2%
- Active inventory
- 266
- Price-to-rent
- 2.9×
Monthly cashflow live
- Estimated rent
- $2,292 high interval (Pro) →
- Mortgage (P&I)
- −$420
- Tax est. 1.5%
- −$100 /mo · $1,200/yr
- Insurance
- −$33
- HOA
- −$0
- Vacancy / Maint / Mgmt
- −$481
- Net cashflow
- $1,258
Break-even live
UW: 25.0% down · 7.5% · 30yr · 1.5% tax · 5.0% vac · 8.0% maint · 8.0% mgmt
Financing live
Cash to close
- Down payment
- $20,000
- Closing costs
- $2,400
- Reserves months
- —
- Total cash needed
- —
Loan-product check · same deal, 3 products live
Conventional
25% down · 7.5% · 30yr
- Down + closing
- —
- Monthly P&I
- —
- Monthly cashflow
- —
- DSCR
- —
- Eligible?
- —
Personal DTI + credit; lowest rate.
DSCR
20% down · 8.5% · 30yr
- Down + closing
- —
- Monthly P&I
- —
- Monthly cashflow
- —
- DSCR
- —
- Eligible?
- —
No personal income docs; deal must DSCR.
Hard money
10% down · 12.0% · 12mo
- Down + closing
- —
- Monthly P&I
- —
- Monthly cashflow
- —
- DSCR
- —
- Eligible?
- —
Short-term bridge; refi at stabilization.
Rent comps 6 comps
| Address | Beds | Baths | Sqft | Rent | $/sqft | DOM | Units | Dist |
|---|---|---|---|---|---|---|---|---|
| 255 S Cottonwood Ranch Rd Cottonwood, AZ | 3.0 | 2.0 | 1695 | $2,195 | $1.29 | 13d | 1 | 0.75mi |
| 1910 W Trail Blazer Dr Cottonwood, AZ | 2.0 | 2.0 | 1278 | $2,900 | $2.27 | 13d | 1 | 0.90mi |
| 564 Crossbar Ln Cottonwood, AZ | 3.0 | 2.0 | 1290 | $2,250 | $1.74 | 13d | 1 | 0.92mi |
| 1296 S Monte Tesoro Dr Cottonwood, AZ | 3.0 | 2.0 | 1627 | $2,210 | $1.36 | 21d | 1 | 1.02mi |
| 992 Sterling Ln Cottonwood, AZ | 3.0 | 2.0 | 1652 | $2,395 | $1.45 | 21d | 1 | 1.20mi |
| 754 Skyview Ln Cottonwood, AZ | 2.0 | 2.0 | 1272 | $1,985 | $1.56 | 13d | 1 | 1.36mi |
Listing history 22 events
-
2026-06-18days on market $80,000 Active 85 DOM
-
2026-06-17days on market $80,000 Active 84 DOM
-
2026-06-16days on market $80,000 Active 83 DOM
-
2026-06-15days on market $80,000 Active 82 DOM
-
2026-06-14days on market $80,000 Active 80 DOM
-
2026-06-13days on market $80,000 Active 79 DOM
-
2026-06-10days on market $80,000 Active 77 DOM
-
2026-06-09days on market $80,000 Active 76 DOM
-
2026-06-08days on market $80,000 Active 75 DOM
-
2026-06-07days on market $80,000 Active 74 DOM
-
2026-06-05days on market $80,000 Active 71 DOM
-
2026-06-03days on market $80,000 Active 70 DOM
-
2026-06-02days on market $80,000 Active 69 DOM
-
2026-06-01days on market $80,000 Active 68 DOM
-
2026-05-31days on market $80,000 Active 67 DOM
-
2026-05-30days on market $80,000 Active 66 DOM
-
2026-05-09price $80,000 354-char remark
Show marketing remark (354 chars)
Beautiful 3-bedroom, 2-bath home featuring a large open floor plan and new ceiling fans. Located in the 55+ community of El Rio De Oro Mobile Home Park, this home offers convenient access to the medical center and a variety of nearby amenities. Buyer must be approved by park management. Lot rent applies; buyer to verify current amount and park details.
-
2026-05-09price $80,000
Show marketing remark (354 chars)
Beautiful 3-bedroom, 2-bath home featuring a large open floor plan and new ceiling fans. Located in the 55+ community of El Rio De Oro Mobile Home Park, this home offers convenient access to the medical center and a variety of nearby amenities. Buyer must be approved by park management. Lot rent applies; buyer to verify current amount and park details.
-
2026-03-26price $85,000 354-char remark
Show marketing remark (354 chars)
Beautiful 3-bedroom, 2-bath home featuring a large open floor plan and new ceiling fans. Located in the 55+ community of El Rio De Oro Mobile Home Park, this home offers convenient access to the medical center and a variety of nearby amenities. Buyer must be approved by park management. Lot rent applies; buyer to verify current amount and park details.
-
2026-03-26price $85,000
Show marketing remark (354 chars)
Beautiful 3-bedroom, 2-bath home featuring a large open floor plan and new ceiling fans. Located in the 55+ community of El Rio De Oro Mobile Home Park, this home offers convenient access to the medical center and a variety of nearby amenities. Buyer must be approved by park management. Lot rent applies; buyer to verify current amount and park details.
-
2026-03-07$92,000 Active 354-char remark
Show marketing remark (354 chars)
Beautiful 3-bedroom, 2-bath home featuring a large open floor plan and new ceiling fans. Located in the 55+ community of El Rio De Oro Mobile Home Park, this home offers convenient access to the medical center and a variety of nearby amenities. Buyer must be approved by park management. Lot rent applies; buyer to verify current amount and park details.
-
2026-03-07$92,000 Active
Show marketing remark (354 chars)
Beautiful 3-bedroom, 2-bath home featuring a large open floor plan and new ceiling fans. Located in the 55+ community of El Rio De Oro Mobile Home Park, this home offers convenient access to the medical center and a variety of nearby amenities. Buyer must be approved by park management. Lot rent applies; buyer to verify current amount and park details.
ⓘ Source: listings_history table (triggers on properties + properties_extension) + one-shot
backfill from property_details.listing_events for pre-trigger history.
Climate risk First Street
- Flood 1/10 Low FEMA zone X (unshaded) · 0% chance over 30 yrs
- Wildfire 5/10 Major
- Heat 6/10 Major 7 d/yr ≥102°F today · 18 d/yr by 30 yrs out
- Wind 1/10 Low
- Air quality 1/10 Low 0 unhealthy d/yr today · 0 by 30 yrs out
Nearby sold comps map
Loading sold comps map…
Walkable amenities ~0.75 mi
Loading nearby amenities…
Taxation est. · year 1
- Rental income
- $27,502
- − Mortgage interest
- −$4,481
- − Property taxes
- −$1,200
- − Insurance
- −$400
- − Repairs & maintenance
- −$2,200
- − Management
- −$2,200
- − Depreciation
- −$2,327
- Taxable income
- $14,693
- Est. tax owed @ 24.0%
- −$3,526
- After-tax cash flow
- $11,566/yr
For passive investors: Depreciation is non-cash, so a rental often shows a tax loss while cash-flowing — sheltering income. Rental losses are passive: they offset passive income freely, and up to $25,000/yr can offset ordinary (W-2) income if you actively participate and your MAGI is under $100k (phasing out to $0 by $150k); unused losses carry forward. On sale, claimed depreciation is recaptured at up to 25%, and gains may owe capital-gains tax (a 1031 exchange can defer both). Figures are a year-1 estimate at your 24.0% rate — not tax advice; consult a CPA.
Condition & rehab AI · 10 photos
This home is in fair condition with cosmetic updates needed to enhance its curb appeal and value.
Repairs flagged
- Minor kitchen cabinets — can be replaced with modern ones
- Minor appliances — can be upgraded for a fresh look
Value-add opportunities
- Both paint exterior — enhances curb appeal and value
- Both replace carpet — improves comfort and value
- Both update kitchen cabinets and appliances — modernizes the space and adds value
Renovation cost estimate screening
| Repair item | Severity | Est. cost |
|---|---|---|
| kitchen cabinets · can be replaced with modern ones | Minor | $500–3,000 |
| appliances · can be upgraded for a fresh look | Minor | $500–3,000 |
| Total estimated repair cost · 2 items | $1,000–6,000 |
Value-add ROI direction
- Both paint exterior — enhances curb appeal and value ↑
- Both replace carpet — improves comfort and value ↑
- Both update kitchen cabinets and appliances — modernizes the space and adds value ↑
ⓘ Cost ranges are severity-bucket heuristics (US national rule-of-thumb). Get contractor quotes + a written scope before underwriting a rehab budget.
Schools (NCES district)
- District
- Cottonwood-Oak Creek Elementary District (4487)
- NCES district ID
- 0402370
- Math proficiency
- 17% ▼ -10.00%
- Reading proficiency
- 28% ▼ -7.00%
- Median HH income
- $41,740
- Composite
- 19.16/100
- National rank
- #8822
- State rank
- #174 of 249 in AZ
Livability — Cottonwood
- Score
- 79/100
- State rank
- #7
- US rank
- #2176
Category grades
Schools grade is shown separately in the Schools card above.
Census & demographics
- Census place
- Cottonwood, AZ
- County
- Yavapai County · 190,406 people
- City population
- 24,852
- Metro
- Prescott Valley-Prescott, AZ
- Population (ZIP)
- 24,852
- Household income
- $57,378
- Rent vs Own
- Severe rent burden
- 894.0
Population outlook (Yavapai County) Hauer SSP2
- Today (2025)
- 241,389 people
- By 2030
- 249,523 · +3.4%
- By 2040
- 259,966 · +7.7%
- By 2050
- 264,736 · +9.7%
- By 2075
- 269,334 · +11.6%
- By 2100
- 256,505 · +6.3%
Race, ethnicity, and origin ACS 2023
- Neighborhood character
- Predominantly White (73%)
- Race & ethnicity
- White 73% Hispanic / Latino 20% Two or more races 14% Native American 1%
- Hispanic origin (detail)
- Mexican 17%
- Common ancestry
- Italian 3% Romanian 3% Lithuanian 2%
- Foreign-born
- 12% · Canada
- Languages at home
- 84% English-only · Spanish 14% German/W. Germanic 1%
Political lean MEDSL · Yavapai
- 2024 margin
- Solid R (+33.9) · D 32.6% · R 66.5%
- 2008→2024 swing
- -9.5pp toward R · 2008: -24.4pp · 2024: -33.9pp
- All cycles
- 2024: R+33.9 2020: R+29.3 2016: R+31.4 2012: R+30.7 2008: R+24.4
Not yet ingested
- Civics
- —
Market trends
- HPI YoY
- ▼ -165.27%
- Current HPI
- 347.5058
- Rent YoY
- ▼ -0.22%
- Metro
- Prescott Valley-Prescott, AZ
- State GDP YoY
- ▲ 4.54%
- F500 in state
- 20
Industry mix (Fortune 500 HQ in AZ)
| Industry | F500 HQs | Revenue |
|---|---|---|
| Technology | 2 | $13B |
|
||
| Mining / Metals | 1 | $23B |
|
||
| Environmental Services | 1 | $16B |
|
||
| Metals / Steel | 1 | $14B |
|
||
| Technology Distribution | 1 | $9B |
|
||
| Homebuilding | 1 | $8B |
|
||
Price history
-13.0% since first listed6 events — show timeline
- 2026-05-09 Price Changed $80,000 PAARMLS as Distributed by MLS Grid
- 2026-05-09 Price Changed $80,000 ARMLS
- 2026-03-26 Price Changed $85,000 PAARMLS as Distributed by MLS Grid
- 2026-03-26 Price Changed $85,000 ARMLS
- 2026-03-07 Listed $92,000 ARMLS
- 2026-03-07 Listed $92,000 PAARMLS as Distributed by MLS Grid
Cash-flow waterfall
monthlySold comps — $/sqft
last 12 mo · ≤1 miLoading sold comps…