1939 Rockcastle Rd · Cadiz, KY
Flood risk 1/10 · Minimal
- FEMA flood zone
- X (unshaded)
- Chance of flooding over 30 yrs
- 0.0%
- Est. flood insurance / yr
- $507 – $1,088
Fire risk 3/10 · Minor
- Est. fire insurance / yr
- $839 – $1,559
Heat risk 5/10 · Moderate
- Hot days now (above 108°F)
- 7 days/yr
- Hot days in 30 yrs
- 20 days/yr
Wind risk 3/10 · Minor
- Chance of severe wind over 30 yrs
- 7.0%
Air-quality risk 1/10 · Minimal
- Unhealthy air days now
- 0 days/yr
- Unhealthy air days in 30 yrs
- 0 days/yr
Risk factors via First Street. Map © Google.
Why this score? — see what drove the D+ grade
The composite is a weighted blend of 9 inputs, each scored 0–100. Each bar is that input's sub-score; the figure is the points it added to the 100-point composite (weight × sub-score).
- Cash flow +20.7/30.0
- ARV discount +7.6/15.0
- DSCR +6.6/10.0
- 1% rule +4.3/10.0
- Livability +3.1/5.0
- Schools +2.7/10.0
- Rent growth +2.5/5.0
- Condition / age +2.5/5.0
- Appreciation +0.0/10.0
$184,900
🖨 Deal sheet 📄 Offer letter ✓ Due diligence
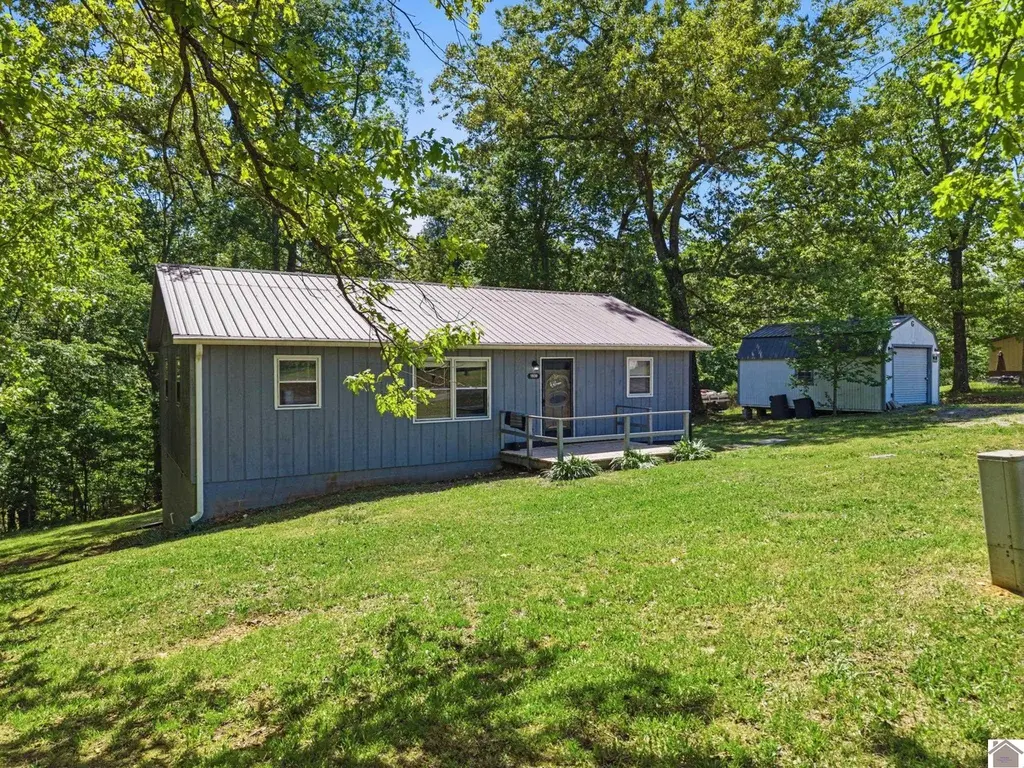
Listing remarks
Lake Barkley Gem! This updated 3-bed, 1-bath home is perfectly positioned just 1 mile from Moon River Marina & Resort on Lake Barkley and only 3 miles from downtown Cadiz, KY. Whether you're seeking a full-time residence, weekend retreat at the lake, or a short-term rental investment, this property delivers. Sitting on a spacious half-acre lot, major recent updates include new flooring (2023), new HVAC (2022), new gutters with leaf guard (2024), new water heater (2020), and a brand new front deck (2025). A durable metal roof adds long-term value and peace of mind. Out back, enjoy a deck overlooking a private tree-lined yard with a fenced area perfect for pets. A 14x20 double-loft outb
Key facts
- Metal roof
- New hvac
- New flooring
Tags
Neighborhood map
What this means for you Summary
Snapshot
- This is a 3-bed/1.0-bath single-family listed at $185k.
Deal economics
- At list price, monthly cash flow is $250 ($3k/yr) — positive.
- The deal already cash-flows at list — no discount required.
- To meet the 1% rule (rent ≥ 1% of price), the offer needs to be $172k (7.0% below list).
- Recommended offer: $172k (7.0% below list) — sets the bar for 1% rule.
- Cap rate 7.9% vs local median 3.6% in Cadiz — top-decile yield for the area; either an underpriced asset or a hidden risk that comps aren't pricing in. Stress-test before assuming the spread holds.
Location & tenants
- Location reads 62/100 on livability (#354 in KY) — a middle-class / working-renter tenant base. Strengths: crime A+, cost of living A+, housing A; Watch: schools D+, amenities F, commute F.
- Trigg County (town): math 23% / reading 40% proficiency, ranked #90 of 165 in KY (top 54%) — families likely to look elsewhere, expect single-tenant / working-renter base with shorter leases.
- Market conditions: 294 active listings in the ZIP; 10 units permitted in Trigg County in 2024 (0 in 5+ unit buildings).
Forward outlook
- Local home prices are declining (-3.0%/yr); year-one equity from $1k of loan paydown is wiped out by about $6k of value loss. Plan a longer hold.
- Trigg County population projected to shrink 7% by 2050 — rents likely to lag national; underwrite the cash flow, not the appreciation.
Negotiation context
- It's been on market 51 days — a 3% lower offer ($179k) is reasonable based on typical stale-listing flexibility.
- 5 sale attempts since 4y ago with the ask held roughly flat each time — persistent listings suggest the price (not the market) is what's stuck; bring a comps-based counter.
Risks & watch-outs
- Climate carrying-cost: extreme-heat days projected 7→20/yr by 2055 (HVAC capex compounding) — expect insurance premiums to compound above CPI over the hold.
Questions for the listing agent
- It's been on market 51 days. Have you received any prior offers? Is the seller open to a 7% concession, seller financing, or rate buy-down credit?
- Built in 1977 — when were the roof, HVAC, electrical panel, plumbing, and water heater last replaced?
- Is there a deadline driving the sale (1031 exchange, divorce, estate, relocation)? That informs how much negotiation room exists.
- Schools are D-rated, which usually means shorter tenancies and higher turnover. Who's the typical renter profile here, and what's been the actual vacancy rate?
- The area grade is low — what's the realistic commute time and amenity access for the typical tenant pool here? Any planned neighborhood developments (good or bad) we should know about?
- What's the average days-on-market for RENTAL listings here right now (not sales)? A rising rental-DOM trend means longer vacancies and softer asking-rent achievability than the comps imply.
- What's the recent tenant-quality profile in this submarket — average credit score on applications, eviction rate, late-payment / NSF rate, and stable-employment percentage? A property-management company in the area should have these aggregated.
- How much new for-sale + rental construction is in the pipeline within 1–3 miles? Heavy new supply typically softens prices + rents 12–24 months out; constrained supply supports both.
Investment metrics
- 1% rule
- 0.93% ✗
- Cap rate
- 7.91%
- Cash-on-cash
- 5.79%
- DSCR
- 1.26
- GRM
- 9.0
CMA / ARV
- ARV (median comp)
- $185,482
- List price
- $184,900
- Delta
- -0.31%
- Verdict
- FAIR
- Comps
- 4 within 1.0 mi
Projected returns pro-forma
-3.0% appreciation · 3.0% rent growth · sell at horizon
- IRR
- -7.4%
- Equity multiple
- 0.73×
- Total profit
- $-14,125
- Equity at exit
- $27,569
- IRR
- 2.1%
- Equity multiple
- 1.15×
- Total profit
- $7,876
- Equity at exit
- $15,987
Cash invested: $51,772 (down + closing). Projections, not guarantees.
Landlord ↔ Tenant lean methodology
- Overall (STATE)
- 83 Strongly Landlord-Friendly
- State Kentucky
- 83 Strongly Landlord-Friendly · R+16
- County
- — inherits STATE
- City
- — inherits STATE
ZIP-level market 42211
- Active inventory
- 294
- Price-to-rent
- 9.0×
Monthly cashflow live
- Estimated rent
- $1,720 medium interval (Pro) →
- Mortgage (P&I)
- −$970
- Tax from tax record
- −$62 /mo · $749/yr
- Insurance
- −$77
- HOA
- −$0
- Vacancy / Maint / Mgmt
- −$361
- Net cashflow
- $250
Break-even live
UW: 25.0% down · 7.5% · 30yr · 1.5% tax · 5.0% vac · 8.0% maint · 8.0% mgmt
Financing live
Cash to close
- Down payment
- $46,225
- Closing costs
- $5,547
- Reserves months
- —
- Total cash needed
- —
Loan-product check · same deal, 3 products live
Conventional
25% down · 7.5% · 30yr
- Down + closing
- —
- Monthly P&I
- —
- Monthly cashflow
- —
- DSCR
- —
- Eligible?
- —
Personal DTI + credit; lowest rate.
DSCR
20% down · 8.5% · 30yr
- Down + closing
- —
- Monthly P&I
- —
- Monthly cashflow
- —
- DSCR
- —
- Eligible?
- —
No personal income docs; deal must DSCR.
Hard money
10% down · 12.0% · 12mo
- Down + closing
- —
- Monthly P&I
- —
- Monthly cashflow
- —
- DSCR
- —
- Eligible?
- —
Short-term bridge; refi at stabilization.
Listing history 30 events
-
2026-06-18days on market $184,900 Active 51 DOM
-
2026-06-17days on market $184,900 Active 50 DOM
-
2026-06-16days on market $184,900 Active 49 DOM
-
2026-06-15days on market $184,900 Active 48 DOM
-
2026-06-14days on market $184,900 Active 46 DOM
-
2026-06-12days on market $184,900 Active 45 DOM
-
2026-06-09days on market $184,900 Active 42 DOM
-
2026-06-08days on market $184,900 Active 41 DOM
-
2026-06-07days on market $184,900 Active 40 DOM
-
2026-06-05days on market $184,900 Active 37 DOM
-
2026-06-03days on market $184,900 Active 36 DOM
-
2026-06-03days on market $184,900 Active 35 DOM
-
2026-06-01days on market $184,900 Active 34 DOM
-
2026-05-31days on market $184,900 Active 33 DOM
-
2026-05-30days on market $184,900 Active 32 DOM
-
2026-05-14price $184,900 832-char remark
-
2026-04-28$189,900 Active 832-char remark
-
2025-08-11price $189,900
-
2025-08-06price $194,900
-
2025-07-22$199,900 Active
-
2025-05-29soldstatus $168,000
-
2025-05-23soldstatus $168,000 Closed
-
2025-02-18price $179,900
-
2025-01-03price $185,000
-
2024-12-16$194,000 Active
-
2022-08-29soldstatus $82,500
-
2022-08-25soldstatus $82,500
-
2022-08-25soldstatus $82,500
-
2022-06-03$89,900
-
2022-06-03$89,900
ⓘ Source: listings_history table (triggers on properties + properties_extension) + one-shot
backfill from property_details.listing_events for pre-trigger history.
Tax reassessment forecast KY · Resets to sale price
- Current annual tax
- $749 · $62/mo
- Projected year-2 tax
- $1,590 · $133/mo
- Expected delta
- +$842/yr (+$70/mo · 112.4%)
ⓘ Screening estimate from a state-policy table — verify with the county assessor before closing.
Climate risk First Street
- Flood 1/10 Low FEMA zone X (unshaded) · 0% chance over 30 yrs
- Wildfire 3/10 Moderate
- Heat 5/10 Major 7 d/yr ≥108°F today · 20 d/yr by 30 yrs out
- Wind 3/10 Moderate 7% chance of damaging wind over 30 yrs
- Air quality 1/10 Low 0 unhealthy d/yr today · 0 by 30 yrs out
Nearby sold comps map
Loading sold comps map…
Walkable amenities ~0.75 mi
Loading nearby amenities…
Taxation est. · year 1
- Rental income
- $20,642
- − Mortgage interest
- −$10,357
- − Property taxes
- −$749
- − Insurance
- −$924
- − Repairs & maintenance
- −$1,651
- − Management
- −$1,651
- − Depreciation
- −$5,379
- Taxable loss
- −$70
- Est. tax savings @ 24.0%
- +$17
- After-tax cash flow
- $3,015/yr
For passive investors: Depreciation is non-cash, so a rental often shows a tax loss while cash-flowing — sheltering income. Rental losses are passive: they offset passive income freely, and up to $25,000/yr can offset ordinary (W-2) income if you actively participate and your MAGI is under $100k (phasing out to $0 by $150k); unused losses carry forward. On sale, claimed depreciation is recaptured at up to 25%, and gains may owe capital-gains tax (a 1031 exchange can defer both). Figures are a year-1 estimate at your 24.0% rate — not tax advice; consult a CPA.
Schools (NCES district)
- District
- Trigg County
- NCES district ID
- 2105580
- Math proficiency
- 23% ▼ -20.00%
- Reading proficiency
- 40% ▼ -16.00%
- Median HH income
- $44,636
- Composite
- 26.87/100
- National rank
- #7100
- State rank
- #90 of 165 in KY
Livability — Cadiz
- Score
- 62/100
- State rank
- #354
- US rank
- #16772
Category grades
Schools grade is shown separately in the Schools card above.
Census & demographics
- Population (ZIP)
- 12,912
Population outlook (Trigg County) Hauer SSP2
- Today (2025)
- 14,071 people
- By 2030
- 13,950 · -0.9%
- By 2040
- 13,575 · -3.5%
- By 2050
- 13,065 · -7.1%
- By 2075
- 11,990 · -14.8%
- By 2100
- 10,802 · -23.2%
Race, ethnicity, and origin ACS 2023
- Neighborhood character
- Predominantly White (88%)
- Race & ethnicity
- White 88% Two or more races 6% Black 4% Hispanic / Latino 3%
- Common ancestry
- Italian 2% Slovak 2% Iranian 1%
- Foreign-born
- 2% · Canada
- Languages at home
- 91% English-only · German/W. Germanic 7% Spanish 2%
Political lean MEDSL · Trigg
- 2024 margin
- Solid R (+52.4) · D 23.2% · R 75.5% · Other 1.3%
- 2008→2024 swing
- -22.6pp toward R · 2008: -29.8pp · 2024: -52.4pp
- All cycles
- 2024: R+52.4 2020: R+50.1 2016: R+49.6 2012: R+35.7 2008: R+29.8
Not yet ingested
- Civics
- —
Market trends
- HPI YoY
- ▼ -86.15%
- Current HPI
- 130.8351
- Rent YoY
- —
- Metro
- —
- State GDP YoY
- ▲ 1.81%
- F500 in state
- 4
Industry mix (Fortune 500 HQ in KY)
| Industry | F500 HQs | Revenue |
|---|---|---|
| Healthcare | 1 | $118B |
|
||
| Food / Beverage | 1 | $7B |
|
||
Price history
+105.7% since first listed15 events — show timeline
- 2026-05-14 Price Changed $184,900 WKRMLS
- 2026-04-28 Listed $189,900 WKRMLS
- 2025-08-11 Price Changed $189,900 GORAMLS
- 2025-08-06 Price Changed $194,900 GORAMLS
- 2025-07-22 Listed $199,900 GORAMLS
- 2025-05-29 Sold (Public Records) $168,000 Public Records
- 2025-05-23 Sold (MLS) $168,000 WKRMLS
- 2025-02-18 Price Changed $179,900 WKRMLS
- 2025-01-03 Price Changed $185,000 WKRMLS
- 2024-12-16 Listed $194,000 WKRMLS
- 2022-08-29 Sold (Public Records) $82,500 Public Records
- 2022-08-25 Sold (MLS) $82,500 REALTRACS as Distributed by MLS Grid
- 2022-08-25 Sold (MLS) $82,500 WKRMLS
- 2022-06-03 Listed $89,900 WKRMLS
- 2022-06-03 Listed $89,900 REALTRACS as Distributed by MLS Grid
Property tax history
+25.8%/yrLatest (2025): $749 · -0.8% YoY. Source: county tax records.
Cash-flow waterfall
monthlySold comps — $/sqft
last 12 mo · ≤1 miLoading sold comps…