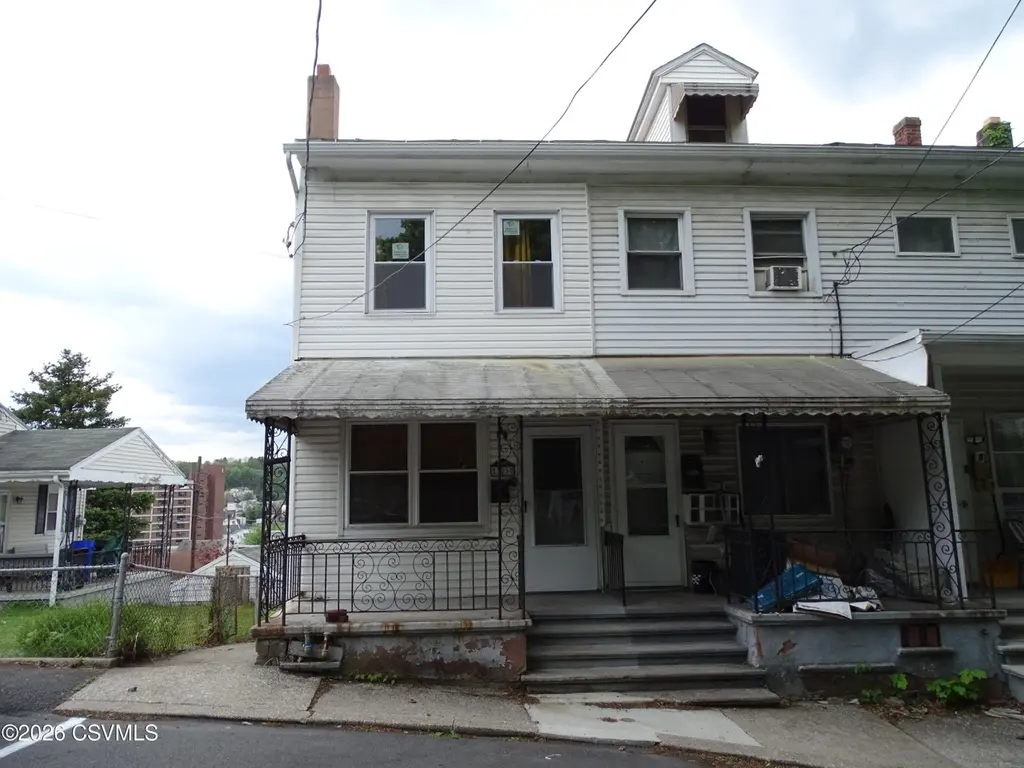
321 High St · Minersville, PA
Flood risk 1/10 · Minimal
- FEMA flood zone
- X (unshaded)
- Chance of flooding over 30 yrs
- 0.0%
- Est. flood insurance / yr
- $473 – $860
Fire risk 2/10 · Minimal
- Est. fire insurance / yr
- $511 – $949
Heat risk 4/10 · Minor
- Hot days now (above 95°F)
- 7 days/yr
- Hot days in 30 yrs
- 16 days/yr
Wind risk 4/10 · Minor
- Chance of severe wind over 30 yrs
- 8.0%
Air-quality risk 2/10 · Minimal
- Unhealthy air days now
- 1 days/yr
- Unhealthy air days in 30 yrs
- 3 days/yr
Risk factors via First Street. Map © Google.
Why this score? — see what drove the C grade
The composite is a weighted blend of 9 inputs, each scored 0–100. Each bar is that input's sub-score; the figure is the points it added to the 100-point composite (weight × sub-score).
- Cash flow +19.0/30.0
- 1% rule +7.8/10.0
- Appreciation +7.3/10.0
- ARV discount +6.8/15.0
- DSCR +6.0/10.0
- Livability +3.5/5.0
- Schools +3.0/10.0
- Rent growth +2.5/5.0
- Condition / age +2.5/5.0
$89,900
🖨 Deal sheet 📄 Offer letter ✓ Due diligence
Listing remarks
This move-in ready 3-bedroom, 1-bath half-double in Minersville offers a spacious layout, oil forced-air heat, and a welcoming back deck & fenced in yard that provides additional outdoor living space. This property is ready for its next resident to make it home. Call to schedule your showing today!
Key facts
- Back deck
- Oil forced-air heat
- Fenced in yard
Tags
Property features AI
Exterior
- Parking: No parking
- Utilities: Public water; Public sewer
- Home design: Single family residence; Residential property
- Construction: Vinyl siding; Frame construction; No foundation specified; Built area above grade: 1,209
- Exterior features: Deck; Porch; Storm door(s); Shingle roof; Sidewalks
Interior
- Kitchen: Refrigerator
- Bathrooms: 1 full bathroom
- Heating & cooling: Has heating; Ceiling fan(s)
- Interior features: Walk-in closet(s); Insulated windows
- Laundry & utility: Washer; Dryer
Neighborhood map
What this means for you Summary
Snapshot
- This is a 2-bed/1.0-bath single-family listed at $90k.
Deal economics
- At list price, monthly cash flow is $93 ($1k/yr) — positive.
- The deal already cash-flows at list — no discount required.
- Meets the 1% rule at list price ($1k rent vs $90k).
- Recommended offer: $89k (1.5% below list) — sets the bar for market timing.
Location & tenants
- Location reads 70/100 on livability (#742 in PA) — a middle-class / working-renter tenant base. Strengths: cost of living A+, health & safety A+, crime A; Watch: schools C-, commute F, employment F.
- Minersville Area SD (town): math 21% / reading 50% proficiency, ranked #420 of 539 in PA (top 78%) — families likely to look elsewhere, expect single-tenant / working-renter base with shorter leases.
- Market conditions: 38 active listings in the ZIP; 1 comparable units currently listed for rent nearby; 169 units permitted in Schuylkill County in 2024 (0 in 5+ unit buildings).
Forward outlook
- In year one you build about $5k of equity ($622 loan paydown + $4k appreciation (4.7% local appreciation)).
- Schuylkill County population projected at -16% by 2050 — secular population decline; favor cash flow + early exit over multi-decade hold.
- At projected returns (4.7% appreciation + 3.0% rent growth), your $25k cash investment doubles in ~4 years — after that, you're playing with house money.
- By year 7, paydown + projected appreciation supports a ~$31k cash-out refi (75% LTV) — recoverable capital for the next deal without selling this one.
Negotiation context
- It's been on market 21 days — a 2% lower offer ($89k) is reasonable based on typical stale-listing flexibility.
- 3 sale attempts with the ask held roughly flat each time — persistent listings suggest the price (not the market) is what's stuck; bring a comps-based counter.
- Current owner paid $38k; list at $90k implies a 137% gain — meaningful room to come down on a strong offer.
Risks & watch-outs
- Watch-outs: property tax is 4.1% of price; built in 1920 — expect roof / HVAC / electrical / plumbing capex.
Questions for the listing agent
- Built in 1920 — when were the roof, HVAC, electrical panel, plumbing, and water heater last replaced?
- Property tax is high relative to price — has the assessment been appealed recently, and will the sale trigger a re-assessment?
- Is there a deadline driving the sale (1031 exchange, divorce, estate, relocation)? That informs how much negotiation room exists.
- What's the average days-on-market for RENTAL listings here right now (not sales)? A rising rental-DOM trend means longer vacancies and softer asking-rent achievability than the comps imply.
- What's the recent tenant-quality profile in this submarket — average credit score on applications, eviction rate, late-payment / NSF rate, and stable-employment percentage? A property-management company in the area should have these aggregated.
- How much new for-sale + rental construction is in the pipeline within 1–3 miles? Heavy new supply typically softens prices + rents 12–24 months out; constrained supply supports both.
Investment metrics
- 1% rule
- 1.28% ✓
- Cap rate
- 7.54%
- Cash-on-cash
- 4.45%
- DSCR
- 1.20
- GRM
- 6.5
CMA / ARV
- ARV (median comp)
- $88,571
- List price
- $89,900
- Delta
- 1.50%
- Verdict
- FAIR
- Comps
- 20 within 1.0 mi
Show comp detail 10 sales within ~0.75 mi
| Address | Dist | Beds/Ba | Sqft | Sold | Price | $/sf | Match |
|---|---|---|---|---|---|---|---|
| 325 Lewis St | 0.19mi | 3/1.0 (+1) | 1,302 (+0%) | 7mo | $81,000 | $62 | 80 |
| 227 Middle St | 0.37mi | 3/1.0 (+1) | 1,200 (-8%) | 13mo | $19,000 | $16 | 54 |
| 235 Carbon St | 0.12mi | 3/1.0 (+1) | 1,458 (+12%) | 18mo | $75,000 | $51 | 54 |
| 201 Arlene St | 0.59mi | 3/1.0 (+1) | 1,232 (-5%) | 6mo | $250,000 | $203 | 54 |
| 39 Westwood St | 0.40mi | 3/1.0 (+1) | 1,400 (+8%) | 17mo | $124,000 | $89 | 49 |
| 325 Washington St | 0.67mi | 3/1.0 (+1) | 1,204 (-7%) | 7mo | $175,650 | $146 | 45 |
| 25 Carbon St | 0.25mi | 3/1.0 (+1) | 1,460 (+12%) | 21mo | $105,000 | $72 | 45 |
| 5 Shady Ln | 0.67mi | 3/2.0 (+1) | 1,350 (+4%) | 12mo | $185,000 | $137 | 44 |
| 419 Coal St | 0.41mi | 3/1.5 (+1) | 1,490 (+15%) | 10mo | $165,000 | $111 | 42 |
| 401 Spring St | 0.60mi | 3/1.5 (+1) | 1,136 (-13%) | 10mo | $180,000 | $158 | 35 |
Match score weights: distance 35% · size 25% · config 20% · recency 20%. Top-matched comps best support the ARV.
Projected returns pro-forma
4.65% appreciation · 3.0% rent growth · sell at horizon
- IRR
- 15.9%
- Equity multiple
- 1.99×
- Total profit
- $25,020
- Equity at exit
- $49,053
- IRR
- 16.6%
- Equity multiple
- 3.85×
- Total profit
- $71,652
- Equity at exit
- $83,134
Cash invested: $25,172 (down + closing). Projections, not guarantees.
Landlord ↔ Tenant lean methodology
- Overall (STATE)
- 62 Landlord-Friendly
- State Pennsylvania
- 62 Landlord-Friendly · EVEN
- County
- — inherits STATE
- City
- — inherits STATE
ZIP-level market 17954
- Home prices YoY
- 2.3%
- Active inventory
- 38
- Price-to-rent
- 6.5×
Monthly cashflow live
- Estimated rent
- $1,150 medium interval (Pro) →
- Mortgage (P&I)
- −$471
- Tax from tax record
- −$306 /mo · $3,676/yr
- Insurance
- −$37
- HOA
- −$0
- Vacancy / Maint / Mgmt
- −$242
- Net cashflow
- $93
Break-even live
UW: 25.0% down · 7.5% · 30yr · 1.5% tax · 5.0% vac · 8.0% maint · 8.0% mgmt
Financing live
Cash to close
- Down payment
- $22,475
- Closing costs
- $2,697
- Reserves months
- —
- Total cash needed
- —
Loan-product check · same deal, 3 products live
Conventional
25% down · 7.5% · 30yr
- Down + closing
- —
- Monthly P&I
- —
- Monthly cashflow
- —
- DSCR
- —
- Eligible?
- —
Personal DTI + credit; lowest rate.
DSCR
20% down · 8.5% · 30yr
- Down + closing
- —
- Monthly P&I
- —
- Monthly cashflow
- —
- DSCR
- —
- Eligible?
- —
No personal income docs; deal must DSCR.
Hard money
10% down · 12.0% · 12mo
- Down + closing
- —
- Monthly P&I
- —
- Monthly cashflow
- —
- DSCR
- —
- Eligible?
- —
Short-term bridge; refi at stabilization.
Rent comps 1 comps
| Address | Beds | Baths | Sqft | Rent | $/sqft | DOM | Units | Dist |
|---|---|---|---|---|---|---|---|---|
| 504 Laurel St Minersville, PA | 3.0 | 2.0 | 1059 | $1,150 | $1.09 | 43d | 1 | 0.61mi |
Listing history 6 events
-
2026-05-31statusdays on market $89,900 Pending 21 DOM
-
2026-05-17historical Active Under Contract 305-char remark
-
2026-05-09$89,900 Active 305-char remark
-
2025-06-02historical $1,275
-
2025-05-01$1,275
-
1997-11-21soldstatus $38,000
ⓘ Source: listings_history table (triggers on properties + properties_extension) + one-shot
backfill from property_details.listing_events for pre-trigger history.
Tax reassessment forecast PA · Partial reset (capped growth)
- Current annual tax
- $3,676 · $306/mo
- Projected year-2 tax
- $3,676 · $306/mo
- Expected delta
- $0/yr ($0/mo · 0.0%)
ⓘ Screening estimate from a state-policy table — verify with the county assessor before closing.
Climate risk First Street
- Flood 1/10 Low FEMA zone X (unshaded) · 0% chance over 30 yrs
- Wildfire 2/10 Low
- Heat 4/10 Moderate 7 d/yr ≥95°F today · 16 d/yr by 30 yrs out
- Wind 4/10 Moderate 8% chance of damaging wind over 30 yrs
- Air quality 2/10 Low 1 unhealthy d/yr today · 3 by 30 yrs out
Nearby sold comps map
Loading sold comps map…
Walkable amenities ~0.75 mi
Loading nearby amenities…
Taxation est. · year 1
- Rental income
- $13,800
- − Mortgage interest
- −$5,036
- − Property taxes
- −$3,676
- − Insurance
- −$450
- − Repairs & maintenance
- −$1,104
- − Management
- −$1,104
- − Depreciation
- −$2,615
- Taxable loss
- −$184
- Est. tax savings @ 24.0%
- +$44
- After-tax cash flow
- $1,164/yr
For passive investors: Depreciation is non-cash, so a rental often shows a tax loss while cash-flowing — sheltering income. Rental losses are passive: they offset passive income freely, and up to $25,000/yr can offset ordinary (W-2) income if you actively participate and your MAGI is under $100k (phasing out to $0 by $150k); unused losses carry forward. On sale, claimed depreciation is recaptured at up to 25%, and gains may owe capital-gains tax (a 1031 exchange can defer both). Figures are a year-1 estimate at your 24.0% rate — not tax advice; consult a CPA.
Schools (NCES district)
- District
- Minersville Area SD
- NCES district ID
- 4215510
- Math proficiency
- 21% ▼ -12.00%
- Reading proficiency
- 50% ▼ -8.00%
- Median HH income
- $40,865
- Composite
- 29.77/100
- National rank
- #6433
- State rank
- #420 of 539 in PA
Livability — Minersville
- Score
- 70/100
- State rank
- #742
- US rank
- #7439
Category grades
Schools grade is shown separately in the Schools card above.
Census & demographics
- Census place
- Minersville, PA
- City population
- 27,121
- Population (ZIP)
- 4,564
Population outlook (Schuylkill County) Hauer SSP2
- Today (2025)
- 137,447 people
- By 2030
- 133,121 · -3.1%
- By 2040
- 124,172 · -9.7%
- By 2050
- 115,611 · -15.9%
- By 2075
- 100,796 · -26.7%
- By 2100
- 86,667 · -36.9%
Race, ethnicity, and origin ACS 2023
- Neighborhood character
- Predominantly White (81%)
- Race & ethnicity
- White 81% Two or more races 15% Hispanic / Latino 12%
- Hispanic origin (detail)
- Puerto Rican 11%
- Common ancestry
- Polish 5% Romanian 5% Subsaharan African 4%
- Foreign-born
- 3% · Canada, China
- Languages at home
- 97% English-only · Spanish 2%
Political lean MEDSL · Schuylkill
- 2024 margin
- Solid R (+42.1) · D 28.5% · R 70.6%
- 2008→2024 swing
- -33.4pp toward R · 2008: -8.7pp · 2024: -42.1pp
- All cycles
- 2024: R+42.1 2020: R+39.9 2016: R+43.4 2012: R+13.4 2008: R+8.7
Not yet ingested
- Civics
- —
Market trends
- HPI YoY
- ▲ 4.65%
- Current HPI
- 209.7647
- Rent YoY
- —
- Metro
- —
- State GDP YoY
- ▲ 1.68%
- F500 in state
- 34
Industry mix (Fortune 500 HQ in PA)
| Industry | F500 HQs | Revenue |
|---|---|---|
| Healthcare | 2 | $309B |
|
||
| Insurance | 2 | $27B |
|
||
| Telecommunications / Media | 1 | $124B |
|
||
| Industrial Distribution | 1 | $22B |
|
||
| Financial Services | 1 | $20B |
|
||
| Chemicals / Materials | 1 | $18B |
|
||
Price history
+136.6% since first listed7 events — show timeline
- 2026-05-30 Pending — CSVBR
- 2026-05-20 Relisted — CSVBR
- 2026-05-17 Contingent — CSVBR
- 2026-05-09 Listed $89,900 CSVBR
- 2025-06-02 Rental Removed $1,275 TENANTTURNER2
- 2025-05-01 Listed for Rent $1,275 TENANTTURNER2
- 1997-11-21 Sold (Public Records) $38,000 Public Records
Property tax history
+12.5%/yrLatest (2026): $3,676 · +179.0% YoY. Source: county tax records.
Cash-flow waterfall
monthlySold comps — $/sqft
last 12 mo · ≤1 miLoading sold comps…