83 Lakeview Rd · Neoga, IL
Flood risk No data
- FEMA flood zone
- —
- Chance of flooding over 30 yrs
- —
- Est. flood insurance / yr
- —
Fire risk No data
- Est. fire insurance / yr
- —
Heat risk No data
- Hot days now (above threshold)
- —
- Hot days in 30 yrs
- —
Wind risk No data
- Chance of severe wind over 30 yrs
- —
Air-quality risk No data
- Unhealthy air days now
- —
- Unhealthy air days in 30 yrs
- —
Risk factors via First Street. Map © Google.
Why this score? — see what drove the D- grade
The composite is a weighted blend of 9 inputs, each scored 0–100. Each bar is that input's sub-score; the figure is the points it added to the 100-point composite (weight × sub-score).
- 1% rule +10.0/10.0
- ARV discount +7.7/15.0
- Appreciation +7.1/10.0
- Livability +3.7/5.0
- Rent growth +2.5/5.0
- Condition / age +2.2/5.0
- Schools +1.7/10.0
- Cash flow +0.7/30.0
- DSCR +0.0/10.0
$28,900
🖨 Deal sheet (PDF) 📄 Offer letter ✓ Due diligence
Listing remarks MLS
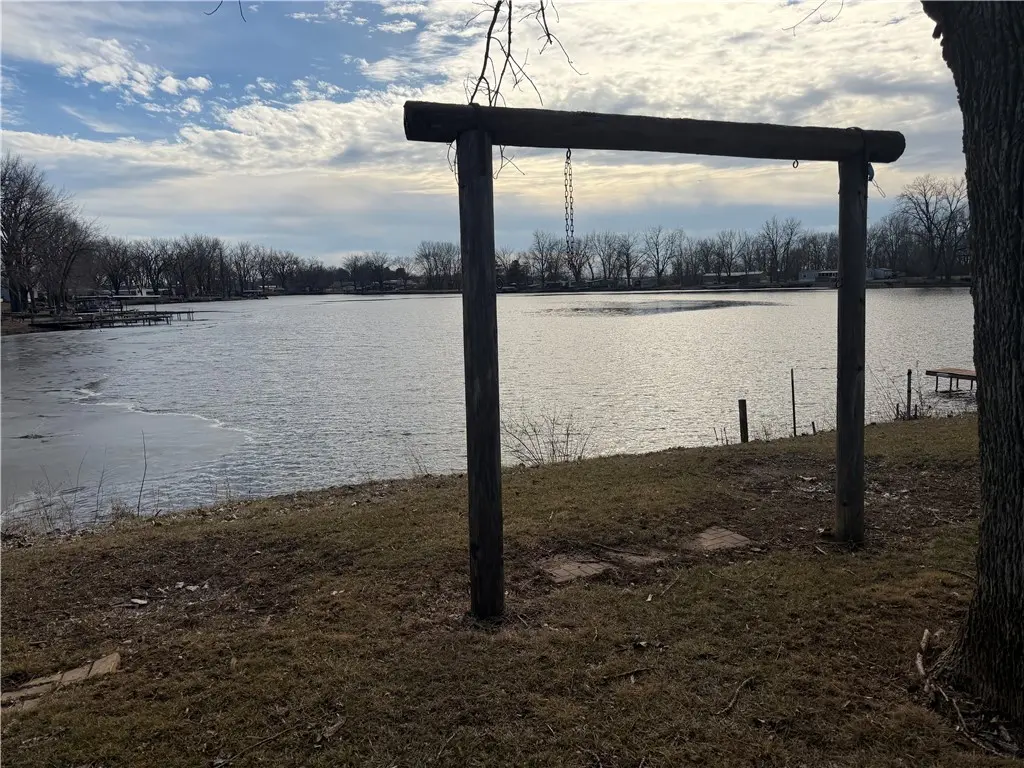
Beautiful location directly on lake. Experience peace, freedom, and stunning water views every day with your own home on the lake. Wake up to the sound of nature, sip your morning coffee by the water, and enjoy fishing, boating, or simply relaxing in your private paradise. Affordable and comfortable — your lake life begins now! Fixer Upper. Home is for sale and lot rent is $575/mo. which includes water, garbage, sewer. Must fill out application and be approved by management prior to sale.
Key facts
- Boating
- Water views
- Private paradise
Tags
Neighborhood map
What this means for you Summary
Snapshot
- This is a 2-bed/1.5-bath manufactured listed at $29k. Condition is rated fair.
Deal economics
- At list price, monthly cash flow is $-123 ($-1k/yr) — negative.
- To cash-flow at today's rent, offer at most $11k (61.6% below list).
- Meets the 1% rule at list price ($825 rent vs $29k).
- Recommended offer: $11k (61.6% below list) — sets the bar for cash-flow.
Location & tenants
- Location reads 73/100 on livability (#282 in IL) — a middle-class / working-renter tenant base. Strengths: crime A+, cost of living A+, housing A+; Watch: amenities F, commute F.
- Neoga CUSD 3 (rural): math 15% / reading 23% proficiency, ranked #442 of 620 in IL (top 71%) — low school quality limits family demand, transient renter base, plan for 1-2y turnover.
- Zoned schools: Neoga Elementary School (math 12% / reading 12%, grade F, #1,403 of 2,056 statewide, top 71%, 223 students, 0% FRL); Neoga Jr/Sr High School (math 17% / reading 27%, grade F, #319 of 693 statewide, top 50%, 278 students, 0% FRL) — zoned schools average 0% FRL vs 34% district-wide (34 pts lower); this property's tenant base skews higher-income than the district average.
- Market conditions: 3 active listings in the ZIP; 34 units permitted in Coles County in 2024 (30 in 5+ unit buildings).
Forward outlook
- In year one you build about $1k of equity ($200 loan paydown + $1k appreciation (4.2% local appreciation)).
- Coles County population projected to shrink 7% by 2050 — rents likely to lag national; underwrite the cash flow, not the appreciation.
Negotiation context
- It's been on market 123 days — a 12% lower offer ($25k) is reasonable based on typical stale-listing flexibility.
Risks & watch-outs
- Watch-outs: HOA is 70% of rent.
Questions for the listing agent
- What do current leases actually rent for vs. the listed asking? Can we see a recent rent roll and the last 12 months of T-12 income?
- It's been on market 123 days. Have you received any prior offers? Is the seller open to a 62% concession, seller financing, or rate buy-down credit?
- Have any recent inspections been done? Can we get a copy of the seller's disclosures and any deferred-maintenance estimates?
- Built in 1970 — when were the roof, HVAC, electrical panel, plumbing, and water heater last replaced?
- What does the HOA fee cover, when was the last increase, and are there any pending special assessments or reserve-fund shortfalls?
- Why hasn't it sold? Are there any deal-killer items the seller is aware of (foundation, flood, title, zoning, code violations)?
- Is there a deadline driving the sale (1031 exchange, divorce, estate, relocation)? That informs how much negotiation room exists.
- Schools are F-rated, which usually means shorter tenancies and higher turnover. Who's the typical renter profile here, and what's been the actual vacancy rate?
- The area grade is low — what's the realistic commute time and amenity access for the typical tenant pool here? Any planned neighborhood developments (good or bad) we should know about?
- What's the average days-on-market for RENTAL listings here right now (not sales)? A rising rental-DOM trend means longer vacancies and softer asking-rent achievability than the comps imply.
- What's the recent tenant-quality profile in this submarket — average credit score on applications, eviction rate, late-payment / NSF rate, and stable-employment percentage? A property-management company in the area should have these aggregated.
- How much new for-sale + rental construction is in the pipeline within 1–3 miles? Heavy new supply typically softens prices + rents 12–24 months out; constrained supply supports both.
Investment metrics
- 1% rule
- 2.85% ✓
- Cap rate
- 1.19%
- Cash-on-cash
- -18.23%
- DSCR
- 0.19
- GRM
- 2.9
CMA / ARV
- ARV (median comp)
- $29,000
- List price
- $28,900
- Delta
- -0.34%
- Verdict
- FAIR
- Comps
- 1 within 2.0 mi
Show comp detail 1 sale within ~0.75 mi
| Address | Dist | Beds/Ba | Sqft | Sold | Price | $/sf | Match |
|---|---|---|---|---|---|---|---|
| 43 Lakeview Rd | 0.08mi | 2/1.5 | 780 (+5%) | 3mo | $29,000 | $37 | 85 |
Match score weights: distance 35% · size 25% · config 20% · recency 20%. Top-matched comps best support the ARV.
Projected returns pro-forma
4.15% appreciation · 3.0% rent growth · sell at horizon
- IRR
- -4.3%
- Equity multiple
- 0.73×
- Total profit
- $-2,187
- Equity at exit
- $14,907
- IRR
- 1.1%
- Equity multiple
- 1.20×
- Total profit
- $1,585
- Equity at exit
- $24,586
Cash invested: $8,092 (down + closing). Projections, not guarantees.
Landlord ↔ Tenant lean methodology
- Overall (STATE)
- 43 Moderately Tenant-Leaning
- State Illinois
- 43 Moderately Tenant-Leaning · D+7
- County
- — inherits STATE
- City
- — inherits STATE
ZIP-level market 61928
- Home prices YoY
- 2.8%
- Active inventory
- 3
- Price-to-rent
- 2.9×
Monthly cashflow live
- Estimated rent
- $825 medium interval (Pro) →
- Mortgage (P&I)
- −$152
- Tax est. 1.5%
- −$36 /mo · $434/yr
- Insurance
- −$12
- HOA
- −$575
- Vacancy / Maint / Mgmt
- −$173
- Net cashflow
- $-123
Break-even live
Sensitivity live
| Price | -10% $-103 | -5% $-113 | +0% $-123 | +5% $-133 | +10% $-143 |
|---|---|---|---|---|---|
| Rent | -10% $-188 | -5% $-156 | +0% $-123 | +5% $-90 | +10% $-58 |
| Rate | -1.0pp $-108 | -0.5pp $-116 | base $-123 | +0.5pp $-130 | +1.0pp $-138 |
UW: 25.0% down · 7.5% · 30yr · 1.5% tax · 5.0% vac · 8.0% maint · 8.0% mgmt
Financing live
Cash to close
- Down payment
- $7,225
- Closing costs
- $867
- Reserves months
- —
- Total cash needed
- —
Loan-product check · same deal, 3 products live
Conventional
25% down · 7.5% · 30yr
- Down + closing
- —
- Monthly P&I
- —
- Monthly cashflow
- —
- DSCR
- —
- Eligible?
- —
Personal DTI + credit; lowest rate.
DSCR
20% down · 8.5% · 30yr
- Down + closing
- —
- Monthly P&I
- —
- Monthly cashflow
- —
- DSCR
- —
- Eligible?
- —
No personal income docs; deal must DSCR.
Hard money
10% down · 12.0% · 12mo
- Down + closing
- —
- Monthly P&I
- —
- Monthly cashflow
- —
- DSCR
- —
- Eligible?
- —
Short-term bridge; refi at stabilization.
HOA detail
- Monthly dues
- $575 · $6,900/yr
- Likely covers
- watersewertrash
Listing history 18 events
-
2026-06-22days on market $28,900 Active 123 DOM
-
2026-06-21days on market $28,900 Active 122 DOM
-
2026-06-19days on market $28,900 Active 120 DOM
-
2026-06-18days on market $28,900 Active 119 DOM
-
2026-06-17days on market $28,900 Active 118 DOM
-
2026-06-16days on market $28,900 Active 117 DOM
-
2026-06-15days on market $28,900 Active 116 DOM
-
2026-06-14days on market $28,900 Active 114 DOM
-
2026-06-12days on market $28,900 Active 113 DOM
-
2026-06-09days on market $28,900 Active 110 DOM
-
2026-06-08days on market $28,900 Active 109 DOM
-
2026-06-07days on market $28,900 Active 108 DOM
-
2026-06-05days on market $28,900 Active 105 DOM
-
2026-06-02days on market $28,900 Active 103 DOM
-
2026-06-01days on market $28,900 Active 102 DOM
-
2026-05-31days on market $28,900 Active 101 DOM
-
2026-05-30days on market $28,900 Active 100 DOM
-
2026-02-19$28,900 Active 499-char remark
Show marketing remark (499 chars)
Beautiful location directly on lake. Experience peace, freedom, and stunning water views every day with your own home on the lake. Wake up to the sound of nature, sip your morning coffee by the water, and enjoy fishing, boating, or simply relaxing in your private paradise. Affordable and comfortable — your lake life begins now! Fixer Upper. Home is for sale and lot rent is $575/mo. which includes water, garbage, sewer. Must fill out application and be approved by management prior to sale.
ⓘ Source: listings_history table (triggers on properties + properties_extension) + one-shot
backfill from property_details.listing_events for pre-trigger history.
Nearby sold comps map
Loading sold comps map…
Walkable amenities ~0.75 mi
Loading nearby amenities…
Taxation est. · year 1
- Rental income
- $9,900
- − Mortgage interest
- −$1,619
- − Property taxes
- −$434
- − Insurance
- −$144
- − Repairs & maintenance
- −$792
- − Management
- −$792
- − HOA
- −$6,900
- − Depreciation
- −$841
- Taxable loss
- −$1,621
- Est. tax savings @ 24.0%
- +$389
- After-tax cash flow
- $-1,086/yr
For passive investors: Depreciation is non-cash, so a rental often shows a tax loss while cash-flowing — sheltering income. Rental losses are passive: they offset passive income freely, and up to $25,000/yr can offset ordinary (W-2) income if you actively participate and your MAGI is under $100k (phasing out to $0 by $150k); unused losses carry forward. On sale, claimed depreciation is recaptured at up to 25%, and gains may owe capital-gains tax (a 1031 exchange can defer both). Figures are a year-1 estimate at your 24.0% rate — not tax advice; consult a CPA.
Condition & rehab AI · 9 photos
The home is in fair condition with significant exterior and landscaping issues. Painting and repainting the exterior, along with landscaping and fence improvement, would significantly increase its value.
Repairs flagged
- Major roof — The independent image shows a dark, possibly weathered roof.
- Major exterior siding — The independent image shows peeling paint and siding, indicating the need for repainting or replacement.
- Major exterior paint — The independent image shows walls with some discoloration, indicating the need for touch-up or repainting.
- Major landscaping — The independent image shows a lack of landscaping and a simple fence, which could be improved to enhance curb appeal.
Value-add opportunities
- Both painting and repainting the exterior — Painting and repainting the exterior would improve the home's curb appeal and increase its value.
- Both landscaping and fence improvement — Landscaping and improving the fence would enhance the home's curb appeal and increase its value.
- Rental HVAC cleaning — Cleaning the HVAC system would improve the home's comfort and reduce energy costs, making it more attractive to renters.
Renovation cost estimate screening
| Repair item | Severity | Est. cost |
|---|---|---|
| roof · The independent image shows a dark, possibly weathered roof. | Major | $15,000–50,000 |
| exterior siding · The independent image shows peeling paint and siding, indicating the need for repainting or replacement. | Major | $15,000–50,000 |
| exterior paint · The independent image shows walls with some discoloration, indicating the need for touch-up or repainting. | Major | $15,000–50,000 |
| landscaping · The independent image shows a lack of landscaping and a simple fence, which could be improved to enhance curb appeal. | Major | $15,000–50,000 |
| Total estimated repair cost · 4 items | $60,000–200,000 |
Value-add ROI direction
- Both painting and repainting the exterior — Painting and repainting the exterior would improve the home's curb appeal and increase its value. ↑
- Both landscaping and fence improvement — Landscaping and improving the fence would enhance the home's curb appeal and increase its value. ↑
- Rental HVAC cleaning — Cleaning the HVAC system would improve the home's comfort and reduce energy costs, making it more attractive to renters. ↑
ⓘ Cost ranges are severity-bucket heuristics (US national rule-of-thumb). Get contractor quotes + a written scope before underwriting a rehab budget.
Schools (NCES district)
- District
- Neoga CUSD 3
- NCES district ID
- 1727840
- Math proficiency
- 15% ▼ -7.00%
- Reading proficiency
- 23% ▼ -10.00%
- Median HH income
- $46,396
- Composite
- 16.71/100
- National rank
- #9166
- State rank
- #442 of 620 in IL
Livability — Neoga
- Score
- 73/100
- State rank
- #282
- US rank
- #5432
Category grades
Schools grade is shown separately in the Schools card above.
Census & demographics
- City population
- 3,195
- Population (ZIP)
- 782
Population outlook (Coles County) Hauer SSP2
- Today (2025)
- 53,967 people
- By 2030
- 53,829 · -0.3%
- By 2040
- 52,332 · -3.0%
- By 2050
- 49,989 · -7.4%
- By 2075
- 42,226 · -21.8%
- By 2100
- 34,675 · -35.7%
Race, ethnicity, and origin ACS 2023
- Neighborhood character
- Predominantly White (95%)
- Race & ethnicity
- White 95% Hispanic / Latino 4% Two or more races 1%
- Common ancestry
- Lithuanian 3% Romanian 3% Slovak 2%
- Languages at home
- 98% English-only · Spanish 2%
Political lean MEDSL · Coles
- 2024 margin
- Strong R (+28.5) · D 34.9% · R 63.4% · Other 1.7%
- 2008→2024 swing
- -31.7pp toward R · 2008: 3.2pp · 2024: -28.5pp
- All cycles
- 2024: R+28.5 2020: R+26.4 2016: R+26.4 2012: R+11.1 2008: D+3.2
Not yet ingested
- Civics
- —
Market trends
- HPI YoY
- ▲ 4.15%
- Current HPI
- 154.9398
- Rent YoY
- —
- Metro
- —
- State GDP YoY
- ▲ 1.59%
- F500 in state
- 60
Industry mix (Fortune 500 HQ in IL)
| Industry | F500 HQs | Revenue |
|---|---|---|
| Insurance | 4 | $201B |
|
||
| Consumer Goods | 4 | $87B |
|
||
| Industrial Machinery | 3 | $64B |
|
||
| Healthcare | 2 | $55B |
|
||
| Retail / Pharmacy | 1 | $148B |
|
||
| Agriculture / Food | 1 | $86B |
|
||
Price history
1 event — show timeline
- 2026-02-19 Listed $28,900 CIBR
Cash-flow waterfall
monthlySold comps — $/sqft
last 12 mo · ≤1 miLoading sold comps…