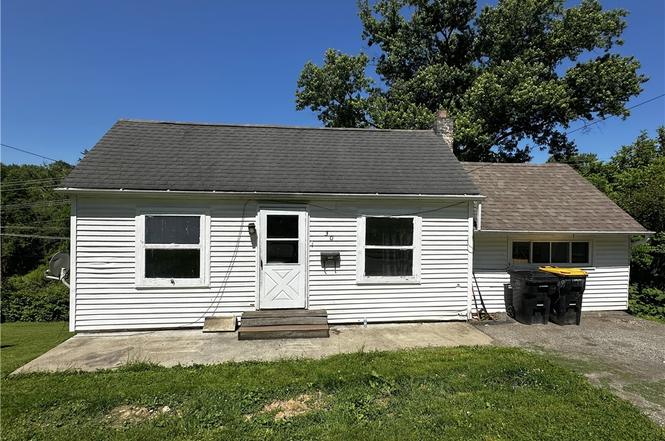
3036 Bethel Church Rd · Bethel Park, PA
Flood risk 1/10 · Minimal
- FEMA flood zone
- X (unshaded)
- Chance of flooding over 30 yrs
- 0.0%
- Est. flood insurance / yr
- $473 – $860
Fire risk 1/10 · Minimal
- Est. fire insurance / yr
- $511 – $949
Heat risk 3/10 · Minor
- Hot days now (above 96°F)
- 7 days/yr
- Hot days in 30 yrs
- 17 days/yr
Wind risk 2/10 · Minimal
- Chance of severe wind over 30 yrs
- —
Air-quality risk 2/10 · Minimal
- Unhealthy air days now
- 1 days/yr
- Unhealthy air days in 30 yrs
- 2 days/yr
Risk factors via First Street. Map © Google.
Why this score? — see what drove the B grade
The composite is a weighted blend of 9 inputs, each scored 0–100. Each bar is that input's sub-score; the figure is the points it added to the 100-point composite (weight × sub-score).
- Cash flow +30.0/30.0
- 1% rule +10.0/10.0
- DSCR +10.0/10.0
- ARV discount +7.5/15.0
- Schools +5.6/10.0
- Livability +4.2/5.0
- Rent growth +3.9/5.0
- Condition / age +2.5/5.0
- Appreciation +0.0/10.0
$50,000
🖨 Deal sheet 📄 Offer letter ✓ Due diligence
Listing remarks
Opportunity awaits in a prime location just minutes from South Hills Village and public transit. This one-level home is ready for a complete renovation and offers tremendous potential for investors, flippers, or buyers looking to create their dream home. The main level provides an easy-living layout, while the lower level presents the possibility for additional living space. With flexible living spaces and endless possibilities for customization, this property is a rare chance to add value in a highly desirable South Hills location. An added bonus: the neighboring multi-unit property is also available for purchase, creating a unique package-sale opportunity for investors with a larger visio
Key facts
- Complete renovation
- Multi-unit property
- 8,820 sq ft lot
Tags
Property features AI
Exterior
- Parking: Off-street parking for 2 vehicles
- Utilities: Public water; Public sewer
- Home design: One-story residence; Resale property; Basement entry level: lower (walk-out access)
- Construction: Basement foundation
- Exterior features: 126 x 68 lot dimensions
Interior
- Kitchen: Kitchen on main level (11 x 10)
- Bedrooms: Bedroom on main level (10 x 13)
- Flooring: Carpet; Vinyl
- Bathrooms: 1 full bathroom
- Heating & cooling: Gas heating; Heat pump
- Interior features: Finished basement with walk-out access; 6 total rooms
- Laundry & utility: Lower-level laundry room (13 x 5)
Neighborhood map
What this means for you Summary
Snapshot
- This is a 2-bed/1.0-bath single-family listed at $50k.
Deal economics
- At list price, monthly cash flow is $704 ($8k/yr) — positive.
- The deal already cash-flows at list — no discount required.
- Meets the 1% rule at list price ($1k rent vs $50k).
- Cap rate 23.2% vs local median 3.1% in Bethel Park — top-decile yield for the area; either an underpriced asset or a hidden risk that comps aren't pricing in. Stress-test before assuming the spread holds.
Location & tenants
- Location reads 85/100 on livability (#70 in PA, #483 nationally) — a professional / high-income tenant draw. Strengths: schools A+, crime A+, employment A+; Watch: amenities C-, commute F.
- Bethel Park SD (suburban): math 52% / reading 76% proficiency, ranked #50 of 539 in PA (top 9%) — acceptable for families but not a draw, mixed tenant base, ~2y average lease; only 11% free/reduced lunch — higher-income household profile.
- Market conditions: Rents rising fast (+5.4%/yr); 91 active listings in the ZIP; 9 comparable units currently listed for rent nearby; rentals at typical pace (median 22d on market — plan ~3-4 weeks tenant-placement turnaround); 44% of comp listings sitting > 30 days — soft ceiling on asking rent; solid renter incomes; 2,996 units permitted in Allegheny County in 2024 (1,588 in 5+ unit buildings).
- This rent is only 16% of the median local income ($109k/yr) — well below the 30% rent-burden line; pricing power to push rent on renewal without tenant pushback.
Forward outlook
- Local home prices are declining (-3.0%/yr); year-one equity from $346 of loan paydown is wiped out by about $2k of value loss. Plan a longer hold.
- At projected returns (-3.0% appreciation + 5.4% rent growth), your $14k cash investment doubles in ~2 years — after that, you're playing with house money.
Negotiation context
- Only 1 days on market — expect competitive offers; lowballing is unlikely to land.
- 4 sale attempts since 11y ago with the ask held roughly flat each time — persistent listings suggest the price (not the market) is what's stuck; bring a comps-based counter.
Risks & watch-outs
- Watch-outs: property tax is 3.7% of price; built in 1940 — expect roof / HVAC / electrical / plumbing capex.
Questions for the listing agent
- Built in 1940 — when were the roof, HVAC, electrical panel, plumbing, and water heater last replaced?
- Property tax is high relative to price — has the assessment been appealed recently, and will the sale trigger a re-assessment?
- Is there a deadline driving the sale (1031 exchange, divorce, estate, relocation)? That informs how much negotiation room exists.
- Schools are A-rated — typically a magnet for longer-tenancy family renters. What's the average tenant stay here, and is there a school-zone premium baked into asking?
- What's the average days-on-market for RENTAL listings here right now (not sales)? A rising rental-DOM trend means longer vacancies and softer asking-rent achievability than the comps imply.
- What's the recent tenant-quality profile in this submarket — average credit score on applications, eviction rate, late-payment / NSF rate, and stable-employment percentage? A property-management company in the area should have these aggregated.
- How much new for-sale + rental construction is in the pipeline within 1–3 miles? Heavy new supply typically softens prices + rents 12–24 months out; constrained supply supports both.
Investment metrics
- 1% rule
- 2.89% ✓
- Cap rate
- 23.18%
- Cash-on-cash
- 60.30%
- DSCR
- 3.68
- GRM
- 2.9
CMA / ARV
- ARV (on-the-fly)
- $234,300
- Comps found
- 2
Show comp detail 2 sales within ~0.75 mi
| Address | Dist | Beds/Ba | Sqft | Sold | Price | $/sf | Match |
|---|---|---|---|---|---|---|---|
| 16 Sioux Rd | 0.08mi | 3/1.5 (+1) | 963 (+13%) | 11mo | $265,000 | $275 | 59 |
| 2910 Bethel Church Rd | 0.45mi | 2/2.0 | 925 (+9%) | 24mo | $205,000 | $222 | 41 |
Match score weights: distance 35% · size 25% · config 20% · recency 20%. Top-matched comps best support the ARV.
Projected returns pro-forma
-3.0% appreciation · 5.44% rent growth · sell at horizon
- IRR
- 62.1%
- Equity multiple
- 3.89×
- Total profit
- $40,413
- Equity at exit
- $7,455
- IRR
- 67.6%
- Equity multiple
- 8.78×
- Total profit
- $108,864
- Equity at exit
- $4,323
Cash invested: $14,000 (down + closing). Projections, not guarantees.
Landlord ↔ Tenant lean methodology
- Overall (STATE)
- 62 Landlord-Friendly
- State Pennsylvania
- 62 Landlord-Friendly · EVEN
- County
- — inherits STATE
- City
- — inherits STATE
ZIP-level market 15102
- Rents YoY
- 5.4%
- Active inventory
- 91
- Price-to-rent
- 2.9×
Monthly cashflow live
- Estimated rent
- $1,443 high interval (Pro) →
- Mortgage (P&I)
- −$262
- Tax from tax record
- −$154 /mo · $1,845/yr
- Insurance
- −$21
- HOA
- −$0
- Vacancy / Maint / Mgmt
- −$303
- Net cashflow
- $704
Break-even live
UW: 25.0% down · 7.5% · 30yr · 1.5% tax · 5.0% vac · 8.0% maint · 8.0% mgmt
Financing live
Cash to close
- Down payment
- $12,500
- Closing costs
- $1,500
- Reserves months
- —
- Total cash needed
- —
Loan-product check · same deal, 3 products live
Conventional
25% down · 7.5% · 30yr
- Down + closing
- —
- Monthly P&I
- —
- Monthly cashflow
- —
- DSCR
- —
- Eligible?
- —
Personal DTI + credit; lowest rate.
DSCR
20% down · 8.5% · 30yr
- Down + closing
- —
- Monthly P&I
- —
- Monthly cashflow
- —
- DSCR
- —
- Eligible?
- —
No personal income docs; deal must DSCR.
Hard money
10% down · 12.0% · 12mo
- Down + closing
- —
- Monthly P&I
- —
- Monthly cashflow
- —
- DSCR
- —
- Eligible?
- —
Short-term bridge; refi at stabilization.
Rent comps 9 comps
| Address | Beds | Baths | Sqft | Rent | $/sqft | DOM | Units | Dist |
|---|---|---|---|---|---|---|---|---|
| 5 Dorchester Dr Pittsburgh, PA | 1.0–2.0 | 1.0–1.5 | 837 | $1,652 | $1.97 | 2d | 46 | 0.44mi |
| 3 Dorchester Dr Unit 301 Bethel Park, PA | 1.0 | 1.0 | 660 | $1,149 | $1.74 | 21d | 1 | 0.46mi |
| 7 Dorchester Dr Unit 7-611 Pittsburgh, PA | 1.0 | 1.0 | 660 | $1,277 | $1.93 | 44d | 1 | 0.47mi |
| 2898 Maple St Bethel Park, PA | 2.0 | 1.0 | 1124 | $1,629 | $1.45 | 20d | 1 | 0.88mi |
| 5388 Main St Unit 11 Bethel Park, PA | 1.0 | 1.0 | 600 | $1,049 | $1.75 | 44d | 1 | 0.98mi |
| 5398 Main St Bethel Park, PA | 1.0 | 1.0 | 600 | $1,049 | $1.75 | 44d | 1 | 0.98mi |
| 5398 Main St Unit 11 Bethel Park, PA | 1.0 | 1.0 | 600 | $1,049 | $1.75 | 44d | 1 | 0.99mi |
| 35 Highland Rd Bethel Park, PA | 1.0–2.0 | 1.0–2.0 | 831 | $2,170 | $2.61 | 2d | 24 | 1.11mi |
| 435 Abbeyville Rd Pittsburgh, PA | 1.0–2.0 | 1.0–1.5 | 880 | $1,595 | $1.81 | 2d | 10 | 1.26mi |
Listing history 2 events
-
2026-06-17remarks 699-char remark
-
2026-06-17$50,000 Active 1 DOM
ⓘ Source: listings_history table (triggers on properties + properties_extension) + one-shot
backfill from property_details.listing_events for pre-trigger history.
Tax reassessment forecast PA · Partial reset (capped growth)
- Current annual tax
- $1,845 · $154/mo
- Projected year-2 tax
- $1,845 · $154/mo
- Expected delta
- $0/yr ($0/mo · 0.0%)
ⓘ Screening estimate from a state-policy table — verify with the county assessor before closing.
Climate risk First Street
- Flood 1/10 Low FEMA zone X (unshaded) · 0% chance over 30 yrs
- Wildfire 1/10 Low
- Heat 3/10 Moderate 7 d/yr ≥96°F today · 17 d/yr by 30 yrs out
- Wind 2/10 Low
- Air quality 2/10 Low 1 unhealthy d/yr today · 2 by 30 yrs out
Nearby sold comps map
Loading sold comps map…
Walkable amenities ~0.75 mi
Loading nearby amenities…
Taxation est. · year 1
- Rental income
- $17,321
- − Mortgage interest
- −$2,801
- − Property taxes
- −$1,845
- − Insurance
- −$250
- − Repairs & maintenance
- −$1,386
- − Management
- −$1,386
- − Depreciation
- −$1,455
- Taxable income
- $8,199
- Est. tax owed @ 24.0%
- −$1,968
- After-tax cash flow
- $6,474/yr
For passive investors: Depreciation is non-cash, so a rental often shows a tax loss while cash-flowing — sheltering income. Rental losses are passive: they offset passive income freely, and up to $25,000/yr can offset ordinary (W-2) income if you actively participate and your MAGI is under $100k (phasing out to $0 by $150k); unused losses carry forward. On sale, claimed depreciation is recaptured at up to 25%, and gains may owe capital-gains tax (a 1031 exchange can defer both). Figures are a year-1 estimate at your 24.0% rate — not tax advice; consult a CPA.
Schools (NCES district)
- District
- Bethel Park SD
- NCES district ID
- 4203510
- Math proficiency
- 52% ▼ -16.00%
- Reading proficiency
- 76% ▼ -8.00%
- Median HH income
- $67,758
- Composite
- 56.0/100
- National rank
- #1194
- State rank
- #50 of 539 in PA
Livability — Bethel Park
- Score
- 85/100
- State rank
- #70
- US rank
- #483
Category grades
Schools grade is shown separately in the Schools card above.
Census & demographics
- Census place
- Bethel Park, PA
- County
- Allegheny County · 1,022,028 people
- City population
- 30,344
- Metro
- Pittsburgh, PA
- Population (ZIP)
- 30,344
- Household income
- $108,966
- Rent vs Own
- Severe rent burden
- 581.0
Population outlook (Allegheny County) Hauer SSP2
- Today (2025)
- 1,250,282 people
- By 2030
- 1,256,482 · +0.5%
- By 2040
- 1,256,318 · +0.5%
- By 2050
- 1,244,169 · -0.5%
- By 2075
- 1,197,693 · -4.2%
- By 2100
- 1,093,187 · -12.6%
Race, ethnicity, and origin ACS 2023
- Neighborhood character
- Predominantly White (93%)
- Race & ethnicity
- White 93% Two or more races 3% Asian 2% Black 1%
- Common ancestry
- Romanian 13% Lithuanian 2% Slovak 2%
- Foreign-born
- 4% · Canada
- Languages at home
- 95% English-only · Other Indo-European 2% Arabic 1% Spanish 1%
Political lean MEDSL · Allegheny
- 2024 margin
- Strong D (+20.3) · D 59.7% · R 39.4%
- 2008→2024 swing
- +4.8pp toward D · 2008: 15.5pp · 2024: 20.3pp
- All cycles
- 2024: D+20.3 2020: D+20.4 2016: D+16.4 2012: D+14.4 2008: D+15.5
Not yet ingested
- Civics
- —
Market trends
- HPI YoY
- ▼ -227.97%
- Current HPI
- 256.7682
- Rent YoY
- ▲ 5.44%
- Metro
- Pittsburgh, PA
- State GDP YoY
- ▲ 1.68%
- F500 in state
- 34
Industry mix (Fortune 500 HQ in PA)
| Industry | F500 HQs | Revenue |
|---|---|---|
| Healthcare | 2 | $309B |
|
||
| Insurance | 2 | $27B |
|
||
| Telecommunications / Media | 1 | $124B |
|
||
| Industrial Distribution | 1 | $22B |
|
||
| Financial Services | 1 | $20B |
|
||
| Chemicals / Materials | 1 | $18B |
|
||
Price history
+212.5% since first listed13 events — show timeline
- 2026-06-17 Listed $50,000 West Penn MLS
- 2020-01-31 Sold (Public Records) $435,000 Public Records
- 2017-02-13 Sold (Public Records) $45,000 Public Records
- 2017-02-10 Price Changed $45,000 West Penn MLS
- 2017-02-10 Price Changed $98,000 West Penn MLS
- 2017-02-10 Sold (MLS) $45,000 West Penn MLS
- 2017-01-08 Contingent — West Penn MLS
- 2016-08-13 Delisted — West Penn MLS
- 2016-08-12 Listed $98,000 West Penn MLS
- 2015-08-14 Delisted — West Penn MLS
- 2015-08-14 Listed $98,000 West Penn MLS
- 2015-04-10 Listed $98,000 West Penn MLS
- 1975-12-17 Sold (Public Records) $16,000 Public Records
Property tax history
+2.3%/yrLatest (2026): $1,845 · +5.1% YoY. Source: county tax records.
Cash-flow waterfall
monthlySold comps — $/sqft
last 12 mo · ≤1 miLoading sold comps…