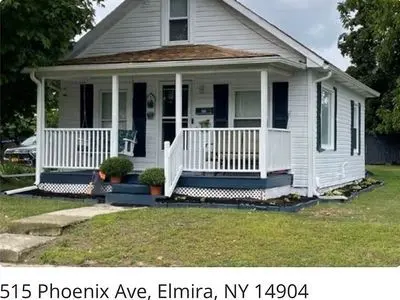
515 Phoenix Avenue Ave · Southport, NY
Flood risk 4/10 · Minor
- FEMA flood zone
- X
- Chance of flooding over 30 yrs
- 0.24%
- Est. flood insurance / yr
- $473 – $860
Fire risk 1/10 · Minimal
- Est. fire insurance / yr
- $691 – $1,283
Heat risk 3/10 · Minor
- Hot days now (above 96°F)
- 7 days/yr
- Hot days in 30 yrs
- 16 days/yr
Wind risk 2/10 · Minimal
- Chance of severe wind over 30 yrs
- 1.0%
Air-quality risk 1/10 · Minimal
- Unhealthy air days now
- 0 days/yr
- Unhealthy air days in 30 yrs
- 0 days/yr
Risk factors via First Street. Map © Google.
Why this score? — see what drove the D- grade
The composite is a weighted blend of 9 inputs, each scored 0–100. Each bar is that input's sub-score; the figure is the points it added to the 100-point composite (weight × sub-score).
- Cash flow +12.3/30.0
- ARV discount +7.5/15.0
- DSCR +3.7/10.0
- 1% rule +3.3/10.0
- Livability +3.2/5.0
- Rent growth +2.5/5.0
- Condition / age +2.5/5.0
- Schools +2.4/10.0
- Appreciation +0.0/10.0
$134,900
🖨 Deal sheet (PDF) 📄 Offer letter ✓ Due diligence
Listing remarks MLS
Cute and tidy 2 bedroom in a great Southport neighborhood-Large fenced yard-new carpet-bathroom is 100% NEW right down to drywall-great opportunity for a starter home or investment property. New windows and front porch, vinyl siding and all appliances-Move right in.
Key facts
- Open living room
- Modern kitchen
- Breakfast bar
Tags
Property features AI
Exterior
- Parking: Detached garage with electricity and workshop; 1 garage space
- Utilities: Public water connected; Septic tank sewer; Electric service with circuit breakers
- Home design: 2-story existing home
- Construction: Vinyl siding; PEX plumbing; Block foundation
- Exterior features: Blacktop driveway; Rectangular residential lot; City street frontage; Lot dimensions approximately 80 x 120
Interior
- Kitchen: Dishwasher; Electric oven; Electric range; Microwave
- Bedrooms: 1 main-level bedroom
- Flooring: Carpet; Varies
- Bathrooms: 1 full bathroom (main level)
- Heating & cooling: Gas forced-air heating
- Interior features: Ceiling fan(s); Eat-in kitchen; Bedroom on main level; Full basement
- Laundry & utility: Gas water heater
Neighborhood map
What this means for you Summary
Snapshot
- This is a 2-bed/1.0-bath single-family listed at $135k.
Deal economics
- At list price, monthly cash flow is $-25 ($-297/yr) — negative.
- To cash-flow at today's rent, offer at most $131k (3.2% below list).
- To meet the 1% rule (rent ≥ 1% of price), the offer needs to be $111k (17.4% below list).
- Recommended offer: $111k (17.4% below list) — sets the bar for 1% rule.
Location & tenants
- Location reads 65/100 on livability (#690 in NY) — a middle-class / working-renter tenant base. Strengths: cost of living A+, housing A; Watch: employment D, health & safety D, crime D-.
- Elmira City School District (urban): math 23% / reading 35% proficiency, ranked #580 of 590 in NY (top 98%) — low school quality limits family demand, transient renter base, plan for 1-2y turnover.
- Zoned schools: Ernie Davis Academy (math 5% / reading 31%, grade F, #691 of 729 statewide, top 95%, 802 students, 66% FRL).
- Market conditions: 104 active listings in the ZIP; 91 units permitted in Chemung County in 2024 (63 in 5+ unit buildings).
Forward outlook
- Local home prices are declining (-3.0%/yr); year-one equity from $933 of loan paydown is wiped out by about $4k of value loss. Plan a longer hold.
- Chemung County population projected at -17% by 2050 — secular population decline; favor cash flow + early exit over multi-decade hold.
Negotiation context
- It's been on market 21 days — a 2% lower offer ($133k) is reasonable based on typical stale-listing flexibility.
- 5 sale attempts since 17y ago with the ask held roughly flat each time — persistent listings suggest the price (not the market) is what's stuck; bring a comps-based counter.
- Current owner paid $32k; list at $135k implies a 328% gain — meaningful room to come down on a strong offer.
Risks & watch-outs
- Watch-outs: built in 1946 — expect roof / HVAC / electrical / plumbing capex.
Questions for the listing agent
- What do current leases actually rent for vs. the listed asking? Can we see a recent rent roll and the last 12 months of T-12 income?
- Built in 1946 — when were the roof, HVAC, electrical panel, plumbing, and water heater last replaced?
- Is there a deadline driving the sale (1031 exchange, divorce, estate, relocation)? That informs how much negotiation room exists.
- Schools are D-rated, which usually means shorter tenancies and higher turnover. Who's the typical renter profile here, and what's been the actual vacancy rate?
- Crime grade is D in this area — have there been break-ins, vandalism, or insurance claims at this property in the last 3 years? What carrier currently insures it and at what premium?
- The area grade is low — what's the realistic commute time and amenity access for the typical tenant pool here? Any planned neighborhood developments (good or bad) we should know about?
- What's the average days-on-market for RENTAL listings here right now (not sales)? A rising rental-DOM trend means longer vacancies and softer asking-rent achievability than the comps imply.
- What's the recent tenant-quality profile in this submarket — average credit score on applications, eviction rate, late-payment / NSF rate, and stable-employment percentage? A property-management company in the area should have these aggregated.
- How much new for-sale + rental construction is in the pipeline within 1–3 miles? Heavy new supply typically softens prices + rents 12–24 months out; constrained supply supports both.
Investment metrics
- 1% rule
- 0.83% ✗
- Cap rate
- 6.07%
- Cash-on-cash
- -0.79%
- DSCR
- 0.97
- GRM
- 10.1
CMA / ARV
No comps found within radius.
Projected returns pro-forma
-3.0% appreciation · 3.0% rent growth · sell at horizon
- IRR
- -17.6%
- Equity multiple
- 0.38×
- Total profit
- $-23,434
- Equity at exit
- $20,114
- IRR
- -9.7%
- Equity multiple
- 0.41×
- Total profit
- $-22,433
- Equity at exit
- $11,664
Cash invested: $37,772 (down + closing). Projections, not guarantees.
Landlord ↔ Tenant lean methodology
- Overall (STATE)
- 15 Strongly Tenant-Friendly
- State New York
- 15 Strongly Tenant-Friendly · D+10
- County
- — inherits STATE
- City
- — inherits STATE
ZIP-level market 14904
- Home prices YoY
- -9.6%
- Active inventory
- 104
- Price-to-rent
- 10.1×
Monthly cashflow live
- Estimated rent
- $1,114 medium interval (Pro) →
- Mortgage (P&I)
- −$707
- Tax from tax record
- −$141 /mo · $1,696/yr
- Insurance
- −$56
- HOA
- −$0
- Vacancy / Maint / Mgmt
- −$234
- Net cashflow
- $-25
Break-even live
Sensitivity live
| Price | -10% $52 | -5% $13 | +0% $-25 | +5% $-63 | +10% $-101 |
|---|---|---|---|---|---|
| Rent | -10% $-113 | -5% $-69 | +0% $-25 | +5% $19 | +10% $63 |
| Rate | -1.0pp $43 | -0.5pp $10 | base $-25 | +0.5pp $-60 | +1.0pp $-95 |
UW: 25.0% down · 7.5% · 30yr · 1.5% tax · 5.0% vac · 8.0% maint · 8.0% mgmt
Financing live
Cash to close
- Down payment
- $33,725
- Closing costs
- $4,047
- Reserves months
- —
- Total cash needed
- —
Loan-product check · same deal, 3 products live
Conventional
25% down · 7.5% · 30yr
- Down + closing
- —
- Monthly P&I
- —
- Monthly cashflow
- —
- DSCR
- —
- Eligible?
- —
Personal DTI + credit; lowest rate.
DSCR
20% down · 8.5% · 30yr
- Down + closing
- —
- Monthly P&I
- —
- Monthly cashflow
- —
- DSCR
- —
- Eligible?
- —
No personal income docs; deal must DSCR.
Hard money
10% down · 12.0% · 12mo
- Down + closing
- —
- Monthly P&I
- —
- Monthly cashflow
- —
- DSCR
- —
- Eligible?
- —
Short-term bridge; refi at stabilization.
Listing history 29 events
-
2026-06-22days on market $134,900 Active 21 DOM
-
2026-06-21days on market $134,900 Active 20 DOM
-
2026-06-19days on market $134,900 Active 18 DOM
-
2026-06-18days on market $134,900 Active 17 DOM
-
2026-06-17days on market $134,900 Active 16 DOM
-
2026-06-16days on market $134,900 Active 15 DOM
-
2026-06-15days on market $134,900 Active 14 DOM
-
2026-06-14days on market $134,900 Active 12 DOM
-
2026-06-12days on market $134,900 Active 11 DOM
-
2026-06-09days on market $134,900 Active 8 DOM
-
2026-06-08days on market $134,900 Active 7 DOM
-
2026-06-07days on market $134,900 Active 6 DOM
-
2026-06-05days on market $134,900 Active 3 DOM
-
2026-06-03days on market $134,900 Active 2 DOM
-
2026-06-02remarks 673-char remark
-
2026-06-02pricedays on market $134,900 Active 1 DOM
-
2026-06-01days on market $139,999 Active 10 DOM
-
2026-05-31days on market $139,999 Active 9 DOM
-
2026-05-30days on market $139,999 Active 8 DOM
-
2026-05-23$139,999 Active
Show marketing remark (266 chars)
Cute and tidy 2 bedroom in a great Southport neighborhood-Large fenced yard-new carpet-bathroom is 100% NEW right down to drywall-great opportunity for a starter home or investment property. New windows and front porch, vinyl siding and all appliances-Move right in.
-
2025-10-03historical
-
2025-09-16status Pending
-
2025-09-07$119,000 Active
-
2012-01-12soldstatus $31,500 266-char remark
-
2012-01-12soldstatus $31,500
-
2011-10-06$39,000 266-char remark
-
2010-07-11historical
-
2009-07-09$39,000
-
2000-01-10soldstatus $23,970
ⓘ Source: listings_history table (triggers on properties + properties_extension) + one-shot
backfill from property_details.listing_events for pre-trigger history.
Tax reassessment forecast NY · Partial reset (capped growth)
- Current annual tax
- $1,696 · $141/mo
- Projected year-2 tax
- $1,988 · $166/mo
- Expected delta
- +$292/yr (+$24/mo · 17.2%)
ⓘ Screening estimate from a state-policy table — verify with the county assessor before closing.
Climate risk First Street
- Flood 4/10 Moderate FEMA zone X · 24% chance over 30 yrs
- Wildfire 1/10 Low
- Heat 3/10 Moderate 7 d/yr ≥96°F today · 16 d/yr by 30 yrs out
- Wind 2/10 Low 100% chance of damaging wind over 30 yrs
- Air quality 1/10 Low 0 unhealthy d/yr today · 0 by 30 yrs out
Nearby sold comps map
Loading sold comps map…
Walkable amenities ~0.75 mi
Loading nearby amenities…
Taxation est. · year 1
- Rental income
- $13,371
- − Mortgage interest
- −$7,556
- − Property taxes
- −$1,696
- − Insurance
- −$674
- − Repairs & maintenance
- −$1,070
- − Management
- −$1,070
- − Depreciation
- −$3,924
- Taxable loss
- −$2,620
- Est. tax savings @ 24.0%
- +$629
- After-tax cash flow
- $332/yr
For passive investors: Depreciation is non-cash, so a rental often shows a tax loss while cash-flowing — sheltering income. Rental losses are passive: they offset passive income freely, and up to $25,000/yr can offset ordinary (W-2) income if you actively participate and your MAGI is under $100k (phasing out to $0 by $150k); unused losses carry forward. On sale, claimed depreciation is recaptured at up to 25%, and gains may owe capital-gains tax (a 1031 exchange can defer both). Figures are a year-1 estimate at your 24.0% rate — not tax advice; consult a CPA.
Schools (NCES district)
- District
- Elmira City School District
- NCES district ID
- 3610560
- Math proficiency
- 23% ▼ -7.00%
- Reading proficiency
- 35% ▲ 7.00%
- Median HH income
- $40,180
- Composite
- 24.39/100
- National rank
- #7688
- State rank
- #580 of 590 in NY
Livability — Southport
- Score
- 65/100
- State rank
- #690
- US rank
- #13026
Category grades
Schools grade is shown separately in the Schools card above.
Census & demographics
- Census place
- Southport, NY
- Population (ZIP)
- 14,276
Population outlook (Chemung County) Hauer SSP2
- Today (2025)
- 82,931 people
- By 2030
- 80,356 · -3.1%
- By 2040
- 74,745 · -9.9%
- By 2050
- 69,012 · -16.8%
- By 2075
- 55,689 · -32.8%
- By 2100
- 41,428 · -50.0%
Race, ethnicity, and origin ACS 2023
- Neighborhood character
- Predominantly White (83%)
- Race & ethnicity
- White 83% Two or more races 7% Black 7% Hispanic / Latino 5% Native American 1%
- Common ancestry
- Romanian 7% Lithuanian 3% Slovak 2%
- Foreign-born
- 2% · Canada, Jamaica, Dominican Republic
- Languages at home
- 97% English-only · Spanish 2%
Political lean MEDSL · Chemung
- 2024 margin
- R (+16.8) · D 41.6% · R 58.4%
- 2008→2024 swing
- -15.6pp toward R · 2008: -1.2pp · 2024: -16.8pp
- All cycles
- 2024: R+16.8 2020: R+13.4 2016: R+20.0 2012: R+2.9 2008: R+1.2
Not yet ingested
- Civics
- —
Market trends
- HPI YoY
- ▼ -23.33%
- Current HPI
- 220.688
- Rent YoY
- —
- Metro
- —
- State GDP YoY
- ▲ 2.60%
- F500 in state
- 92
Industry mix (Fortune 500 HQ in NY)
| Industry | F500 HQs | Revenue |
|---|---|---|
| Financial Services | 10 | $950B |
|
||
| Consumer Goods | 9 | $162B |
|
||
| Insurance | 4 | $225B |
|
||
| Telecommunications | 2 | $144B |
|
||
| Pharmaceuticals | 2 | $112B |
|
||
| Media / Entertainment | 2 | $69B |
|
||
Price history
+462.8% since first listed11 events — show timeline
- 2026-06-01 Listed $134,900 UNYREIS
- 2026-05-23 Listed $139,999 FSBO.com
- 2025-10-03 Listing Removed — UNYREIS
- 2025-09-16 Pending — UNYREIS
- 2025-09-07 Listed $119,000 UNYREIS
- 2012-01-12 Sold (Public Records) $31,500 Public Records
- 2012-01-12 Sold (MLS) $31,500 UNYREIS
- 2011-10-06 Listed $39,000 UNYREIS
- 2010-07-11 Listing Removed — UNYREIS
- 2009-07-09 Listed $39,000 UNYREIS
- 2000-01-10 Sold (Public Records) $23,970 Public Records
Property tax history
+3.3%/yrLatest (2025): $1,696 · -1.3% YoY. Source: county tax records.
Cash-flow waterfall
monthlySold comps — $/sqft
last 12 mo · ≤1 miLoading sold comps…