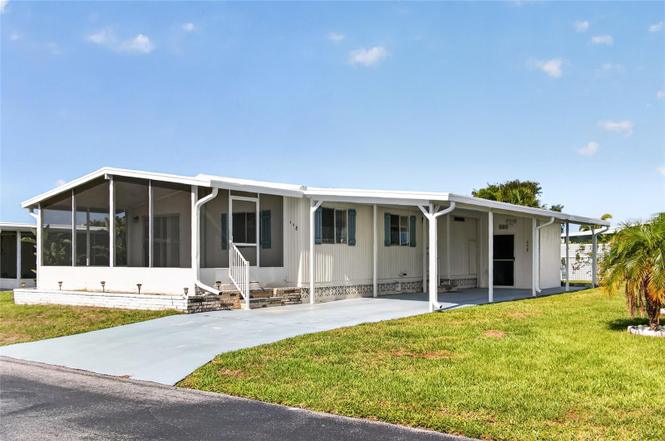
498 Longwood Dr · Venice Gardens, FL
Flood risk 2/10 · Minimal
- FEMA flood zone
- X (unshaded)
- Chance of flooding over 30 yrs
- 0.03%
- Est. flood insurance / yr
- $507 – $1,088
Fire risk 1/10 · Minimal
- Est. fire insurance / yr
- $947 – $1,759
Heat risk 10/10 · Severe
- Hot days now (above 107°F)
- 7 days/yr
- Hot days in 30 yrs
- 28 days/yr
Wind risk 10/10 · Severe
- Chance of severe wind over 30 yrs
- 99.0%
Air-quality risk 2/10 · Minimal
- Unhealthy air days now
- 1 days/yr
- Unhealthy air days in 30 yrs
- 1 days/yr
Risk factors via First Street. Map © Google.
Why this score? — see what drove the B grade
The composite is a weighted blend of 9 inputs, each scored 0–100. Each bar is that input's sub-score; the figure is the points it added to the 100-point composite (weight × sub-score).
- Cash flow +29.3/30.0
- DSCR +10.0/10.0
- 1% rule +8.8/10.0
- ARV discount +7.5/15.0
- Schools +5.4/10.0
- Rent growth +4.7/5.0
- Livability +3.4/5.0
- Condition / age +2.5/5.0
- Appreciation +0.0/10.0
$145,000
🖨 Deal sheet 📄 Offer letter ✓ Due diligence
Listing remarks MLS
Priced to sell! This two bedroom two bath home is ready for a new owner. The floors have all new laminate throughout. A membrane roof and a great 2019 air conditioner! Sandalwood is a wonderful community of only 239 homes. A beautiful pool, bocci, shuffleboard and a putting green.
Key facts
- Dog park
- Community pool
- Community park
Tags
Property features AI
Finance
- Other: Senior community; Pets allowed (cats and dogs); Community features: dog park, golf carts allowed, deed restrictions, buyer approval required, association recreation owned
- Financial info: Total annual fees listed as $2,128; Lease restrictions apply
- HOA & community: HOA present (monthly fee $177.33; quarterly association fee $532); Association requires approval; Association amenities: clubhouse, park, pool, shuffleboard court, recreational facilities; Association fee includes: cable TV, common area taxes, pool, escrow reserves, grounds maintenance, management, private road
Exterior
- Parking: Covered driveway parking; Carport (1 space); Golf cart parking
- Utilities: Public water; Public sewer; Electricity connected/available; Cable available; Water connected
- Home design: Manufactured home (double wide); Single-story; East-facing entry
- Construction: Vinyl siding; Other roof; Pillar/post/pier foundation; Completed condition
- Exterior features: Covered, enclosed, screened patio/porch; Patio; Storage shed(s)
Interior
- Kitchen: Dishwasher; Disposal; Microwave; Range; Refrigerator; Electric water heater
- Bedrooms: 2 bedrooms
- Flooring: Laminate flooring
- Bathrooms: 2 full bathrooms
- Heating & cooling: Heat pump heating; Central air conditioning
- Interior features: Ceiling fans; Eat-in kitchen; Living room/dining room combo; Thermostat; Window treatments (blinds)
- Laundry & utility: Outdoor laundry
Neighborhood map
What this means for you Summary
Snapshot
- This is a 2-bed/2.0-bath manufactured listed at $145k.
Deal economics
- At list price, monthly cash flow is $508 ($6k/yr) — positive.
- The deal already cash-flows at list — no discount required.
- Meets the 1% rule at list price ($2k rent vs $145k).
Location & tenants
- Location reads 68/100 on livability (#537 in FL) — a middle-class / working-renter tenant base. Strengths: crime A+, housing A+, health & safety A-; Watch: amenities F, commute F.
- Sarasota (urban): math 63% / reading 63% proficiency, ranked #7 of 73 in FL (top 10%) — acceptable for families but not a draw, mixed tenant base, ~2y average lease.
- Zoned schools: Garden Elementary School (math 71% / reading 69%, grade A-, #345 of 2,144 statewide, top 17%, 513 students, 52% FRL); Venice Senior High School (math 67% / reading 61%, grade B-, #86 of 667 statewide, top 13%, 2,584 students, 31% FRL) — zoned schools at 41% FRL track the district average.
- Market conditions: Rents rising fast (+8.8%/yr); 462 active listings in the ZIP; 7,466 units permitted in Sarasota County in 2024 (2,138 in 5+ unit buildings).
- This rent runs 35% of the median local income ($68k/yr) — at the standard rent-burdened threshold; future hikes will face affordability resistance.
Forward outlook
- Local home prices are declining (-3.0%/yr); year-one equity from $1k of loan paydown is wiped out by about $4k of value loss. Plan a longer hold.
- Sarasota County population projected at +20% by 2050 — long-run rental-demand tailwind backs the buy-and-hold thesis.
- At projected returns (-3.0% appreciation + 8.0% rent growth), your $41k cash investment doubles in ~6 years — after that, you're playing with house money.
Negotiation context
- Only 7 days on market — expect competitive offers; lowballing is unlikely to land.
- 4 sale attempts since 9y ago with the ask held roughly flat each time — persistent listings suggest the price (not the market) is what's stuck; bring a comps-based counter.
Risks & watch-outs
- Climate carrying-cost: severe wind risk, 99% chance of damaging wind over 30y; extreme-heat days projected 7→28/yr by 2055 (HVAC capex compounding) — expect insurance premiums to compound above CPI over the hold.
Questions for the listing agent
- What does the HOA fee cover, when was the last increase, and are there any pending special assessments or reserve-fund shortfalls?
- Is there a deadline driving the sale (1031 exchange, divorce, estate, relocation)? That informs how much negotiation room exists.
- Schools are D-rated, which usually means shorter tenancies and higher turnover. Who's the typical renter profile here, and what's been the actual vacancy rate?
- What's the average days-on-market for RENTAL listings here right now (not sales)? A rising rental-DOM trend means longer vacancies and softer asking-rent achievability than the comps imply.
- What's the recent tenant-quality profile in this submarket — average credit score on applications, eviction rate, late-payment / NSF rate, and stable-employment percentage? A property-management company in the area should have these aggregated.
- How much new for-sale + rental construction is in the pipeline within 1–3 miles? Heavy new supply typically softens prices + rents 12–24 months out; constrained supply supports both.
Investment metrics
- 1% rule
- 1.38% ✓
- Cap rate
- 10.49%
- Cash-on-cash
- 15.00%
- DSCR
- 1.67
- GRM
- 6.0
CMA / ARV
No comps found within radius.
Projected returns pro-forma
-3.0% appreciation · 8.0% rent growth · sell at horizon
- IRR
- 11.4%
- Equity multiple
- 1.48×
- Total profit
- $19,505
- Equity at exit
- $21,620
- IRR
- 24.3%
- Equity multiple
- 3.64×
- Total profit
- $107,160
- Equity at exit
- $12,537
Cash invested: $40,600 (down + closing). Projections, not guarantees.
Landlord ↔ Tenant lean methodology
- Overall (STATE)
- 87 Strongly Landlord-Friendly
- State Florida
- 87 Strongly Landlord-Friendly · R+3
- County
- — inherits STATE
- City
- — inherits STATE
ZIP-level market 34285
- Rents YoY
- 8.8%
- Active inventory
- 462
- Price-to-rent
- 6.0×
Monthly cashflow live
- Estimated rent
- $2,006 medium interval (Pro) →
- Mortgage (P&I)
- −$760
- Tax from tax record
- −$79 /mo · $949/yr
- Insurance
- −$60
- HOA
- −$177
- Vacancy / Maint / Mgmt
- −$421
- Net cashflow
- $508
Break-even live
UW: 25.0% down · 7.5% · 30yr · 1.5% tax · 5.0% vac · 8.0% maint · 8.0% mgmt
Financing live
Cash to close
- Down payment
- $36,250
- Closing costs
- $4,350
- Reserves months
- —
- Total cash needed
- —
Loan-product check · same deal, 3 products live
Conventional
25% down · 7.5% · 30yr
- Down + closing
- —
- Monthly P&I
- —
- Monthly cashflow
- —
- DSCR
- —
- Eligible?
- —
Personal DTI + credit; lowest rate.
DSCR
20% down · 8.5% · 30yr
- Down + closing
- —
- Monthly P&I
- —
- Monthly cashflow
- —
- DSCR
- —
- Eligible?
- —
No personal income docs; deal must DSCR.
Hard money
10% down · 12.0% · 12mo
- Down + closing
- —
- Monthly P&I
- —
- Monthly cashflow
- —
- DSCR
- —
- Eligible?
- —
Short-term bridge; refi at stabilization.
HOA detail
- Monthly dues
- $177 · $2,124/yr
- Likely covers
- pool
Listing history 7 events
-
2026-06-18days on market $145,000 Active 7 DOM
-
2026-06-17days on market $145,000 Active 6 DOM
-
2026-06-16days on market $145,000 Active 5 DOM
-
2026-06-15days on market $145,000 Active 4 DOM
-
2026-06-13days on market $145,000 Active 2 DOM
-
2026-06-13remarks 681-char remark
-
2026-06-13$145,000 Active 1 DOM
ⓘ Source: listings_history table (triggers on properties + properties_extension) + one-shot
backfill from property_details.listing_events for pre-trigger history.
Tax reassessment forecast FL · Resets to sale price
- Current annual tax
- $949 · $79/mo
- Projected year-2 tax
- $1,204 · $100/mo
- Expected delta
- +$255/yr (+$21/mo · 26.9%)
ⓘ Screening estimate from a state-policy table — verify with the county assessor before closing.
Climate risk First Street
- Flood 2/10 Low FEMA zone X (unshaded) · 3% chance over 30 yrs
- Wildfire 1/10 Low
- Heat 10/10 Extreme 7 d/yr ≥107°F today · 28 d/yr by 30 yrs out
- Wind 10/10 Extreme 99% chance of damaging wind over 30 yrs
- Air quality 2/10 Low 1 unhealthy d/yr today · 1 by 30 yrs out
Nearby sold comps map
Loading sold comps map…
Walkable amenities ~0.75 mi
Loading nearby amenities…
Taxation est. · year 1
- Rental income
- $24,067
- − Mortgage interest
- −$8,122
- − Property taxes
- −$949
- − Insurance
- −$725
- − Repairs & maintenance
- −$1,925
- − Management
- −$1,925
- − HOA
- −$2,124
- − Depreciation
- −$4,218
- Taxable income
- $4,078
- Est. tax owed @ 24.0%
- −$979
- After-tax cash flow
- $5,112/yr
For passive investors: Depreciation is non-cash, so a rental often shows a tax loss while cash-flowing — sheltering income. Rental losses are passive: they offset passive income freely, and up to $25,000/yr can offset ordinary (W-2) income if you actively participate and your MAGI is under $100k (phasing out to $0 by $150k); unused losses carry forward. On sale, claimed depreciation is recaptured at up to 25%, and gains may owe capital-gains tax (a 1031 exchange can defer both). Figures are a year-1 estimate at your 24.0% rate — not tax advice; consult a CPA.
Schools (NCES district)
- District
- Sarasota
- NCES district ID
- 1201680
- Math proficiency
- 63% ▼ -8.00%
- Reading proficiency
- 63% ▼ -3.00%
- Median HH income
- $51,167
- Composite
- 53.68/100
- National rank
- #1428
- State rank
- #7 of 73 in FL
Livability — Venice Gardens
- Score
- 68/100
- State rank
- #537
- US rank
- #10074
Category grades
Schools grade is shown separately in the Schools card above.
Census & demographics
- County
- Sarasota County · 448,376 people
- Metro
- North Port-Sarasota-Bradenton, FL
- Population (ZIP)
- 18,677
- Household income
- $68,301
- Rent vs Own
- Severe rent burden
- 747.0
Population outlook (Sarasota County) Hauer SSP2
- Today (2025)
- 452,380 people
- By 2030
- 474,175 · +4.8%
- By 2040
- 511,577 · +13.1%
- By 2050
- 541,467 · +19.7%
- By 2075
- 604,947 · +33.7%
- By 2100
- 621,965 · +37.5%
Race, ethnicity, and origin ACS 2023
- Neighborhood character
- Predominantly White (88%)
- Race & ethnicity
- White 88% Two or more races 6% Hispanic / Latino 6% Asian 1%
- Hispanic origin (detail)
- Mexican 1% Puerto Rican 2% Cuban 1%
- Common ancestry
- Romanian 5% Lithuanian 5% Italian 3%
- Foreign-born
- 11% · Canada
- Languages at home
- 88% English-only · Spanish 4% Other Indo-European 2% German/W. Germanic 2%
Political lean MEDSL · Sarasota
- 2024 margin
- R (+18.2) · D 40.5% · R 58.7%
- 2008→2024 swing
- -18.1pp toward R · 2008: -0.1pp · 2024: -18.2pp
- All cycles
- 2024: R+18.2 2020: R+10.4 2016: R+11.6 2012: R+7.4 2008: R+0.1
Not yet ingested
- Civics
- —
Market trends
- HPI YoY
- ▼ -329.42%
- Current HPI
- 264.6389
- Rent YoY
- ▲ 8.78%
- Metro
- North Port-Sarasota-Bradenton, FL
- State GDP YoY
- ▲ 3.28%
- F500 in state
- 36
Industry mix (Fortune 500 HQ in FL)
| Industry | F500 HQs | Revenue |
|---|---|---|
| Industrial Technology | 2 | $29B |
|
||
| Insurance | 2 | $17B |
|
||
| Retail | 1 | $60B |
|
||
| Technology Distribution | 1 | $58B |
|
||
| Homebuilding | 1 | $35B |
|
||
| Technology Manufacturing | 1 | $35B |
|
||
Price history
+52.6% since first listed11 events — show timeline
- 2026-06-11 Listed $145,000 Stellar MLS as Distributed by MLS Grid
- 2026-04-17 Listing Removed — Stellar MLS as Distributed by MLS Grid
- 2026-02-24 Price Changed $130,000 Stellar MLS as Distributed by MLS Grid
- 2026-02-08 Listed $145,000 Stellar MLS as Distributed by MLS Grid
- 2022-02-11 Sold (MLS) $140,000 Stellar MLS as Distributed by MLS Grid
- 2022-01-23 Pending — Stellar MLS as Distributed by MLS Grid
- 2022-01-13 Listed $156,500 Stellar MLS as Distributed by MLS Grid
- 2017-03-17 Sold (Public Records) $87,000 Public Records
- 2017-03-15 Sold (MLS) $87,000 Stellar MLS as Distributed by MLS Grid
- 2017-02-14 Pending — Stellar MLS as Distributed by MLS Grid
- 2017-02-12 Listed $95,000 Stellar MLS as Distributed by MLS Grid
Property tax history
-0.3%/yrLatest (2025): $949 · -47.4% YoY. Source: county tax records.
Cash-flow waterfall
monthlySold comps — $/sqft
last 12 mo · ≤1 miLoading sold comps…