42 Lake Forest Estate Rd · Tumbling Shoals, AR
Flood risk 1/10 · Minimal
- FEMA flood zone
- X (unshaded)
- Chance of flooding over 30 yrs
- 0.0%
- Est. flood insurance / yr
- $507 – $1,088
Fire risk 4/10 · Minor
- Est. fire insurance / yr
- $1,499 – $2,785
Heat risk 5/10 · Moderate
- Hot days now (above 108°F)
- 7 days/yr
- Hot days in 30 yrs
- 19 days/yr
Wind risk 3/10 · Minor
- Chance of severe wind over 30 yrs
- 6.0%
Air-quality risk 2/10 · Minimal
- Unhealthy air days now
- 0 days/yr
- Unhealthy air days in 30 yrs
- 1 days/yr
Risk factors via First Street. Map © Google.
Why this score? — see what drove the A- grade
The composite is a weighted blend of 9 inputs, each scored 0–100. Each bar is that input's sub-score; the figure is the points it added to the 100-point composite (weight × sub-score).
- Cash flow +28.3/30.0
- ARV discount +14.2/15.0
- DSCR +10.0/10.0
- Appreciation +10.0/10.0
- 1% rule +6.5/10.0
- Schools +4.1/10.0
- Livability +2.9/5.0
- Rent growth +2.5/5.0
- Condition / age +2.5/5.0
$85,000
🖨 Deal sheet 📄 Offer letter ✓ Due diligence
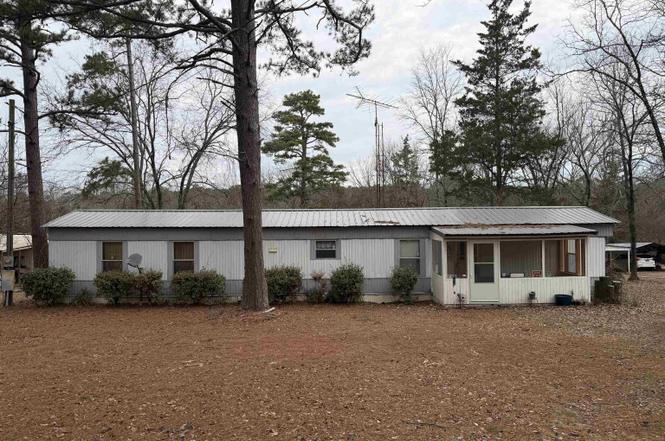
Listing remarks
Just one mile from the boat ramp at Greers Ferry Lake in Tumbling Shoals, this property offers the kind of setting buyers look for when they want a true lake-area retreat with room to breathe. Situated on approximately . 63 acres, the layout is practical and welcoming. From the enclosed front porch, you enter the living room, with the kitchen and dining combo positioned to the left. A bonus room off the kitchen provides flexible use, while the primary suite is located beyond the kitchen with a convenient laundry closet in between. To the right of the entry are the guest bathroom and second bedroom. The back door opens to a large covered deck overlooking the backyard—ideal for relaxing
Key facts
- Covered deck
- Lake area retreat
- New flooring
Tags
Neighborhood map
What this means for you Summary
Snapshot
- This is a 2-bed/1.0-bath manufactured listed at $85k.
Deal economics
- At list price, monthly cash flow is $272 ($3k/yr) — positive.
- The deal already cash-flows at list — no discount required.
- Meets the 1% rule at list price ($977 rent vs $85k).
- Recommended offer: $82k (3.0% below list) — sets the bar for market timing.
- Cap rate 10.1% vs local median 2.2% in Tumbling Shoals — top-decile yield for the area; either an underpriced asset or a hidden risk that comps aren't pricing in. Stress-test before assuming the spread holds.
Location & tenants
- Location reads 57/100 on livability (#347 in AR) — a working-class tenant base; expect higher turnover. Strengths: cost of living A+, crime A-; Watch: employment D, schools F, amenities F.
- Heber Springs School District (town): math 50% / reading 49% proficiency, ranked #19 of 238 in AR (top 8%) — families likely to look elsewhere, expect single-tenant / working-renter base with shorter leases.
- Market conditions: 20 active listings in the ZIP; 13 units permitted in Cleburne County in 2024 (0 in 5+ unit buildings).
Forward outlook
- In year one you build about $9k of equity ($588 loan paydown + $8k appreciation (10.0% local appreciation)).
- Cleburne County population projected at -18% by 2050 — secular population decline; favor cash flow + early exit over multi-decade hold.
- At projected returns (10.0% appreciation + 3.0% rent growth), your $24k cash investment doubles in ~2 years — after that, you're playing with house money.
- By year 4, paydown + projected appreciation supports a ~$32k cash-out refi (75% LTV) — recoverable capital for the next deal without selling this one.
Negotiation context
- It's been on market 39 days — a 3% lower offer ($82k) is reasonable based on typical stale-listing flexibility.
Risks & watch-outs
- Climate carrying-cost: extreme-heat days projected 7→19/yr by 2055 (HVAC capex compounding) — expect insurance premiums to compound above CPI over the hold.
Questions for the listing agent
- It's been on market 39 days. Have you received any prior offers? Is the seller open to a 3% concession, seller financing, or rate buy-down credit?
- Is there a deadline driving the sale (1031 exchange, divorce, estate, relocation)? That informs how much negotiation room exists.
- Schools are F-rated, which usually means shorter tenancies and higher turnover. Who's the typical renter profile here, and what's been the actual vacancy rate?
- What's the average days-on-market for RENTAL listings here right now (not sales)? A rising rental-DOM trend means longer vacancies and softer asking-rent achievability than the comps imply.
- What's the recent tenant-quality profile in this submarket — average credit score on applications, eviction rate, late-payment / NSF rate, and stable-employment percentage? A property-management company in the area should have these aggregated.
- How much new for-sale + rental construction is in the pipeline within 1–3 miles? Heavy new supply typically softens prices + rents 12–24 months out; constrained supply supports both.
Investment metrics
- 1% rule
- 1.15% ✓
- Cap rate
- 10.14%
- Cash-on-cash
- 13.73%
- DSCR
- 1.61
- GRM
- 7.3
CMA / ARV
- ARV (on-the-fly)
- $99,792
- Comps found
- 3
Show comp detail 3 sales within ~0.75 mi
| Address | Dist | Beds/Ba | Sqft | Sold | Price | $/sf | Match |
|---|---|---|---|---|---|---|---|
| 49 Harrelson Rd | 0.07mi | 3/2.0 (+1) | 1,008 (-11%) | 2mo | $125,000 | $124 | 68 |
| 390 Heigle Rd | 0.17mi | 2/2.0 | 1,280 (+13%) | 10mo | $45,000 | $35 | 58 |
| 199 Wallace Rd | 0.41mi | 3/2.0 (+1) | 1,248 (+10%) | 4mo | $110,000 | $88 | 52 |
Match score weights: distance 35% · size 25% · config 20% · recency 20%. Top-matched comps best support the ARV.
Projected returns pro-forma
10.0% appreciation · 3.0% rent growth · sell at horizon
- IRR
- 34.4%
- Equity multiple
- 3.67×
- Total profit
- $63,603
- Equity at exit
- $76,575
- IRR
- 29.6%
- Equity multiple
- 8.29×
- Total profit
- $173,578
- Equity at exit
- $165,136
Cash invested: $23,800 (down + closing). Projections, not guarantees.
Landlord ↔ Tenant lean methodology
- Overall (STATE)
- 92 Strongly Landlord-Friendly
- State Arkansas
- 92 Strongly Landlord-Friendly · R+14
- County
- — inherits STATE
- City
- — inherits STATE
ZIP-level market 72581
- Home prices YoY
- 19.2%
- Active inventory
- 20
- Price-to-rent
- 7.3×
Monthly cashflow live
- Estimated rent
- $977 medium interval (Pro) →
- Mortgage (P&I)
- −$446
- Tax from tax record
- −$18 /mo · $215/yr
- Insurance
- −$35
- HOA
- −$0
- Vacancy / Maint / Mgmt
- −$205
- Net cashflow
- $272
Break-even live
UW: 25.0% down · 7.5% · 30yr · 1.5% tax · 5.0% vac · 8.0% maint · 8.0% mgmt
Financing live
Cash to close
- Down payment
- $21,250
- Closing costs
- $2,550
- Reserves months
- —
- Total cash needed
- —
Loan-product check · same deal, 3 products live
Conventional
25% down · 7.5% · 30yr
- Down + closing
- —
- Monthly P&I
- —
- Monthly cashflow
- —
- DSCR
- —
- Eligible?
- —
Personal DTI + credit; lowest rate.
DSCR
20% down · 8.5% · 30yr
- Down + closing
- —
- Monthly P&I
- —
- Monthly cashflow
- —
- DSCR
- —
- Eligible?
- —
No personal income docs; deal must DSCR.
Hard money
10% down · 12.0% · 12mo
- Down + closing
- —
- Monthly P&I
- —
- Monthly cashflow
- —
- DSCR
- —
- Eligible?
- —
Short-term bridge; refi at stabilization.
Listing history 2 events
-
2026-04-08status Under Contract
-
2026-02-27$85,000 New Listing
ⓘ Source: listings_history table (triggers on properties + properties_extension) + one-shot
backfill from property_details.listing_events for pre-trigger history.
Tax reassessment forecast AR · Resets to sale price
- Current annual tax
- $215 · $18/mo
- Projected year-2 tax
- $544 · $45/mo
- Expected delta
- +$329/yr (+$27/mo · 153.2%)
ⓘ Screening estimate from a state-policy table — verify with the county assessor before closing.
Climate risk First Street
- Flood 1/10 Low FEMA zone X (unshaded) · 0% chance over 30 yrs
- Wildfire 4/10 Moderate
- Heat 5/10 Major 7 d/yr ≥108°F today · 19 d/yr by 30 yrs out
- Wind 3/10 Moderate 6% chance of damaging wind over 30 yrs
- Air quality 2/10 Low 0 unhealthy d/yr today · 1 by 30 yrs out
Nearby sold comps map
Loading sold comps map…
Walkable amenities ~0.75 mi
Loading nearby amenities…
Taxation est. · year 1
- Rental income
- $11,718
- − Mortgage interest
- −$4,761
- − Property taxes
- −$215
- − Insurance
- −$425
- − Repairs & maintenance
- −$937
- − Management
- −$937
- − Depreciation
- −$2,473
- Taxable income
- $1,970
- Est. tax owed @ 24.0%
- −$473
- After-tax cash flow
- $2,796/yr
For passive investors: Depreciation is non-cash, so a rental often shows a tax loss while cash-flowing — sheltering income. Rental losses are passive: they offset passive income freely, and up to $25,000/yr can offset ordinary (W-2) income if you actively participate and your MAGI is under $100k (phasing out to $0 by $150k); unused losses carry forward. On sale, claimed depreciation is recaptured at up to 25%, and gains may owe capital-gains tax (a 1031 exchange can defer both). Figures are a year-1 estimate at your 24.0% rate — not tax advice; consult a CPA.
Schools (NCES district)
- District
- Heber Springs School District
- NCES district ID
- 0507560
- Math proficiency
- 50% ▼ -11.00%
- Reading proficiency
- 49% ▼ -11.00%
- Median HH income
- $39,577
- Composite
- 41.39/100
- National rank
- #3478
- State rank
- #19 of 238 in AR
Livability — Tumbling Shoals
- Score
- 57/100
- State rank
- #347
- US rank
- #21842
Category grades
Schools grade is shown separately in the Schools card above.
Census & demographics
- Census place
- Tumbling Shoals, AR
- City population
- 821
- Population (ZIP)
- 821
Population outlook (Cleburne County) Hauer SSP2
- Today (2025)
- 24,198 people
- By 2030
- 23,324 · -3.6%
- By 2040
- 21,566 · -10.9%
- By 2050
- 19,916 · -17.7%
- By 2075
- 16,744 · -30.8%
- By 2100
- 13,303 · -45.0%
Race, ethnicity, and origin ACS 2023
- Neighborhood character
- Predominantly White (88%)
- Race & ethnicity
- White 88% Native American 7% Two or more races 4% Hispanic / Latino 2%
- Common ancestry
- Lithuanian 5%
- Languages at home
- 98% English-only · Spanish 2%
Political lean MEDSL · Cleburne
- 2024 margin
- Solid R (+67.9) · D 15.2% · R 83.2% · Other 1.6%
- 2008→2024 swing
- -23.7pp toward R · 2008: -44.2pp · 2024: -67.9pp
- All cycles
- 2024: R+67.9 2020: R+65.8 2016: R+61.4 2012: R+52.2 2008: R+44.2
Not yet ingested
- Civics
- —
Market trends
- HPI YoY
- ▲ 39.00%
- Current HPI
- 242.3802
- Rent YoY
- —
- Metro
- —
- State GDP YoY
- ▲ 3.80%
- F500 in state
- 10
Industry mix (Fortune 500 HQ in AR)
| Industry | F500 HQs | Revenue |
|---|---|---|
| Retail | 1 | $681B |
|
||
| Food / Agriculture | 1 | $53B |
|
||
| Retail / Energy | 1 | $22B |
|
||
| Transportation / Logistics | 1 | $12B |
|
||
| Energy | 1 | $4B |
|
||
Price history
2 events — show timeline
- 2026-04-08 Pending — CARMLS
- 2026-02-27 Listed $85,000 CARMLS
Property tax history
+3.0%/yrLatest (2025): $215 · -31.9% YoY. Source: county tax records.
Cash-flow waterfall
monthlySold comps — $/sqft
last 12 mo · ≤1 miLoading sold comps…