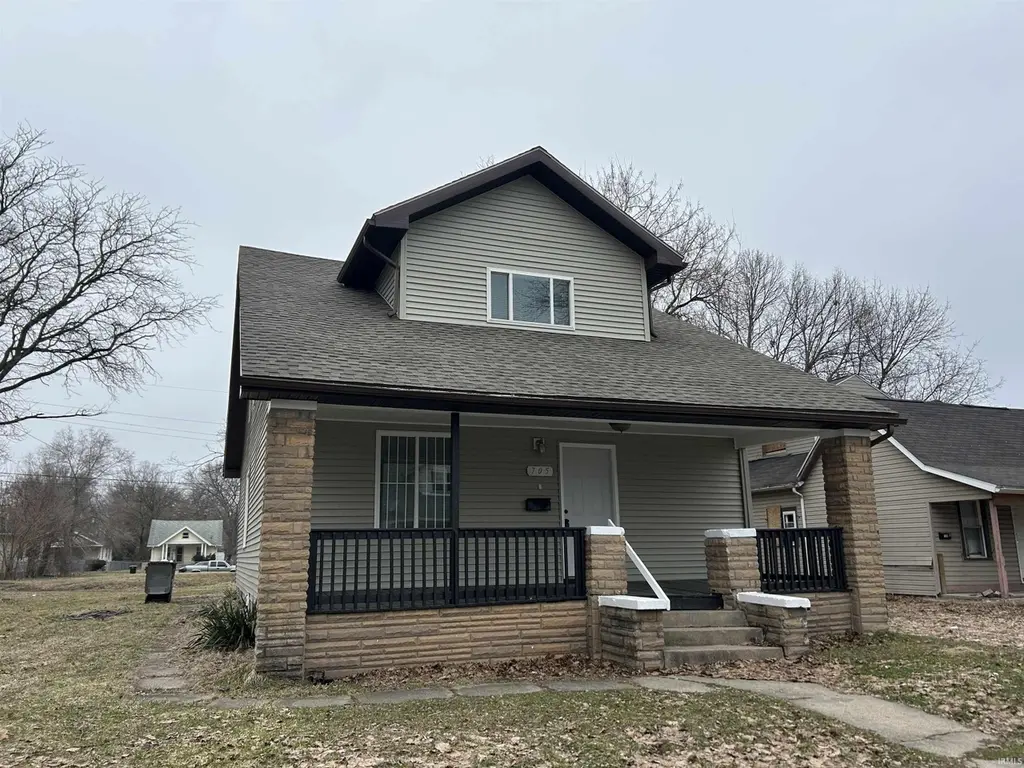
705 N Johnson St · South Bend, IN
Flood risk 7/10 · Major
- FEMA flood zone
- X (unshaded)
- Chance of flooding over 30 yrs
- 0.99%
- Est. flood insurance / yr
- $473 – $860
Fire risk 1/10 · Minimal
- Est. fire insurance / yr
- $717 – $1,331
Heat risk 2/10 · Minimal
- Hot days now (above 99°F)
- 7 days/yr
- Hot days in 30 yrs
- 16 days/yr
Wind risk 2/10 · Minimal
- Chance of severe wind over 30 yrs
- —
Air-quality risk 3/10 · Minor
- Unhealthy air days now
- 3 days/yr
- Unhealthy air days in 30 yrs
- 3 days/yr
Risk factors via First Street. Map © Google.
Why this score? — see what drove the C+ grade
The composite is a weighted blend of 9 inputs, each scored 0–100. Each bar is that input's sub-score; the figure is the points it added to the 100-point composite (weight × sub-score).
- Cash flow +27.2/30.0
- DSCR +9.5/10.0
- ARV discount +7.5/15.0
- 1% rule +7.0/10.0
- Rent growth +4.2/5.0
- Livability +3.2/5.0
- Condition / age +2.5/5.0
- Schools +1.4/10.0
- Appreciation +0.0/10.0
$129,900
🖨 Deal sheet 📄 Offer letter ✓ Due diligence
Listing remarks MLS
Discover an incredible investment opportunity with this spacious 4 bedroom, 2 full bathroom property. Perfect for maximizing rental income, expanding your portfolio or looking to find a fixer upper for yourself? This is the right house for you!! Located near Downtown South Bend, Notre Dame, close to shopping and grocery stores.
Key facts
- 4,356 sq ft lot
- Built 1922
- Listed 23 days
Property features AI
Exterior
- Utilities: Public water; Public sewer
- Home design: Single-family residence (site-built); One-story
- Construction: Brick and wood siding exterior; Asphalt roof; Concrete perimeter foundation; Built as site-built home
- Exterior features: Corner lot; Lot dimensions approximately 37 x 118
Interior
- Kitchen: Refrigerator
- Bathrooms: 2 full bathrooms; 1 main-level bathroom
- Heating & cooling: Natural gas heating; No central cooling
- Interior features: Refrigerator; Electric water heater; Unfinished basement; Basement laundry (in basement); Total of 8 rooms
- Laundry & utility: Laundry located in the basement; Electric water heater
Neighborhood map
What this means for you Summary
Snapshot
- This is a 4-bed/2.5-bath single-family listed at $130k.
Deal economics
- At list price, monthly cash flow is $318 ($4k/yr) — positive.
- The deal already cash-flows at list — no discount required.
- Meets the 1% rule at list price ($2k rent vs $130k).
- Recommended offer: $128k (1.5% below list) — sets the bar for market timing.
- Cap rate 9.7% vs local median 4.4% in South Bend — top-decile yield for the area; either an underpriced asset or a hidden risk that comps aren't pricing in. Stress-test before assuming the spread holds.
Location & tenants
- Location reads 64/100 on livability (#365 in IN) — a middle-class / working-renter tenant base. Strengths: cost of living A+, housing A+, health & safety A+; Watch: amenities D, employment D, crime F.
- South Bend Community School Corporation (urban): math 12% / reading 21% proficiency, ranked #284 of 301 in IN (top 94%) — low school quality limits family demand, transient renter base, plan for 1-2y turnover; 66% free/reduced lunch — lower-income household profile, screen leases tightly.
- Zoned schools: Harrison Elementary School (math 3% / reading 3%, grade F, #988 of 994 statewide, top 99%, 654 students, 91% FRL); Dickinson Fine Arts Academy (math 0% / reading 5%, grade F, #329 of 330 statewide, top 100%, 449 students, 86% FRL); Washington High School (math 12% / reading 42%, grade F, #315 of 369 statewide, top 86%, 834 students, 79% FRL) — zoned schools average 86% FRL vs 66% district-wide (19 pts higher); higher-poverty schools than district average — tighter screening recommended.
- Market conditions: Rents rising fast (+6.8%/yr); 424 active listings in the ZIP; 16 comparable units currently listed for rent nearby; rentals at typical pace (median 21d on market — plan ~3-4 weeks tenant-placement turnaround); 754 units permitted in St. Joseph County in 2024 (460 in 5+ unit buildings).
- This rent runs 30% of the median local income ($62k/yr) — at the standard rent-burdened threshold; future hikes will face affordability resistance.
Forward outlook
- Local home prices are declining (-3.0%/yr); year-one equity from $898 of loan paydown is wiped out by about $4k of value loss. Plan a longer hold.
- At projected returns (-3.0% appreciation + 6.8% rent growth), your $36k cash investment doubles in ~8 years — after that, you're playing with house money.
Negotiation context
- It's been on market 23 days — a 2% lower offer ($128k) is reasonable based on typical stale-listing flexibility.
- 4 sale attempts since 3y ago with the ask held roughly flat each time — persistent listings suggest the price (not the market) is what's stuck; bring a comps-based counter.
- Current owner paid $49k; list at $130k implies a 165% gain — meaningful room to come down on a strong offer.
Risks & watch-outs
- Watch-outs: flood insurance adds $56/mo; built in 1922 — expect roof / HVAC / electrical / plumbing capex.
- Climate carrying-cost: major flood risk — expect insurance premiums to compound above CPI over the hold.
Questions for the listing agent
- Built in 1922 — when were the roof, HVAC, electrical panel, plumbing, and water heater last replaced?
- What's the actual annual flood-insurance premium (NFIP or private), and is the property in a SFHA with mandatory coverage?
- Is there a deadline driving the sale (1031 exchange, divorce, estate, relocation)? That informs how much negotiation room exists.
- Schools are F-rated, which usually means shorter tenancies and higher turnover. Who's the typical renter profile here, and what's been the actual vacancy rate?
- Crime grade is F in this area — have there been break-ins, vandalism, or insurance claims at this property in the last 3 years? What carrier currently insures it and at what premium?
- What's the average days-on-market for RENTAL listings here right now (not sales)? A rising rental-DOM trend means longer vacancies and softer asking-rent achievability than the comps imply.
- What's the recent tenant-quality profile in this submarket — average credit score on applications, eviction rate, late-payment / NSF rate, and stable-employment percentage? A property-management company in the area should have these aggregated.
- How much new for-sale + rental construction is in the pipeline within 1–3 miles? Heavy new supply typically softens prices + rents 12–24 months out; constrained supply supports both.
Investment metrics
- 1% rule
- 1.20% ✓
- Cap rate
- 9.74%
- Cash-on-cash
- 12.32%
- DSCR
- 1.55
- GRM
- 6.9
CMA / ARV
- ARV (median comp)
- $84,423
- List price
- $129,900
- Delta
- 53.87%
- Verdict
- OVERPRICED
- Comps
- 20 within 1.0 mi
Show comp detail 12 sales within ~0.75 mi
| Address | Dist | Beds/Ba | Sqft | Sold | Price | $/sf | Match |
|---|---|---|---|---|---|---|---|
| 710 N Johnson St | 0.03mi | 5/1.5 (+1) | 2,080 (+5%) | 8mo | $70,000 | $34 | 74 |
| 1609 Florence Ave | 0.35mi | 4/1.0 | 1,980 (+0%) | 9mo | $136,000 | $69 | 70 |
| 1421 Linden Ave | 0.46mi | 4/2.0 | 1,932 (-2%) | 6mo | $122,000 | $63 | 68 |
| 317 Studebaker St | 0.46mi | 3/2.0 (-1) | 1,960 (-1%) | 5mo | $106,250 | $54 | 66 |
| 2205 Kenwood Ave | 0.26mi | 4/2.5 | 1,700 (-14%) | 2mo | $49,000 | $29 | 63 |
| 1201 N Brookfield St | 0.47mi | 3/1.5 (-1) | 1,968 (-0%) | 8mo | $174,000 | $88 | 62 |
| 807 Diamond Ave | 0.48mi | 3/1.5 (-1) | 1,920 (-3%) | 2mo | $70,000 | $36 | 62 |
| 418 Studebaker St | 0.44mi | 3/1.0 (-1) | 2,016 (+2%) | 5mo | $106,250 | $53 | 61 |
| 711 Blaine Ave | 0.59mi | 5/2.0 (+1) | 1,896 (-4%) | 7mo | $77,000 | $41 | 52 |
| 1134 Fremont St | 0.50mi | 3/2.0 (-1) | 1,728 (-13%) | 2mo | $138,000 | $80 | 47 |
| 2733 W Lincoln Way | 0.62mi | 5/2.0 (+1) | 2,146 (+9%) | 7mo | $245,000 | $114 | 44 |
| 2815 Humboldt St | 0.70mi | 3/1.5 (-1) | 1,716 (-13%) | 10mo | $180,000 | $105 | 28 |
Match score weights: distance 35% · size 25% · config 20% · recency 20%. Top-matched comps best support the ARV.
Projected returns pro-forma
-3.0% appreciation · 6.78% rent growth · sell at horizon
- IRR
- 3.7%
- Equity multiple
- 1.15×
- Total profit
- $5,370
- Equity at exit
- $19,369
- IRR
- 16.5%
- Equity multiple
- 2.60×
- Total profit
- $58,145
- Equity at exit
- $11,231
Cash invested: $36,372 (down + closing). Projections, not guarantees.
Landlord ↔ Tenant lean methodology
- Overall (STATE)
- 90 Strongly Landlord-Friendly
- State Indiana
- 90 Strongly Landlord-Friendly · R+11
- County
- — inherits STATE
- City
- — inherits STATE
ZIP-level market 46628
- Rents YoY
- 6.8%
- Active inventory
- 424
- Price-to-rent
- 6.9×
Monthly cashflow live
- Estimated rent
- $1,558 high interval (Pro) →
- Mortgage (P&I)
- −$681
- Tax from tax record
- −$122 /mo · $1,463/yr
- Insurance
- −$54
- Flood insurance flood zone
- −$56 /mo · $666/yr
- HOA
- −$0
- Vacancy / Maint / Mgmt
- −$327
- Net cashflow
- $318
Break-even live
UW: 25.0% down · 7.5% · 30yr · 1.5% tax · 5.0% vac · 8.0% maint · 8.0% mgmt
Financing live
Cash to close
- Down payment
- $32,475
- Closing costs
- $3,897
- Reserves months
- —
- Total cash needed
- —
Loan-product check · same deal, 3 products live
Conventional
25% down · 7.5% · 30yr
- Down + closing
- —
- Monthly P&I
- —
- Monthly cashflow
- —
- DSCR
- —
- Eligible?
- —
Personal DTI + credit; lowest rate.
DSCR
20% down · 8.5% · 30yr
- Down + closing
- —
- Monthly P&I
- —
- Monthly cashflow
- —
- DSCR
- —
- Eligible?
- —
No personal income docs; deal must DSCR.
Hard money
10% down · 12.0% · 12mo
- Down + closing
- —
- Monthly P&I
- —
- Monthly cashflow
- —
- DSCR
- —
- Eligible?
- —
Short-term bridge; refi at stabilization.
Rent comps 16 comps
| Address | Beds | Baths | Sqft | Rent | $/sqft | DOM | Units | Dist |
|---|---|---|---|---|---|---|---|---|
| 1008 O Brien St Unit O South Bend, IN | 3.0 | 1.0 | 1634 | $800 | $0.49 | 21d | 1 | 0.26mi |
| 2203 Smith St South Bend, IN | 3.0 | 1.0 | 1248 | $1,215 | $0.97 | 13d | 1 | 0.30mi |
| 2205 Lincoln Way W South Bend, IN | 4.0 | 2.0 | 1440 | $1,565 | $1.09 | 13d | 1 | 0.30mi |
| 1054 Huey St South Bend, IN | 4.0 | 2.0 | 1288 | $1,550 | $1.20 | 13d | 1 | 0.37mi |
| 2530 Bonds Ave South Bend, IN | 5.0 | 1.5 | 1866 | $2,000 | $1.07 | 43d | 1 | 0.44mi |
| 1206 Johnson St South Bend, IN | 3.0 | 1.5 | 1320 | $1,400 | $1.06 | 43d | 1 | 0.49mi |
| 1210 Johnson St South Bend, IN | 3.0 | 2.0 | 1568 | $1,250 | $0.80 | 21d | 1 | 0.49mi |
| 752 Diamond Ave South Bend, IN | 3.0 | 1.5 | 1248 | $1,400 | $1.12 | 43d | 1 | 0.50mi |
| 1118 Van Buren St South Bend, IN | 3.0 | 1.0 | 1394 | $1,375 | $0.99 | 21d | 1 | 0.64mi |
| 1032 Allen St South Bend, IN | 3.0 | 2.0 | 1580 | $1,200 | $0.76 | 43d | 1 | 0.75mi |
| 1243 Portage Ave South Bend, IN | 3.0 | 1.0 | 1570 | $1,500 | $0.96 | 43d | 1 | 0.82mi |
| 1642 Johnson St South Bend, IN | 3.0 | 1.0 | 1375 | $1,400 | $1.02 | 13d | 1 | 0.89mi |
| 609 N Scott St South Bend, IN | 5.0 | 1.5 | 1951 | $1,450 | $0.74 | 43d | 1 | 0.98mi |
| 504 W Navarre St South Bend, IN | 3.0 | 1.5 | 1520 | $1,350 | $0.89 | 13d | 1 | 1.13mi |
| 721 S Arnold St South Bend, IN | 4.0 | 2.0 | 2568 | $1,800 | $0.70 | 13d | 1 | 1.27mi |
| 211 W Washington St South Bend, IN | 3.0 | 1.0–2.5 | 1162 | $7,491 | $6.44 | 21d | 19 | 1.46mi |
Listing history 10 events
-
2026-06-18days on market $129,900 Active 23 DOM
-
2026-06-17status $129,900 Active 22 DOM
-
2026-05-06$129,900 Active 535-char remark
-
2025-05-12soldstatus $49,000 Closed 330-char remark
Show marketing remark (330 chars)
Discover an incredible investment opportunity with this spacious 4 bedroom, 2 full bathroom property. Perfect for maximizing rental income, expanding your portfolio or looking to find a fixer upper for yourself? This is the right house for you!! Located near Downtown South Bend, Notre Dame, close to shopping and grocery stores.
-
2025-05-05status Pending 330-char remark
Show marketing remark (330 chars)
Discover an incredible investment opportunity with this spacious 4 bedroom, 2 full bathroom property. Perfect for maximizing rental income, expanding your portfolio or looking to find a fixer upper for yourself? This is the right house for you!! Located near Downtown South Bend, Notre Dame, close to shopping and grocery stores.
-
2025-03-11historical Active Under Contract 330-char remark
Show marketing remark (330 chars)
Discover an incredible investment opportunity with this spacious 4 bedroom, 2 full bathroom property. Perfect for maximizing rental income, expanding your portfolio or looking to find a fixer upper for yourself? This is the right house for you!! Located near Downtown South Bend, Notre Dame, close to shopping and grocery stores.
-
2025-03-06$45,000 Active 330-char remark
Show marketing remark (330 chars)
Discover an incredible investment opportunity with this spacious 4 bedroom, 2 full bathroom property. Perfect for maximizing rental income, expanding your portfolio or looking to find a fixer upper for yourself? This is the right house for you!! Located near Downtown South Bend, Notre Dame, close to shopping and grocery stores.
-
2023-06-09soldstatus $40,000 Closed
Show marketing remark (123 chars)
Great investment opportunity located just minutes from Downtown South Bend, Notre Dame, and the airport! 4 bed/2 full bath.
-
2023-05-19status Pending
Show marketing remark (123 chars)
Great investment opportunity located just minutes from Downtown South Bend, Notre Dame, and the airport! 4 bed/2 full bath.
-
2023-05-09$40,000 Active
Show marketing remark (123 chars)
Great investment opportunity located just minutes from Downtown South Bend, Notre Dame, and the airport! 4 bed/2 full bath.
ⓘ Source: listings_history table (triggers on properties + properties_extension) + one-shot
backfill from property_details.listing_events for pre-trigger history.
Tax reassessment forecast IN · Partial reset (capped growth)
- Current annual tax
- $1,463 · $122/mo
- Projected year-2 tax
- $1,463 · $122/mo
- Expected delta
- $0/yr ($0/mo · 0.0%)
ⓘ Screening estimate from a state-policy table — verify with the county assessor before closing.
Climate risk First Street
- Flood 7/10 Severe FEMA zone X (unshaded) · 99% chance over 30 yrs
- Wildfire 1/10 Low
- Heat 2/10 Low 7 d/yr ≥99°F today · 16 d/yr by 30 yrs out
- Wind 2/10 Low
- Air quality 3/10 Moderate 3 unhealthy d/yr today · 3 by 30 yrs out
Nearby sold comps map
Loading sold comps map…
Walkable amenities ~0.75 mi
Loading nearby amenities…
Taxation est. · year 1
- Rental income
- $18,691
- − Mortgage interest
- −$7,276
- − Property taxes
- −$1,463
- − Insurance
- −$1,316
- − Repairs & maintenance
- −$1,495
- − Management
- −$1,495
- − Depreciation
- −$3,779
- Taxable income
- $1,867
- Est. tax owed @ 24.0%
- −$448
- After-tax cash flow
- $3,365/yr
For passive investors: Depreciation is non-cash, so a rental often shows a tax loss while cash-flowing — sheltering income. Rental losses are passive: they offset passive income freely, and up to $25,000/yr can offset ordinary (W-2) income if you actively participate and your MAGI is under $100k (phasing out to $0 by $150k); unused losses carry forward. On sale, claimed depreciation is recaptured at up to 25%, and gains may owe capital-gains tax (a 1031 exchange can defer both). Figures are a year-1 estimate at your 24.0% rate — not tax advice; consult a CPA.
Schools (NCES district)
- District
- South Bend Community School Corporation
- NCES district ID
- 1810290
- Math proficiency
- 12% ▼ -10.00%
- Reading proficiency
- 21% ▼ -6.00%
- Median HH income
- $41,935
- Composite
- 14.21/100
- National rank
- #9452
- State rank
- #284 of 301 in IN
Livability — South Bend
- Score
- 64/100
- State rank
- #365
- US rank
- #13730
Category grades
Schools grade is shown separately in the Schools card above.
Census & demographics
- Census place
- South Bend, IN
- County
- Saint Joseph County · 189,048 people
- City population
- 99,767
- Metro
- South Bend-Mishawaka, IN-MI
- Population (ZIP)
- 27,685
- Household income
- $61,759
- Rent vs Own
- Severe rent burden
- 1024.0
Population outlook (St. Joseph County) Hauer SSP2
- Today (2025)
- 273,186 people
- By 2030
- 273,594 · +0.1%
- By 2040
- 271,641 · -0.6%
- By 2050
- 269,187 · -1.5%
- By 2075
- 263,136 · -3.7%
- By 2100
- 245,659 · -10.1%
Race, ethnicity, and origin ACS 2023
- Neighborhood character
- Diverse neighborhood (Simpson 0.60)
- Race & ethnicity
- White 55% Black 30% Hispanic / Latino 10% Two or more races 8%
- Hispanic origin (detail)
- Mexican 8%
- Common ancestry
- Romanian 12% Lithuanian 1% Slovak 1%
- Foreign-born
- 7% · Canada, China
- Languages at home
- 89% English-only · Spanish 7% Russian/Polish/Slavic 1%
Political lean MEDSL · St. Joseph
- 2024 margin
- Toss-up / Even · D 50.0% · R 48.5% · Other 1.5%
- 2008→2024 swing
- -15.6pp toward R · 2008: 17.1pp · 2024: 1.5pp
- All cycles
- 2024: D+1.5 2020: D+5.8 2016: D+0.2 2012: D+3.5 2008: D+17.1
Not yet ingested
- Civics
- —
Market trends
- HPI YoY
- ▼ -130.47%
- Current HPI
- 202.112
- Rent YoY
- ▲ 6.78%
- Metro
- South Bend-Mishawaka, IN-MI
- State GDP YoY
- ▲ 2.90%
- F500 in state
- 18
Industry mix (Fortune 500 HQ in IN)
| Industry | F500 HQs | Revenue |
|---|---|---|
| Industrial Machinery | 2 | $37B |
|
||
| Healthcare | 1 | $177B |
|
||
| Pharmaceuticals | 1 | $45B |
|
||
| Metals / Steel | 1 | $18B |
|
||
| Agriculture | 1 | $17B |
|
||
| Packaging | 1 | $12B |
|
||
Price history
+224.8% since first listed10 events — show timeline
- 2026-06-17 Relisted — IRMLS
- 2026-05-29 Pending — IRMLS
- 2026-05-06 Listed $129,900 IRMLS
- 2025-05-12 Sold (MLS) $49,000 IRMLS
- 2025-05-05 Pending — IRMLS
- 2025-03-11 Contingent — IRMLS
- 2025-03-06 Listed $45,000 IRMLS
- 2023-06-09 Sold (MLS) $40,000 IRMLS
- 2023-05-19 Pending — IRMLS
- 2023-05-09 Listed $40,000 IRMLS
Property tax history
-1.4%/yrLatest (2025): $1,463 · -1.1% YoY. Source: county tax records.
Cash-flow waterfall
monthlySold comps — $/sqft
last 12 mo · ≤1 miLoading sold comps…