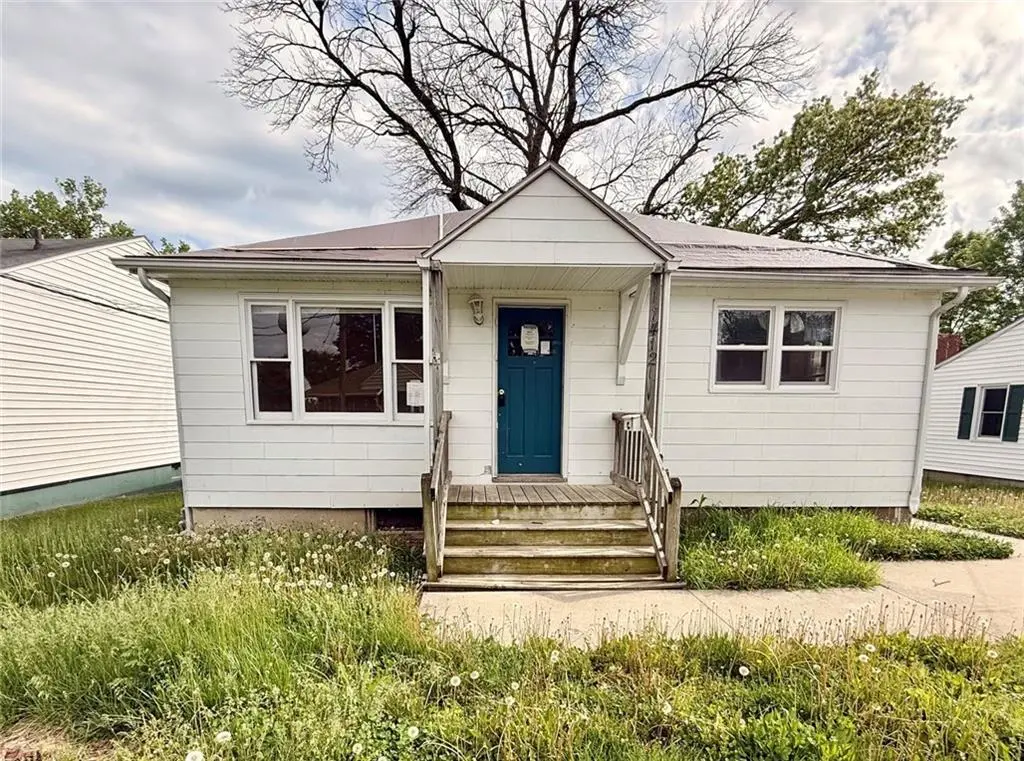
1412 Cooper St · Chillicothe, MO
Flood risk 1/10 · Minimal
- FEMA flood zone
- X (unshaded)
- Chance of flooding over 30 yrs
- 0.0%
- Est. flood insurance / yr
- $473 – $860
Fire risk 1/10 · Minimal
- Est. fire insurance / yr
- $1,054 – $1,958
Heat risk 4/10 · Minor
- Hot days now (above 108°F)
- 7 days/yr
- Hot days in 30 yrs
- 15 days/yr
Wind risk 2/10 · Minimal
- Chance of severe wind over 30 yrs
- —
Air-quality risk 2/10 · Minimal
- Unhealthy air days now
- 0 days/yr
- Unhealthy air days in 30 yrs
- 1 days/yr
Risk factors via First Street. Map © Google.
Why this score? — see what drove the B+ grade
The composite is a weighted blend of 9 inputs, each scored 0–100. Each bar is that input's sub-score; the figure is the points it added to the 100-point composite (weight × sub-score).
- Cash flow +30.0/30.0
- ARV discount +15.0/15.0
- 1% rule +10.0/10.0
- DSCR +10.0/10.0
- Schools +4.1/10.0
- Livability +3.4/5.0
- Rent growth +2.5/5.0
- Condition / age +2.5/5.0
- Appreciation +0.0/10.0
$67,500
🖨 Deal sheet 📄 Offer letter ✓ Due diligence
Listing remarks MLS
Sellers have installed new replacement windows, blinds, double concrete pad for parking, updated kitchen with island, stove, dishwasher, microwave and garbage disposal. Large lot with shade trees with chain link fence in backyard.
Key facts
- Open floor plan
- Off street parking
- Large yard
Tags
Property features AI
Finance
- Other: Lot dimensions approximately 50 x 120 (6,011 sq ft); Above-grade living area reported as 1,050 (public records); Property age: 101+ years
- HOA & community: No association fees
Exterior
- Parking: Off-street parking
- Utilities: Public water; Public sewer
- Home design: Single-family residence; Residential property; One-story (ranch)
- Construction: Vinyl siding; Composition roof
- Exterior features: Located inside city limits; Level lot
Interior
- Kitchen: Kitchen on the first floor
- Bedrooms: 3 bedrooms (all on the first floor)
- Flooring: Carpet; Laminate
- Bathrooms: 1 full bathroom (first floor)
- Heating & cooling: Forced air heating; Electric cooling
- Interior features: Ranch floor plan; Unfinished basement
Neighborhood map
What this means for you Summary
Snapshot
- This is a 3-bed/1.0-bath single-family listed at $68k.
Deal economics
- At list price, monthly cash flow is $387 ($5k/yr) — positive.
- The deal already cash-flows at list — no discount required.
- Meets the 1% rule at list price ($1k rent vs $68k).
- Recommended offer: $65k (3.0% below list) — sets the bar for market timing.
- Cap rate 13.2% vs local median 4.8% in Chillicothe — top-decile yield for the area; either an underpriced asset or a hidden risk that comps aren't pricing in. Stress-test before assuming the spread holds.
Location & tenants
- Location reads 67/100 on livability (#225 in MO) — a middle-class / working-renter tenant base. Strengths: cost of living A+, housing A; Watch: employment D+, amenities F, commute F.
- Chillicothe R-II (town): math 49% / reading 48% proficiency, ranked #60 of 324 in MO (top 18%) — families likely to look elsewhere, expect single-tenant / working-renter base with shorter leases.
- Market conditions: 71 active listings in the ZIP; 47 units permitted in Livingston County in 2024 (0 in 5+ unit buildings).
Forward outlook
- Local home prices are declining (-3.0%/yr); year-one equity from $467 of loan paydown is wiped out by about $2k of value loss. Plan a longer hold.
- At projected returns (-3.0% appreciation + 3.0% rent growth), your $19k cash investment doubles in ~5 years — after that, you're playing with house money.
Negotiation context
- It's been on market 35 days — a 3% lower offer ($65k) is reasonable based on typical stale-listing flexibility.
- 4 sale attempts since 3y ago; this cycle's ask has dropped $12k (15%) from the opening price — seller is motivated, your offer sets the floor, not the list.
Risks & watch-outs
- Watch-outs: built in 1952 — expect roof / HVAC / electrical / plumbing capex.
Questions for the listing agent
- It's been on market 35 days. Have you received any prior offers? Is the seller open to a 3% concession, seller financing, or rate buy-down credit?
- Built in 1952 — when were the roof, HVAC, electrical panel, plumbing, and water heater last replaced?
- Is there a deadline driving the sale (1031 exchange, divorce, estate, relocation)? That informs how much negotiation room exists.
- What's the average days-on-market for RENTAL listings here right now (not sales)? A rising rental-DOM trend means longer vacancies and softer asking-rent achievability than the comps imply.
- What's the recent tenant-quality profile in this submarket — average credit score on applications, eviction rate, late-payment / NSF rate, and stable-employment percentage? A property-management company in the area should have these aggregated.
- How much new for-sale + rental construction is in the pipeline within 1–3 miles? Heavy new supply typically softens prices + rents 12–24 months out; constrained supply supports both.
Investment metrics
- 1% rule
- 1.54% ✓
- Cap rate
- 13.18%
- Cash-on-cash
- 24.59%
- DSCR
- 2.09
- GRM
- 5.4
CMA / ARV
- ARV (median comp)
- $123,155
- List price
- $67,500
- Delta
- -35.85%
- Verdict
- UNDERPRICED
- Comps
- 20 within 1.0 mi
Show comp detail 9 sales within ~0.75 mi
| Address | Dist | Beds/Ba | Sqft | Sold | Price | $/sf | Match |
|---|---|---|---|---|---|---|---|
| 1307 Jackson St | 0.17mi | 3/1.0 | 2,000 (-5%) | 6mo | $155,000 | $78 | 79 |
| 1407 Walnut St | 0.48mi | 3/2.0 | 2,088 (-1%) | 3mo | $169,000 | $81 | 70 |
| 660 Elmdale N/A | 0.58mi | 3/2.0 | 2,162 (+3%) | 12mo | $232,000 | $107 | 55 |
| 241 Southwest Dr | 0.65mi | 2/2.5 (-1) | 2,234 (+6%) | 1mo | $229,900 | $103 | 47 |
| 380 Woodrow St | 0.33mi | 2/2.0 (-1) | 1,878 (-11%) | 20mo | $30,000 | $16 | 41 |
| 251 Southwest Dr | 0.58mi | 3/1.5 | 1,805 (-14%) | 8mo | $199,900 | $111 | 41 |
| 239 Southwest Dr | 0.66mi | 4/2.5 (+1) | 2,344 (+12%) | 5mo | $279,900 | $119 | 35 |
| 904 Elm St | 0.50mi | 3/2.0 | 2,389 (+14%) | 24mo | $99,900 | $42 | 30 |
| 338 Jackson St | 0.74mi | 2/1.0 (-1) | 1,840 (-12%) | 18mo | $114,900 | $62 | 25 |
Match score weights: distance 35% · size 25% · config 20% · recency 20%. Top-matched comps best support the ARV.
Projected returns pro-forma
-3.0% appreciation · 3.0% rent growth · sell at horizon
- IRR
- 17.9%
- Equity multiple
- 1.73×
- Total profit
- $13,719
- Equity at exit
- $10,064
- IRR
- 26.4%
- Equity multiple
- 3.31×
- Total profit
- $43,680
- Equity at exit
- $5,836
Cash invested: $18,900 (down + closing). Projections, not guarantees.
Landlord ↔ Tenant lean methodology
- Overall (STATE)
- 81 Strongly Landlord-Friendly
- State Missouri
- 81 Strongly Landlord-Friendly · R+10
- County
- — inherits STATE
- City
- — inherits STATE
ZIP-level market 64601
- Home prices YoY
- -15.3%
- Active inventory
- 71
- Price-to-rent
- 5.4×
Monthly cashflow live
- Estimated rent
- $1,037 medium interval (Pro) →
- Mortgage (P&I)
- −$354
- Tax from tax record
- −$50 /mo · $595/yr
- Insurance
- −$28
- HOA
- −$0
- Vacancy / Maint / Mgmt
- −$218
- Net cashflow
- $387
Break-even live
UW: 25.0% down · 7.5% · 30yr · 1.5% tax · 5.0% vac · 8.0% maint · 8.0% mgmt
Financing live
Cash to close
- Down payment
- $16,875
- Closing costs
- $2,025
- Reserves months
- —
- Total cash needed
- —
Loan-product check · same deal, 3 products live
Conventional
25% down · 7.5% · 30yr
- Down + closing
- —
- Monthly P&I
- —
- Monthly cashflow
- —
- DSCR
- —
- Eligible?
- —
Personal DTI + credit; lowest rate.
DSCR
20% down · 8.5% · 30yr
- Down + closing
- —
- Monthly P&I
- —
- Monthly cashflow
- —
- DSCR
- —
- Eligible?
- —
No personal income docs; deal must DSCR.
Hard money
10% down · 12.0% · 12mo
- Down + closing
- —
- Monthly P&I
- —
- Monthly cashflow
- —
- DSCR
- —
- Eligible?
- —
Short-term bridge; refi at stabilization.
Listing history 26 events
-
2026-06-18days on market $67,500 Active 35 DOM
-
2026-06-17days on market $67,500 Active 34 DOM
-
2026-06-17price $67,500 Active 33 DOM
-
2026-06-16days on market $79,000 Active 33 DOM
-
2026-06-15days on market $79,000 Active 32 DOM
-
2026-06-13days on market $79,000 Active 30 DOM
-
2026-06-12days on market $79,000 Active 29 DOM
-
2026-06-09days on market $79,000 Active 26 DOM
-
2026-06-08days on market $79,000 Active 25 DOM
-
2026-06-07days on market $79,000 Active 24 DOM
-
2026-06-04days on market $79,000 Active 20 DOM
-
2026-06-02days on market $79,000 Active 19 DOM
-
2026-06-01days on market $79,000 Active 18 DOM
-
2026-05-31days on market $79,000 Active 17 DOM
-
2026-05-14$79,000 Active 226-char remark
-
2025-02-20$79,900 Active
-
2023-07-11soldstatus
-
2023-07-11soldstatus
-
2023-07-07soldstatus Closed
Show marketing remark (230 chars)
Sellers have installed new replacement windows, blinds, double concrete pad for parking, updated kitchen with island, stove, dishwasher, microwave and garbage disposal. Large lot with shade trees with chain link fence in backyard.
-
2023-07-07soldstatus Closed
Show marketing remark (230 chars)
Sellers have installed new replacement windows, blinds, double concrete pad for parking, updated kitchen with island, stove, dishwasher, microwave and garbage disposal. Large lot with shade trees with chain link fence in backyard.
-
2023-06-20status Pending
Show marketing remark (230 chars)
Sellers have installed new replacement windows, blinds, double concrete pad for parking, updated kitchen with island, stove, dishwasher, microwave and garbage disposal. Large lot with shade trees with chain link fence in backyard.
-
2023-05-25status Pending
Show marketing remark (230 chars)
Sellers have installed new replacement windows, blinds, double concrete pad for parking, updated kitchen with island, stove, dishwasher, microwave and garbage disposal. Large lot with shade trees with chain link fence in backyard.
-
2023-05-25historical Active Under Contract
Show marketing remark (230 chars)
Sellers have installed new replacement windows, blinds, double concrete pad for parking, updated kitchen with island, stove, dishwasher, microwave and garbage disposal. Large lot with shade trees with chain link fence in backyard.
-
2023-05-24$99,900 Active
-
2023-05-23$99,900 Active
Show marketing remark (230 chars)
Sellers have installed new replacement windows, blinds, double concrete pad for parking, updated kitchen with island, stove, dishwasher, microwave and garbage disposal. Large lot with shade trees with chain link fence in backyard.
-
2018-12-20soldstatus
ⓘ Source: listings_history table (triggers on properties + properties_extension) + one-shot
backfill from property_details.listing_events for pre-trigger history.
Tax reassessment forecast MO · Resets to sale price
- Current annual tax
- $595 · $50/mo
- Projected year-2 tax
- $655 · $55/mo
- Expected delta
- +$60/yr (+$5/mo · 10.0%)
ⓘ Screening estimate from a state-policy table — verify with the county assessor before closing.
Climate risk First Street
- Flood 1/10 Low FEMA zone X (unshaded) · 0% chance over 30 yrs
- Wildfire 1/10 Low
- Heat 4/10 Moderate 7 d/yr ≥108°F today · 15 d/yr by 30 yrs out
- Wind 2/10 Low
- Air quality 2/10 Low 0 unhealthy d/yr today · 1 by 30 yrs out
Nearby sold comps map
Loading sold comps map…
Walkable amenities ~0.75 mi
Loading nearby amenities…
Taxation est. · year 1
- Rental income
- $12,439
- − Mortgage interest
- −$3,781
- − Property taxes
- −$595
- − Insurance
- −$338
- − Repairs & maintenance
- −$995
- − Management
- −$995
- − Depreciation
- −$1,964
- Taxable income
- $3,772
- Est. tax owed @ 24.0%
- −$905
- After-tax cash flow
- $3,741/yr
For passive investors: Depreciation is non-cash, so a rental often shows a tax loss while cash-flowing — sheltering income. Rental losses are passive: they offset passive income freely, and up to $25,000/yr can offset ordinary (W-2) income if you actively participate and your MAGI is under $100k (phasing out to $0 by $150k); unused losses carry forward. On sale, claimed depreciation is recaptured at up to 25%, and gains may owe capital-gains tax (a 1031 exchange can defer both). Figures are a year-1 estimate at your 24.0% rate — not tax advice; consult a CPA.
Schools (NCES district)
- District
- Chillicothe R-II
- NCES district ID
- 2908760
- Math proficiency
- 49% ▲ 4.00%
- Reading proficiency
- 48% ▲ 4.00%
- Median HH income
- $42,193
- Composite
- 40.81/100
- National rank
- #3637
- State rank
- #60 of 324 in MO
Livability — Chillicothe
- Score
- 67/100
- State rank
- #225
- US rank
- #10947
Category grades
Schools grade is shown separately in the Schools card above.
Census & demographics
- Census place
- Chillicothe, MO
- Population (ZIP)
- 12,110
Population outlook (Livingston County) Hauer SSP2
- Today (2025)
- 14,945 people
- By 2030
- 14,945 · +0.0%
- By 2040
- 15,010 · +0.4%
- By 2050
- 15,105 · +1.1%
- By 2075
- 15,950 · +6.7%
- By 2100
- 15,897 · +6.4%
Race, ethnicity, and origin ACS 2023
- Neighborhood character
- Predominantly White (91%)
- Race & ethnicity
- White 91% Two or more races 4% Black 3% Hispanic / Latino 2%
- Common ancestry
- Slovak 2% Italian 1% Romanian 1%
- Foreign-born
- 1% · Canada
Political lean MEDSL · Livingston
- 2024 margin
- Solid R (+57.8) · D 20.7% · R 78.5%
- 2008→2024 swing
- -34.0pp toward R · 2008: -23.8pp · 2024: -57.8pp
- All cycles
- 2024: R+57.8 2020: R+57.1 2016: R+56.4 2012: R+34.7 2008: R+23.8
Not yet ingested
- Civics
- —
Market trends
- HPI YoY
- ▼ -32.00%
- Current HPI
- 177.3092
- Rent YoY
- —
- Metro
- —
- State GDP YoY
- ▲ 1.84%
- F500 in state
- 20
Industry mix (Fortune 500 HQ in MO)
| Industry | F500 HQs | Revenue |
|---|---|---|
| Healthcare | 1 | $163B |
|
||
| Insurance | 1 | $21B |
|
||
| Industrial Technology | 1 | $17B |
|
||
| Retail | 1 | $16B |
|
||
| Industrial Distribution | 1 | $10B |
|
||
| Utilities | 1 | $9B |
|
||
Price history
-32.4% since first listed13 events — show timeline
- 2026-06-16 Price Changed $67,500 Heartland MLS as Distributed by MLS Grid
- 2026-05-14 Listed $79,000 Heartland MLS as Distributed by MLS Grid
- 2025-02-20 Listed $79,900 NECAR
- 2023-07-11 Sold (Public Records) — Public Records
- 2023-07-11 Sold (Public Records) — Public Records
- 2023-07-07 Sold (MLS) — NECAR
- 2023-07-07 Sold (MLS) — Heartland MLS as Distributed by MLS Grid
- 2023-06-20 Pending — Heartland MLS as Distributed by MLS Grid
- 2023-05-25 Pending — NECAR
- 2023-05-25 Contingent — Heartland MLS as Distributed by MLS Grid
- 2023-05-24 Listed $99,900 NECAR
- 2023-05-23 Listed $99,900 Heartland MLS as Distributed by MLS Grid
- 2018-12-20 Sold (Public Records) — Public Records
Property tax history
+2.1%/yrLatest (2025): $595 · -2.7% YoY. Source: county tax records.
Cash-flow waterfall
monthlySold comps — $/sqft
last 12 mo · ≤1 miLoading sold comps…