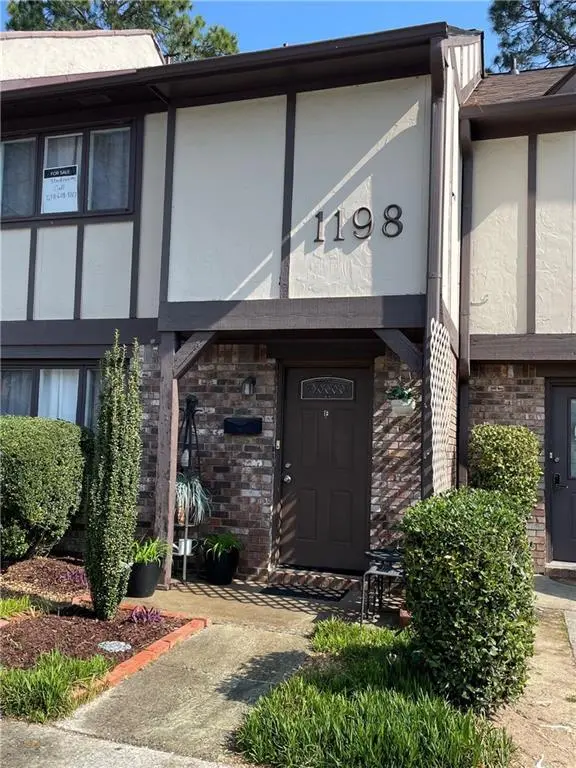
1198 Ashborough Ter Unit F · Marietta, GA
Flood risk 1/10 · Minimal
- FEMA flood zone
- X (unshaded)
- Chance of flooding over 30 yrs
- 0.0%
- Est. flood insurance / yr
- $507 – $1,088
Fire risk 1/10 · Minimal
- Est. fire insurance / yr
- $963 – $1,789
Heat risk 6/10 · Moderate
- Hot days now (above 103°F)
- 7 days/yr
- Hot days in 30 yrs
- 19 days/yr
Wind risk 4/10 · Minor
- Chance of severe wind over 30 yrs
- 18.0%
Air-quality risk 4/10 · Minor
- Unhealthy air days now
- 6 days/yr
- Unhealthy air days in 30 yrs
- 7 days/yr
Risk factors via First Street. Map © Google.
Why this score? — see what drove the D grade
The composite is a weighted blend of 9 inputs, each scored 0–100. Each bar is that input's sub-score; the figure is the points it added to the 100-point composite (weight × sub-score).
- ARV discount +15.0/15.0
- Cash flow +7.6/30.0
- 1% rule +5.4/10.0
- Livability +4.2/5.0
- Schools +3.8/10.0
- Rent growth +3.5/5.0
- Condition / age +2.5/5.0
- DSCR +1.8/10.0
- Appreciation +0.0/10.0
$184,000
🖨 Deal sheet (PDF) 📄 Offer letter ✓ Due diligence
Listing remarks
This excellently located condominium has recently been updated with fresh paint, new stainless steel dishwasher, new ceiling fan/lights, and new tile backsplash in kitchen. The gourmet kitchen boasts a quartz countertop, breakfast bar, stainless steel appliances, and gas stove/range. Combined family/dining room features double French doors overlooking private, fenced-in back yard with astro-turf type lawn for year-round enjoyment. Quartz vanity tops in both bathrooms. Washer and dryer included. HOA fee includes both water and gas so the only utility owner pays is electricity. Two assigned parking spaces near front door. This family-friendly community offers a swimming pool, tennis courts, a
Key facts
- Quartz countertop
- Gourmet kitchen
- Gas stove
Tags
Property features AI
Finance
- HOA & community: Monthly association fee of $450; Association covers gas, grounds and structure maintenance, pest control, reserve fund, sewer, pool, tennis, trash and water; Community amenities include clubhouse, pool, tennis courts, playground; near schools and shopping; homeowners association
Exterior
- Parking: Two assigned parking spaces (kitchen level)
- Utilities: Public water; Public sewer; Electricity available; Natural gas available; Cable available; Phone available; Underground utilities
- Home design: Condominium; Two levels; Attic space
- Construction: Brick and stucco construction; Composition roof; Slab foundation; Updated/remodeled condition
- Exterior features: Private entrance; Enclosed patio; Patio; Back yard with wood fencing
Interior
- Kitchen: Breakfast bar; Stone countertops; Cabinets; Dishwasher; Gas range; Refrigerator; Disposal
- Bedrooms: Oversized master; Three upper-level bedrooms
- Flooring: Ceramic tile; Luxury vinyl
- Bathrooms: One full bathroom (upper level) with tub/shower combo; One half bathroom (main level); Master bath with double vanity
- Heating & cooling: Natural gas heating; Central air conditioning; Ceiling fans
- Interior features: Disappearing attic stairs; Double vanity; Aluminum window frames; 2+ common walls (townhome/condo setting), no one above or below
- Laundry & utility: Main level laundry closet in hall; Washer and dryer included; Gas dryer hookup; Gas water heater
Neighborhood map
What this means for you Summary
Snapshot
- This is a 3-bed/1.5-bath condo listed at $184k.
Deal economics
- At list price, monthly cash flow is $-217 ($-3k/yr) — negative.
- To cash-flow at today's rent, offer at most $153k (17.0% below list).
- Meets the 1% rule at list price ($2k rent vs $184k).
- Recommended offer: $153k (17.0% below list) — sets the bar for cash-flow.
- Cap rate 4.9% vs local median 3.1% in Marietta — top-decile yield for the area; either an underpriced asset or a hidden risk that comps aren't pricing in. Stress-test before assuming the spread holds.
Location & tenants
- Location reads 83/100 on livability (#7 in GA, #976 nationally) — a professional / high-income tenant draw. Strengths: amenities A+, commute A+, housing A+.
- Cobb County (suburban): math 39% / reading 45% proficiency, ranked #25 of 174 in GA (top 14%) — families likely to look elsewhere, expect single-tenant / working-renter base with shorter leases.
- Zoned schools: Powers Ferry Elementary School (math 22% / reading 22%, grade F, #810 of 1,228 statewide, top 69%, 413 students, 79% FRL); East Cobb Middle School (math 25% / reading 29%, grade F, #271 of 470 statewide, top 60%, 1,334 students, 57% FRL); Wheeler High School (math 25% / reading 36%, grade F, #131 of 424 statewide, top 31%, 2,375 students, 39% FRL) — zoned schools average 58% FRL vs 39% district-wide (20 pts higher); higher-poverty schools than district average — tighter screening recommended.
- Zoned-school proficiency averages 26% at this address vs 42% district-wide (-16 pts) — the specific schools serving this property underperform the Cobb County average; the district grade overstates school quality for this exact location.
- Market conditions: Rents rising (+3.9%/yr); 243 active listings in the ZIP; 40 comparable units currently listed for rent nearby; rentals at typical pace (median 17d on market — plan ~3-4 weeks tenant-placement turnaround); solid renter incomes; 1,625 units permitted in Cobb County in 2024 (389 in 5+ unit buildings).
Forward outlook
- Local home prices are declining (-3.0%/yr); year-one equity from $1k of loan paydown is wiped out by about $6k of value loss. Plan a longer hold.
- Cobb County population projected at +33% by 2050 — long-run rental-demand tailwind backs the buy-and-hold thesis.
Negotiation context
- Only 10 days on market — expect competitive offers; lowballing is unlikely to land.
- 5 sale attempts since 2y ago with the ask held roughly flat each time — persistent listings suggest the price (not the market) is what's stuck; bring a comps-based counter.
- Current owner paid $130k; 42% above their basis — modest negotiation headroom, anchor on the comps not their cost.
Risks & watch-outs
- Watch-outs: HOA is 24% of rent.
- Climate carrying-cost: extreme-heat days projected 7→19/yr by 2055 (HVAC capex compounding) — expect insurance premiums to compound above CPI over the hold.
Questions for the listing agent
- What do current leases actually rent for vs. the listed asking? Can we see a recent rent roll and the last 12 months of T-12 income?
- Built in 1973 — when were the roof, HVAC, electrical panel, plumbing, and water heater last replaced?
- What does the HOA fee cover, when was the last increase, and are there any pending special assessments or reserve-fund shortfalls?
- Any open or pending special assessments — roof, HVAC, plumbing, elevator, façade? What's the per-unit balance and payoff schedule, and is the seller paying it off at close or rolling it to the buyer?
- Is there a deadline driving the sale (1031 exchange, divorce, estate, relocation)? That informs how much negotiation room exists.
- Schools are B-rated — typically a magnet for longer-tenancy family renters. What's the average tenant stay here, and is there a school-zone premium baked into asking?
- The area grade is low — what's the realistic commute time and amenity access for the typical tenant pool here? Any planned neighborhood developments (good or bad) we should know about?
- What's the average days-on-market for RENTAL listings here right now (not sales)? A rising rental-DOM trend means longer vacancies and softer asking-rent achievability than the comps imply.
- What's the recent tenant-quality profile in this submarket — average credit score on applications, eviction rate, late-payment / NSF rate, and stable-employment percentage? A property-management company in the area should have these aggregated.
- How much new apartment / multifamily construction is in the pipeline within 1–3 miles? Heavy new supply (>2% of stock underway) typically softens rents 12–24 months out; light construction supports rent growth.
Investment metrics
- 1% rule
- 1.04% ✓
- Cap rate
- 4.88%
- Cash-on-cash
- -5.05%
- DSCR
- 0.78
- GRM
- 8.0
CMA / ARV
- ARV (median comp)
- $328,449
- List price
- $184,000
- Delta
- -48.55%
- Verdict
- UNDERPRICED
- Comps
- 1 within 2.0 mi
Projected returns pro-forma
-3.0% appreciation · 3.91% rent growth · sell at horizon
- IRR
- -23.2%
- Equity multiple
- 0.19×
- Total profit
- $-41,554
- Equity at exit
- $27,435
- IRR
- -14.4%
- Equity multiple
- 0.12×
- Total profit
- $-45,361
- Equity at exit
- $15,909
Cash invested: $51,520 (down + closing). Projections, not guarantees.
Landlord ↔ Tenant lean methodology
- Overall (STATE)
- 90 Strongly Landlord-Friendly
- State Georgia
- 90 Strongly Landlord-Friendly · R+3
- County
- — inherits STATE
- City
- — inherits STATE
ZIP-level market 30067
- Rents YoY
- 3.9%
- Active inventory
- 243
- Price-to-rent
- 8.0×
Monthly cashflow live
- Estimated rent
- $1,905 high interval (Pro) →
- Mortgage (P&I)
- −$965
- Tax est. 1.5%
- −$230 /mo · $2,760/yr
- Insurance
- −$77
- HOA
- −$450
- Vacancy / Maint / Mgmt
- −$400
- Net cashflow
- $-217
Break-even live
Sensitivity live
| Price | -10% $-90 | -5% $-153 | +0% $-217 | +5% $-280 | +10% $-344 |
|---|---|---|---|---|---|
| Rent | -10% $-367 | -5% $-292 | +0% $-217 | +5% $-141 | +10% $-66 |
| Rate | -1.0pp $-124 | -0.5pp $-170 | base $-217 | +0.5pp $-264 | +1.0pp $-313 |
UW: 25.0% down · 7.5% · 30yr · 1.5% tax · 5.0% vac · 8.0% maint · 8.0% mgmt
Financing live
Cash to close
- Down payment
- $46,000
- Closing costs
- $5,520
- Reserves months
- —
- Total cash needed
- —
Loan-product check · same deal, 3 products live
Conventional
25% down · 7.5% · 30yr
- Down + closing
- —
- Monthly P&I
- —
- Monthly cashflow
- —
- DSCR
- —
- Eligible?
- —
Personal DTI + credit; lowest rate.
DSCR
20% down · 8.5% · 30yr
- Down + closing
- —
- Monthly P&I
- —
- Monthly cashflow
- —
- DSCR
- —
- Eligible?
- —
No personal income docs; deal must DSCR.
Hard money
10% down · 12.0% · 12mo
- Down + closing
- —
- Monthly P&I
- —
- Monthly cashflow
- —
- DSCR
- —
- Eligible?
- —
Short-term bridge; refi at stabilization.
Rent comps 40 comps
| Address | Beds | Baths | Sqft | Rent | $/sqft | DOM | Units | Dist |
|---|---|---|---|---|---|---|---|---|
| 1981 Hidden Glen Dr SE Marietta, GA | 1.0–4.0 | 1.0–2.0 | 1080 | $1,454 | $1.35 | 0d | 33 | 0.19mi |
| 750 Franklin Gtwy SE Marietta, GA | 1.0–3.0 | 1.0–2.0 | 1012 | $1,949 | $1.92 | 3d | 14 | 0.39mi |
| 860 Franklin Gtwy SE Marietta, GA | 1.0–3.0 | 1.0–2.0 | 1025 | $1,850 | $1.80 | 3d | 14 | 0.55mi |
| 991 Wylie Rd SE Marietta, GA | 1.0–3.0 | 1.0–2.0 | 938 | $1,753 | $1.87 | 0d | 33 | 0.58mi |
| 730 Franklin Gtwy SE Marietta, GA | 1.0–2.0 | 1.0–2.0 | 1160 | $1,756 | $1.51 | 17d | 16 | 0.61mi |
| 720 Franklin Gtwy SE Marietta, GA | 1.0–3.0 | 1.0–2.0 | 1137 | $2,297 | $2.02 | 0d | 15 | 0.71mi |
| 730 Franklin Rd Unit A05 Marietta, GA | 2.0 | 2.0 | 1228 | $1,425 | $1.16 | 13d | 1 | 0.72mi |
| 707 Franklin Gtwy SE Marietta, GA | 1.0–3.0 | 1.0–2.5 | 1150 | $2,226 | $1.94 | 3d | 24 | 0.82mi |
| 1808 Augusta Dr SE Marietta, GA | 2.0 | 1.0 | 1097 | $1,545 | $1.41 | 0d | 1 | 0.87mi |
| 1603 Augusta Dr SE Marietta, GA | 4.0 | 2.0 | 1350 | $850 | $0.63 | 45d | 1 | 0.88mi |
| 1113 Powers Ferry Pl SE Marietta, GA | 3.0 | 1.0–2.5 | 1109 | $2,149 | $1.94 | 0d | 38 | 0.88mi |
| 3500 Windcliff Dr SE Marietta, GA | 1.0–2.0 | 1.0–2.0 | 829 | $1,553 | $1.87 | 0d | 58 | 0.92mi |
| 1716 Twin Brooks Dr SE Marietta, GA | 2.0 | 2.5 | 1280 | $1,670 | $1.30 | 23d | 1 | 0.94mi |
| 703 Twin Brooks Ct SE Marietta, GA | 2.0 | 2.5 | 1280 | $1,799 | $1.41 | 45d | 1 | 0.94mi |
| 604 Twin Brooks Way SE Marietta, GA | 3.0 | 2.0 | 1750 | $2,350 | $1.34 | 45d | 1 | 0.97mi |
| 2120 Meadowbrook Ln SE Marietta, GA | 4.0 | 1.5 | 1660 | $2,275 | $1.37 | 45d | 1 | 1.02mi |
| 932 Exposition Pte Marietta, GA | 3.0 | 2.5 | 1824 | $2,600 | $1.43 | 45d | 1 | 1.03mi |
| 578 Oakland Dr SE Marietta, GA | 3.0 | 2.0 | 1438 | $2,000 | $1.39 | 45d | 1 | 1.05mi |
| 108 Augusta Dr SE Marietta, GA | 3.0 | 2.0 | 1451 | $1,925 | $1.33 | 26d | 1 | 1.05mi |
| 2560 Delk Rd SE Marietta, GA | 1.0–4.0 | 1.0–2.0 | 1297 | $1,592 | $1.23 | 0d | 13 | 1.06mi |
| 586 Saint James Walk SE Marietta, GA | 2.0 | 2.5 | 1700 | $5,500 | $3.24 | 0d | 1 | 1.07mi |
| 481 Virginia Pl SE Marietta, GA | 2.0 | 1.0 | 1300 | $1,650 | $1.27 | 45d | 1 | 1.12mi |
| 1716 Terrell Mill Rd SE Marietta, GA | 1.0–3.0 | 1.0–2.0 | 1209 | $1,955 | $1.62 | 0d | 9 | 1.13mi |
| 2106 Palmyra Dr SE Marietta, GA | 2.0 | 2.0 | 1320 | $1,650 | $1.25 | 21d | 1 | 1.13mi |
| 1717 Waterfall Village Dr SE Marietta, GA | 1.0–2.0 | 1.0 | 900 | $1,450 | $1.61 | 0d | 7 | 1.14mi |
| 1914 Powers Ferry Trce SE Marietta, GA | 2.0 | 2.0 | 1312 | $1,700 | $1.30 | 5d | 1 | 1.18mi |
| 2035 Powers Ferry Trce SE Marietta, GA | 2.0 | 2.0 | 1312 | $2,000 | $1.52 | 45d | 1 | 1.19mi |
| 901 Ivy Green Ln SE Marietta, GA | 2.0 | 2.0 | 1286 | $1,650 | $1.28 | 45d | 1 | 1.19mi |
| 2575 Delk Rd SE Marietta, GA | 1.0–3.0 | 1.0–2.0 | 1255 | $2,230 | $1.78 | 0d | 26 | 1.20mi |
| 441 Big John Trl SE Marietta, GA | 4.0 | 2.0 | 1827 | $2,500 | $1.37 | 45d | 1 | 1.21mi |
| 203 Ivy Green Ln SE Marietta, GA | 2.0 | 2.0 | 1286 | $1,700 | $1.32 | 26d | 1 | 1.26mi |
| 204 Ivy Green Ln SE Marietta, GA | 2.0 | 2.0 | 1745 | $1,900 | $1.09 | 26d | 1 | 1.26mi |
| 705 Powers Ferry Rd Marietta, GA | 3.0 | 1.0–2.0 | 925 | $1,872 | $2.02 | 0d | 14 | 1.26mi |
| 2650 Bentley Rd SE Marietta, GA | 2.0–3.0 | 1.5–2.5 | 1600 | $2,130 | $1.33 | 0d | 18 | 1.27mi |
| 106 Ivy Green Ln SE Unit 106 Marietta, GA | 2.0 | 2.0 | 1750 | $2,550 | $1.46 | 45d | 1 | 1.28mi |
| 596 Lullingstone Dr SE Marietta, GA | 3.0 | 2.5 | 1862 | $2,570 | $1.38 | 19d | 1 | 1.29mi |
| 2703 Delk Rd SE Marietta, GA | 1.0–2.0 | 1.0–2.0 | 1077 | $1,689 | $1.57 | 0d | 12 | 1.30mi |
| 2696 Greentree Dr SE Marietta, GA | 2.0 | 1.5 | 1372 | $2,000 | $1.46 | 12d | 1 | 1.30mi |
| 1648 Raleigh Cir SE Marietta, GA | 2.0 | 2.0 | 1166 | $1,700 | $1.46 | 19d | 1 | 1.36mi |
| 651 Inglis Dr SE Marietta, GA | 3.0 | 2.0 | 1392 | $2,695 | $1.94 | 45d | 1 | 1.44mi |
HOA detail condo
- Monthly dues
- $450 · $5,400/yr
- Likely covers
- watergaselectricpoolparking
- Assessments
- None detected in remarks — confirm with the listing agent.
Listing history 25 events
-
2026-06-21days on market $184,000 Active 10 DOM
-
2026-06-18days on market $184,000 Active 7 DOM
-
2026-06-17days on market $184,000 Active 6 DOM
-
2026-06-16days on market $184,000 Active 5 DOM
-
2026-06-15days on market $184,000 Active 4 DOM
-
2026-06-13days on market $184,000 Active 2 DOM
-
2026-06-13pricedays on market $184,000 Active 1 DOM
-
2026-04-26price $169,000 1461-char remark
-
2026-04-20price $178,000 1461-char remark
-
2026-04-17price $185,000 1461-char remark
-
2026-03-26$195,000 Active 1461-char remark
-
2025-04-22historical
-
2025-04-22historical
-
2025-04-18status Back On Market
-
2025-04-18status Active
-
2025-03-05status Under Contract
-
2025-03-05historical Active Under Contract
-
2025-02-04price $196,500
-
2025-02-04price $196,500
-
2024-11-08$210,000 Active
-
2024-11-07historical
-
2024-11-07$210,000 New
-
2018-07-16soldstatus $130,000
-
2001-02-05soldstatus $85,000
-
1991-09-30soldstatus $44,500
ⓘ Source: listings_history table (triggers on properties + properties_extension) + one-shot
backfill from property_details.listing_events for pre-trigger history.
Climate risk First Street
- Flood 1/10 Low FEMA zone X (unshaded) · 0% chance over 30 yrs
- Wildfire 1/10 Low
- Heat 6/10 Major 7 d/yr ≥103°F today · 19 d/yr by 30 yrs out
- Wind 4/10 Moderate 18% chance of damaging wind over 30 yrs
- Air quality 4/10 Moderate 6 unhealthy d/yr today · 7 by 30 yrs out
Nearby sold comps map
Loading sold comps map…
Walkable amenities ~0.75 mi
Loading nearby amenities…
Taxation est. · year 1
- Rental income
- $22,859
- − Mortgage interest
- −$10,307
- − Property taxes
- −$2,760
- − Insurance
- −$920
- − Repairs & maintenance
- −$1,829
- − Management
- −$1,829
- − HOA
- −$5,400
- − Depreciation
- −$5,353
- Taxable loss
- −$5,538
- Est. tax savings @ 24.0%
- +$1,329
- After-tax cash flow
- $-1,271/yr
For passive investors: Depreciation is non-cash, so a rental often shows a tax loss while cash-flowing — sheltering income. Rental losses are passive: they offset passive income freely, and up to $25,000/yr can offset ordinary (W-2) income if you actively participate and your MAGI is under $100k (phasing out to $0 by $150k); unused losses carry forward. On sale, claimed depreciation is recaptured at up to 25%, and gains may owe capital-gains tax (a 1031 exchange can defer both). Figures are a year-1 estimate at your 24.0% rate — not tax advice; consult a CPA.
Schools (NCES district)
- District
- Cobb County
- NCES district ID
- 1301290
- Math proficiency
- 39% ▼ -15.00%
- Reading proficiency
- 45% ▼ -10.00%
- Median HH income
- $68,845
- Composite
- 37.93/100
- National rank
- #4308
- State rank
- #25 of 174 in GA
Livability — Marietta
- Score
- 83/100
- State rank
- #7
- US rank
- #976
Category grades
Schools grade is shown separately in the Schools card above.
Census & demographics
- County
- Cobb County · 777,758 people
- City population
- 331,369
- Metro
- Atlanta-Sandy Springs-Alpharetta, GA
- Population (ZIP)
- 47,271
- Household income
- $83,568
- Rent vs Own
- Severe rent burden
- 2845.0
Population outlook (Cobb County) Hauer SSP2
- Today (2025)
- 868,385 people
- By 2030
- 929,614 · +7.1%
- By 2040
- 1,047,533 · +20.6%
- By 2050
- 1,155,537 · +33.1%
- By 2075
- 1,405,030 · +61.8%
- By 2100
- 1,555,058 · +79.1%
Race, ethnicity, and origin ACS 2023
- Neighborhood character
- Highly diverse neighborhood (Simpson 0.73)
- Race & ethnicity
- White 42% Black 26% Hispanic / Latino 14% Two or more races 12% Asian 8%
- Hispanic origin (detail)
- Mexican 5% Puerto Rican 2%
- Common ancestry
- Estonian 7% Slovak 2% Romanian 2%
- Foreign-born
- 25% · Canada, Jamaica, South Korea
- Languages at home
- 69% English-only · Other Indo-European 11% Spanish 11% Other Asian/Pacific 2%
Political lean MEDSL · Cobb
- 2024 margin
- D (+14.9) · D 56.9% · R 42.0% · Other 1.1%
- 2008→2024 swing
- +24.3pp toward D · 2008: -9.4pp · 2024: 14.9pp
- All cycles
- 2024: D+14.9 2020: D+14.3 2016: D+2.1 2012: R+12.6 2008: R+9.4
Not yet ingested
- Civics
- —
Market trends
- HPI YoY
- ▼ -310.80%
- Current HPI
- 251.5104
- Rent YoY
- ▲ 3.91%
- Metro
- Atlanta-Sandy Springs-Alpharetta, GA
- State GDP YoY
- ▲ 2.66%
- F500 in state
- 28
Industry mix (Fortune 500 HQ in GA)
| Industry | F500 HQs | Revenue |
|---|---|---|
| Paper / Packaging | 2 | $29B |
|
||
| Retail | 1 | $160B |
|
||
| Transportation / Logistics | 1 | $91B |
|
||
| Airlines | 1 | $62B |
|
||
| Consumer Goods | 1 | $47B |
|
||
| Utilities | 1 | $25B |
|
||
Price history
+313.5% since first listed15 events — show timeline
- 2026-06-10 Listed $184,000 FMLS
- 2025-04-22 Listing Removed — FMLS
- 2025-04-22 Listing Removed — GAMLS
- 2025-04-18 Relisted — GAMLS
- 2025-04-18 Relisted — FMLS
- 2025-03-05 Pending — GAMLS
- 2025-03-05 Contingent — FMLS
- 2025-02-04 Price Changed $196,500 FMLS
- 2025-02-04 Price Changed $196,500 GAMLS
- 2024-11-08 Listed $210,000 FMLS
- 2024-11-07 Coming Soon — FMLS
- 2024-11-07 Listed $210,000 GAMLS
- 2018-07-16 Sold (Public Records) $130,000 Public Records
- 2001-02-05 Sold (Public Records) $85,000 Public Records
- 1991-09-30 Sold (Public Records) $44,500 Public Records
Property tax history
-2.7%/yrLatest (2025): $311 · -0.5% YoY. Source: county tax records.
Cash-flow waterfall
monthlySold comps — $/sqft
last 12 mo · ≤1 miLoading sold comps…