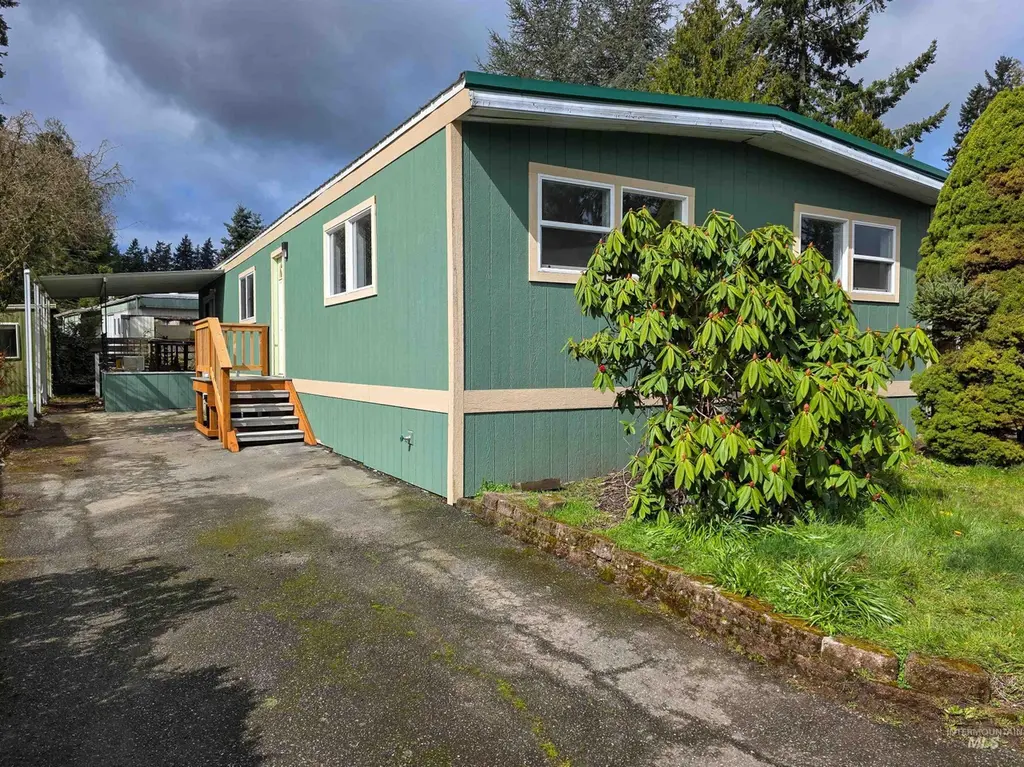
5220 176th St SW #69 · Lynnwood, WA
Flood risk No data
- FEMA flood zone
- —
- Chance of flooding over 30 yrs
- —
- Est. flood insurance / yr
- —
Fire risk No data
- Est. fire insurance / yr
- —
Heat risk No data
- Hot days now (above threshold)
- —
- Hot days in 30 yrs
- —
Wind risk No data
- Chance of severe wind over 30 yrs
- —
Air-quality risk No data
- Unhealthy air days now
- —
- Unhealthy air days in 30 yrs
- —
Risk factors via First Street. Map © Google.
Why this score? — see what drove the C+ grade
The composite is a weighted blend of 9 inputs, each scored 0–100. Each bar is that input's sub-score; the figure is the points it added to the 100-point composite (weight × sub-score).
- Cash flow +30.0/30.0
- 1% rule +10.0/10.0
- DSCR +10.0/10.0
- Schools +5.4/10.0
- Livability +3.9/5.0
- Rent growth +2.8/5.0
- Condition / age +2.5/5.0
- ARV discount +0.0/15.0
- Appreciation +0.0/10.0
$159,999
🖨 Deal sheet 📄 Offer letter ✓ Due diligence
Listing remarks MLS
Welcome to this newly updated home in Kingsbury West, an active 55+ community! This 2 bedroom 2 bathroom manufactured home is sure to go fast. Completely renovated and brought back to life this bright, welcoming home features custom kitchen cabinets with soft close doors and drawers, granite countertops, tile and laminate flooring, tankless on demand water heater, all new lighting, the list goes on. Don't forget about the ductless mini splits that will keep you comfortable all year long! Residents may also rent the clubhouse to host events and are invited to and encouraged to attend the "community" hosted potlucks. Lot rent is $972/mo and includes W/ S/G.
Key facts
- Ductless mini splits
- Granite countertops
- Built 1969
Tags
Neighborhood map
What this means for you Summary
Snapshot
- This is a 3-bed/2.0-bath manufactured listed at $160k.
Deal economics
- At list price, monthly cash flow is $981 ($12k/yr) — positive.
- The deal already cash-flows at list — no discount required.
- Meets the 1% rule at list price ($2k rent vs $160k).
- Recommended offer: $150k (6.0% below list) — sets the bar for market timing.
- Cap rate 13.7% vs local median 2.2% in Lynnwood — top-decile yield for the area; either an underpriced asset or a hidden risk that comps aren't pricing in. Stress-test before assuming the spread holds.
Location & tenants
- Location reads 77/100 on livability (#150 in WA, #3,226 nationally) — a middle-class / working-renter tenant base. Strengths: commute A+, health & safety A+, employment A; Watch: crime F, cost of living F.
- Edmonds School District (suburban): math 54% / reading 65% proficiency, ranked #53 of 291 in WA (top 18%) — acceptable for families but not a draw, mixed tenant base, ~2y average lease.
- Market conditions: Rents rising (+1.4%/yr); 173 active listings in the ZIP; 40 comparable units currently listed for rent nearby; rentals leasing fast (median 11d on market — plan ~1-2 weeks tenant-placement turnaround); solid renter incomes; 3,982 units permitted in Snohomish County in 2024 (1,492 in 5+ unit buildings).
Forward outlook
- Local home prices are declining (-3.0%/yr); year-one equity from $1k of loan paydown is wiped out by about $5k of value loss. Plan a longer hold.
- Snohomish County population projected at +30% by 2050 — long-run rental-demand tailwind backs the buy-and-hold thesis.
- At projected returns (-3.0% appreciation + 1.4% rent growth), your $45k cash investment doubles in ~5 years — after that, you're playing with house money.
Negotiation context
- It's been on market 68 days — a 6% lower offer ($150k) is reasonable based on typical stale-listing flexibility.
- 3 sale attempts since 16y ago with the ask held roughly flat each time — persistent listings suggest the price (not the market) is what's stuck; bring a comps-based counter.
- Current owner paid $12k; list at $160k implies a 1233% gain — meaningful room to come down on a strong offer.
Questions for the listing agent
- It's been on market 68 days. Have you received any prior offers? Is the seller open to a 6% concession, seller financing, or rate buy-down credit?
- Built in 1969 — when were the roof, HVAC, electrical panel, plumbing, and water heater last replaced?
- Why hasn't it sold? Are there any deal-killer items the seller is aware of (foundation, flood, title, zoning, code violations)?
- Is there a deadline driving the sale (1031 exchange, divorce, estate, relocation)? That informs how much negotiation room exists.
- Crime grade is F in this area — have there been break-ins, vandalism, or insurance claims at this property in the last 3 years? What carrier currently insures it and at what premium?
- What's the average days-on-market for RENTAL listings here right now (not sales)? A rising rental-DOM trend means longer vacancies and softer asking-rent achievability than the comps imply.
- What's the recent tenant-quality profile in this submarket — average credit score on applications, eviction rate, late-payment / NSF rate, and stable-employment percentage? A property-management company in the area should have these aggregated.
- How much new for-sale + rental construction is in the pipeline within 1–3 miles? Heavy new supply typically softens prices + rents 12–24 months out; constrained supply supports both.
Investment metrics
- 1% rule
- 1.53% ✓
- Cap rate
- 13.65%
- Cash-on-cash
- 26.29%
- DSCR
- 2.17
- GRM
- 5.4
CMA / ARV
- ARV (median comp)
- $135,550
- List price
- $159,999
- Delta
- 18.04%
- Verdict
- OVERPRICED
- Comps
- 7 within 1.0 mi
Show comp detail 9 sales within ~0.75 mi
| Address | Dist | Beds/Ba | Sqft | Sold | Price | $/sf | Match |
|---|---|---|---|---|---|---|---|
| 5220 176th St SW #9 | 0.00mi | 2/2.0 (-1) | 1,336 (-1%) | 12mo | $73,800 | $55 | 84 |
| 5220 176 St SW #76 | 0.00mi | 2/2.0 (-1) | 1,436 (+7%) | 2mo | $156,000 | $109 | 82 |
| 5220 176th St SW #14 | 0.00mi | 2/2.0 (-1) | 1,330 (-1%) | 15mo | $83,500 | $63 | 81 |
| 5220 176TH St SW #10 | 0.00mi | 3/2.0 | 1,464 (+9%) | 12mo | $120,000 | $82 | 75 |
| 5220 176th St SW #12 | 0.00mi | 2/1.5 (-1) | 1,200 (-11%) | 12mo | $95,000 | $79 | 65 |
| 5220 176th St SW #50 | 0.00mi | 2/2.0 (-1) | 1,200 (-11%) | 22mo | $99,900 | $83 | 58 |
| 4515 176th St SW #33 | 0.47mi | 3/2.0 | 1,248 (-7%) | 14mo | $157,000 | $126 | 54 |
| 18501 52nd Ave W #83 | 0.52mi | 2/2.0 (-1) | 1,260 (-6%) | 10mo | $135,000 | $107 | 52 |
| 17408 44th Ave W #32 | 0.44mi | 3/2.0 | 1,188 (-12%) | 11mo | $225,000 | $189 | 51 |
Match score weights: distance 35% · size 25% · config 20% · recency 20%. Top-matched comps best support the ARV.
Projected returns pro-forma
-3.0% appreciation · 1.37% rent growth · sell at horizon
- IRR
- 18.3%
- Equity multiple
- 1.73×
- Total profit
- $32,567
- Equity at exit
- $23,856
- IRR
- 25.6%
- Equity multiple
- 3.07×
- Total profit
- $92,922
- Equity at exit
- $13,834
Cash invested: $44,800 (down + closing). Projections, not guarantees.
Landlord ↔ Tenant lean methodology
- Overall (STATE)
- 28 Tenant-Leaning
- State Washington
- 28 Tenant-Leaning · D+8
- County
- — inherits STATE
- City
- — inherits STATE
ZIP-level market 98037
- Rents YoY
- 1.4%
- Active inventory
- 173
- Price-to-rent
- 5.4×
Monthly cashflow live
- Estimated rent
- $2,447 high interval (Pro) →
- Mortgage (P&I)
- −$839
- Tax from tax record
- −$46 /mo · $549/yr
- Insurance
- −$67
- HOA
- −$0
- Vacancy / Maint / Mgmt
- −$514
- Net cashflow
- $981
Break-even live
UW: 25.0% down · 7.5% · 30yr · 1.5% tax · 5.0% vac · 8.0% maint · 8.0% mgmt
Financing live
Cash to close
- Down payment
- $40,000
- Closing costs
- $4,800
- Reserves months
- —
- Total cash needed
- —
Loan-product check · same deal, 3 products live
Conventional
25% down · 7.5% · 30yr
- Down + closing
- —
- Monthly P&I
- —
- Monthly cashflow
- —
- DSCR
- —
- Eligible?
- —
Personal DTI + credit; lowest rate.
DSCR
20% down · 8.5% · 30yr
- Down + closing
- —
- Monthly P&I
- —
- Monthly cashflow
- —
- DSCR
- —
- Eligible?
- —
No personal income docs; deal must DSCR.
Hard money
10% down · 12.0% · 12mo
- Down + closing
- —
- Monthly P&I
- —
- Monthly cashflow
- —
- DSCR
- —
- Eligible?
- —
Short-term bridge; refi at stabilization.
Rent comps 40 comps
| Address | Beds | Baths | Sqft | Rent | $/sqft | DOM | Units | Dist |
|---|---|---|---|---|---|---|---|---|
| 4816 176th St SW Lynnwood, WA | 1.0–2.0 | 1.0–1.5 | 802 | $1,970 | $2.45 | 2d | 6 | 0.23mi |
| 4702 176th St SW Lynnwood, WA | 1.0–2.0 | 1.0 | 886 | $1,925 | $2.17 | 2d | 8 | 0.29mi |
| 5419 172nd Pl SW Lynnwood, WA | 3.0 | 2.0 | 980 | $2,895 | $2.95 | 24d | 1 | 0.36mi |
| 4502 176th St SW Unit 2 Lynnwood, WA | 2.0 | 2.0 | 1004 | $2,195 | $2.19 | 43d | 1 | 0.38mi |
| 4432 176th St SW Unit 3 Lynnwood, WA | 2.0 | 2.0 | 1004 | $2,195 | $2.19 | 43d | 1 | 0.41mi |
| 4432 176th St SW Unit 2 Lynnwood, WA | 2.0 | 2.0 | 1004 | $2,195 | $2.19 | 23d | 1 | 0.41mi |
| 18400 52nd Ave W Lynnwood, WA | 2.0 | 1.0 | 1092 | $1,995 | $1.83 | 43d | 1 | 0.42mi |
| 4428 176th St SW Unit 4 Lynnwood, WA | 2.0 | 2.0 | 1004 | $2,195 | $2.19 | 23d | 1 | 0.44mi |
| 5620 183rd St SW Lynnwood, WA | 1.0–2.0 | 1.0 | 787 | $2,075 | $2.63 | 2d | 2 | 0.48mi |
| 5624 183rd St SW Lynnwood, WA | 1.0–2.0 | 1.0 | 787 | $2,100 | $2.67 | 4d | 2 | 0.50mi |
| 17529 44th Ave W Lynnwood, WA | 2.0 | 1.0 | 1000 | $2,395 | $2.40 | 3d | 1 | 0.52mi |
| 17314 44th Ave W Unit C Lynnwood, WA | 2.0 | 1.5 | 1000 | $2,200 | $2.20 | 17d | 1 | 0.53mi |
| 18534 52nd Ave W Lynnwood, WA | 2.0 | 2.0 | 1100 | $2,295 | $2.09 | 1d | 1 | 0.56mi |
| 5707 186th Pl SW Unit 4-PLEX 1 Lynnwood, WA | 2.0 | 2.0 | 1000 | $2,135 | $2.13 | 24d | 1 | 0.58mi |
| 18606 52nd Ave W Lynnwood, WA | 2.0 | 2.0 | 1204 | $2,325 | $1.93 | 4d | 1 | 0.60mi |
| 5311 188th St SW Lynnwood, WA | 2.0 | 1.5 | 1004 | $2,500 | $2.49 | 43d | 1 | 0.65mi |
| 17619 62nd Pl W Lynnwood, WA | 3.0 | 1.0 | 1400 | $2,695 | $1.93 | 43d | 1 | 0.67mi |
| 16604 48th Ave W Lynnwood, WA | 1.0–3.0 | 1.0–2.0 | 890 | $2,550 | $2.87 | 2d | 9 | 0.70mi |
| 16908 River Rock Dr Lynnwood, WA | 3.0 | 2.0 | 1701 | $3,750 | $2.20 | 43d | 1 | 0.71mi |
| 16529 48th Ave W Unit A Edmonds, WA | 3.0 | 2.5 | 1529 | $3,500 | $2.29 | 24d | 1 | 0.77mi |
| 4516 188th St SW Lynnwood, WA | 3.0 | 1.0 | 1500 | $2,895 | $1.93 | 24d | 1 | 0.79mi |
| 16318 48th Ave W Edmonds, WA | 3.0 | 1.0 | 1780 | $2,850 | $1.60 | 17d | 1 | 0.89mi |
| 16308 52nd Ave W Unit 4 Edmonds, WA | 2.0 | 1.0 | 900 | $1,795 | $1.99 | 10d | 1 | 0.89mi |
| 18124 36th Ave W Lynnwood, WA | 1.0–2.0 | 1.0–2.0 | 821 | $2,155 | $2.62 | 2d | 8 | 1.01mi |
| 4525 164th St SW Lynnwood, WA | 2.0–3.0 | 1.0–2.0 | 1093 | $2,609 | $2.39 | 1d | 13 | 1.03mi |
| 18031 36th Ave W Lynnwood, WA | 1.0–2.0 | 1.0–2.0 | 760 | $2,186 | $2.88 | 2d | 6 | 1.05mi |
| 4217 164th St SW Unit A204 Lynnwood, WA | 3.0 | 2.0 | 1100 | $2,450 | $2.23 | 43d | 1 | 1.12mi |
| 18505 36th Ave W Lynnwood, WA | 1.0–2.0 | 1.0–2.0 | 776 | $2,356 | $3.04 | 1d | 9 | 1.15mi |
| 16419 Spruce Way Unit H4 Lynnwood, WA | 2.0 | 2.0 | 900 | $2,350 | $2.61 | 43d | 1 | 1.19mi |
| 16419 Spruce Way Lynnwood, WA | 2.0 | 2.0 | 946 | $2,550 | $2.70 | 1d | 1 | 1.19mi |
| 15914 44th Ave W Lynnwood, WA | 1.0–2.0 | 1.0–2.0 | 932 | $2,159 | $2.32 | 1d | 10 | 1.21mi |
| 3805 164th St SW Lynnwood, WA | 1.0–2.0 | 1.0–2.0 | 843 | $2,295 | $2.72 | 1d | 5 | 1.24mi |
| 19309 40th Ave W Lynnwood, WA | 2.0 | 1.0–1.5 | 707 | $2,580 | $3.65 | 43d | 3 | 1.25mi |
| 19801 50th Ave W Lynnwood, WA | 1.0–2.0 | 1.0 | 825 | $1,925 | $2.33 | 4d | 5 | 1.28mi |
| 3711 164th St SW Lynnwood, WA | 1.0–2.0 | 1.0–2.0 | 845 | $2,533 | $3.00 | 1d | 7 | 1.30mi |
| 16104 36th Ave W Lynnwood, WA | 1.0–2.0 | 1.0 | 761 | $2,099 | $2.76 | 2d | 6 | 1.32mi |
| 15700 44th Ave W Lynnwood, WA | 1.0–3.0 | 1.0–2.0 | 940 | $2,343 | $2.49 | 2d | 1 | 1.33mi |
| 19301 36th Ave W Lynnwood, WA | 2.0 | 1.5 | 1080 | $2,250 | $2.08 | 24d | 1 | 1.40mi |
| 16111 36th Ave W Unit D4 Lynnwood, WA | 3.0 | 4.0 | 1838 | $3,700 | $2.01 | 43d | 1 | 1.41mi |
| 4807 200th St SW Lynnwood, WA | 2.0–3.0 | 1.0 | 935 | $2,337 | $2.50 | 1d | 12 | 1.41mi |
Listing history 22 events
-
2026-06-18days on market $159,999 Active 68 DOM
-
2026-06-17days on market $159,999 Active 67 DOM
-
2026-06-16days on market $159,999 Active 66 DOM
-
2026-06-15days on market $159,999 Active 65 DOM
-
2026-06-13days on market $159,999 Active 63 DOM
-
2026-06-13days on market $159,999 Active 62 DOM
-
2026-06-09days on market $159,999 Active 59 DOM
-
2026-06-08days on market $159,999 Active 58 DOM
-
2026-06-07days on market $159,999 Active 57 DOM
-
2026-06-04days on market $159,999 Active 54 DOM
-
2026-06-03days on market $159,999 Active 53 DOM
-
2026-06-02days on market $159,999 Active 52 DOM
-
2026-06-01days on market $159,999 Active 51 DOM
-
2026-05-31days on market $159,999 Active 50 DOM
-
2026-04-11$159,999 Active 673-char remark
Show marketing remark (673 chars)
Welcome to this newly updated home in Kingsbury West, an active 55+ community! This 2 bedroom 2 bathroom manufactured home is sure to go fast. Completely renovated and brought back to life this bright, welcoming home features custom kitchen cabinets with soft close doors and drawers, granite countertops, tile and laminate flooring, tankless on demand water heater, all new lighting, the list goes on. Don't forget about the ductless mini splits that will keep you comfortable all year long! Residents may also rent the clubhouse to host events and are invited to and encouraged to attend the "community" hosted potlucks. Lot rent is $972/mo and includes W/ S/G.
-
2010-08-11soldstatus $12,000 Sold
-
2010-08-06status Pending
-
2010-07-27historical
-
2010-07-07status Active
-
2010-06-23historical
-
2010-06-14price $14,950
-
2010-06-03$17,950 Active
ⓘ Source: listings_history table (triggers on properties + properties_extension) + one-shot
backfill from property_details.listing_events for pre-trigger history.
Tax reassessment forecast WA · Resets to sale price
- Current annual tax
- $549 · $46/mo
- Projected year-2 tax
- $1,568 · $131/mo
- Expected delta
- +$1,019/yr (+$85/mo · 185.6%)
ⓘ Screening estimate from a state-policy table — verify with the county assessor before closing.
Nearby sold comps map
Loading sold comps map…
Walkable amenities ~0.75 mi
Loading nearby amenities…
Taxation est. · year 1
- Rental income
- $29,358
- − Mortgage interest
- −$8,962
- − Property taxes
- −$549
- − Insurance
- −$800
- − Repairs & maintenance
- −$2,349
- − Management
- −$2,349
- − Depreciation
- −$4,655
- Taxable income
- $9,695
- Est. tax owed @ 24.0%
- −$2,327
- After-tax cash flow
- $9,449/yr
For passive investors: Depreciation is non-cash, so a rental often shows a tax loss while cash-flowing — sheltering income. Rental losses are passive: they offset passive income freely, and up to $25,000/yr can offset ordinary (W-2) income if you actively participate and your MAGI is under $100k (phasing out to $0 by $150k); unused losses carry forward. On sale, claimed depreciation is recaptured at up to 25%, and gains may owe capital-gains tax (a 1031 exchange can defer both). Figures are a year-1 estimate at your 24.0% rate — not tax advice; consult a CPA.
Schools (NCES district)
- District
- Edmonds School District
- NCES district ID
- 5302400
- Math proficiency
- 54% ▼ -1.00%
- Reading proficiency
- 65% ▬ 0.00%
- Median HH income
- $67,451
- Composite
- 53.94/100
- National rank
- #3026
- State rank
- #53 of 291 in WA
Livability — Lynnwood
- Score
- 77/100
- State rank
- #150
- US rank
- #3226
Category grades
Schools grade is shown separately in the Schools card above.
Census & demographics
- Census place
- Lynnwood, WA
- County
- Snohomish County · 786,756 people
- City population
- 152,865
- Metro
- Seattle-Tacoma-Bellevue, WA
- Population (ZIP)
- 29,723
- Household income
- $107,281
- Rent vs Own
- Severe rent burden
- 1090.0
Population outlook (Snohomish County) Hauer SSP2
- Today (2025)
- 899,800 people
- By 2030
- 960,975 · +6.8%
- By 2040
- 1,074,447 · +19.4%
- By 2050
- 1,171,954 · +30.2%
- By 2075
- 1,384,849 · +53.9%
- By 2100
- 1,497,296 · +66.4%
Race, ethnicity, and origin ACS 2023
- Neighborhood character
- Diverse neighborhood (Simpson 0.69)
- Race & ethnicity
- White 48% Asian 23% Hispanic / Latino 15% Two or more races 12% Black 6%
- Hispanic origin (detail)
- Mexican 11%
- Common ancestry
- Portuguese 3% Italian 3% Slovak 2%
- Foreign-born
- 28% · Canada, China, South Korea
- Languages at home
- 65% English-only · Spanish 10% Chinese 4% Korean 4%
Political lean MEDSL · Snohomish
- 2024 margin
- D (+19.0) · D 57.8% · R 38.9% · Other 3.3%
- 2008→2024 swing
- +0.1pp no change · 2008: 18.9pp · 2024: 19.0pp
- All cycles
- 2024: D+19.0 2020: D+20.6 2016: D+16.6 2012: D+16.2 2008: D+18.9
Not yet ingested
- Civics
- —
Market trends
- HPI YoY
- ▼ -847.19%
- Current HPI
- 340.6136
- Rent YoY
- ▲ 1.37%
- Metro
- Seattle-Tacoma-Bellevue, WA
- State GDP YoY
- ▲ 4.65%
- F500 in state
- 22
Industry mix (Fortune 500 HQ in WA)
| Industry | F500 HQs | Revenue |
|---|---|---|
| Retail | 2 | $269B |
|
||
| Technology / Retail | 1 | $638B |
|
||
| Technology | 1 | $245B |
|
||
| Telecommunications | 1 | $38B |
|
||
| Food / Beverage | 1 | $36B |
|
||
| Automotive / Trucks | 1 | $34B |
|
||
Price history
+791.4% since first listed8 events — show timeline
- 2026-04-11 Listed $159,999 IMLS
- 2010-08-11 Sold (MLS) $12,000 NWMLS as Distributed by MLS Grid
- 2010-08-06 Pending — NWMLS as Distributed by MLS Grid
- 2010-07-27 Delisted — NWMLS as Distributed by MLS Grid
- 2010-07-07 Relisted — NWMLS as Distributed by MLS Grid
- 2010-06-23 Delisted — NWMLS as Distributed by MLS Grid
- 2010-06-14 Price Changed $14,950 NWMLS as Distributed by MLS Grid
- 2010-06-03 Listed $17,950 NWMLS as Distributed by MLS Grid
Property tax history
+10.1%/yrLatest (2026): $549 · +12.6% YoY. Source: county tax records.
Cash-flow waterfall
monthlySold comps — $/sqft
last 12 mo · ≤1 miLoading sold comps…