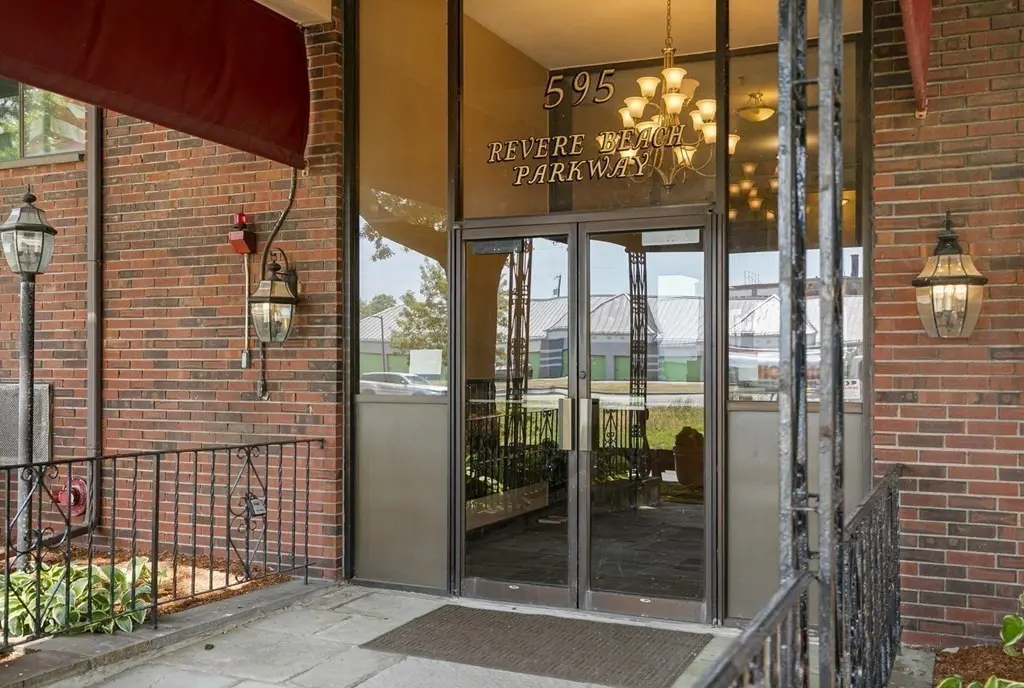
595 Revere Beach Pkwy #22 · Revere, MA
Flood risk No data
- FEMA flood zone
- —
- Chance of flooding over 30 yrs
- —
- Est. flood insurance / yr
- —
Fire risk No data
- Est. fire insurance / yr
- —
Heat risk No data
- Hot days now (above threshold)
- —
- Hot days in 30 yrs
- —
Wind risk No data
- Chance of severe wind over 30 yrs
- —
Air-quality risk No data
- Unhealthy air days now
- —
- Unhealthy air days in 30 yrs
- —
Risk factors via First Street. Map © Google.
Why this score? — see what drove the D grade
The composite is a weighted blend of 9 inputs, each scored 0–100. Each bar is that input's sub-score; the figure is the points it added to the 100-point composite (weight × sub-score).
- ARV discount +15.0/15.0
- Cash flow +8.1/30.0
- 1% rule +3.6/10.0
- Livability +3.6/5.0
- Rent growth +3.0/5.0
- Schools +2.5/10.0
- Condition / age +2.5/5.0
- DSCR +2.1/10.0
- Appreciation +0.0/10.0
$274,990
🖨 Deal sheet (PDF) 📄 Offer letter ✓ Due diligence
Listing remarks MLS
This oversized one-bedroom condo at Ambassador North Condominiums is ideal for both investors and owner-occupants. Conveniently located less than a mile from MBTA access at Beachmont Station (Blue Line), enjoy a commute to Downtown Boston in under 15 minutes. You’ll also love the proximity to shopping, dining, Revere Beach, and the exciting Suffolk Downs redevelopment. Situated on the second floor on the backside of the building away from the Parkway, of an elevator building, this unit offers a deeded parking space, private storage, and provides a path into ownership or investing to rent! With a little bit of love this unit will shine.
Key facts
- Deeded parking space
- Proximity to dining
- Mbta access
Tags
Neighborhood map
What this means for you Summary
Snapshot
- This is a 1-bed/1.0-bath condo listed at $275k.
Deal economics
- At list price, monthly cash flow is $-268 ($-3k/yr) — negative.
- To cash-flow at today's rent, offer at most $228k (17.2% below list).
- To meet the 1% rule (rent ≥ 1% of price), the offer needs to be $236k (14.2% below list).
- Recommended offer: $228k (17.2% below list) — sets the bar for cash-flow.
- Cap rate 5.1% vs local median 3.4% in Revere — top-decile yield for the area; either an underpriced asset or a hidden risk that comps aren't pricing in. Stress-test before assuming the spread holds.
Location & tenants
- Location reads 72/100 on livability (#122 in MA) — a middle-class / working-renter tenant base. Strengths: commute A+, health & safety A+, employment B+; Watch: schools D+, crime D+, amenities F.
- Revere (suburban): math 19% / reading 37% proficiency, ranked #261 of 302 in MA (top 86%) — low school quality limits family demand, transient renter base, plan for 1-2y turnover; 63% free/reduced lunch — lower-income household profile, screen leases tightly.
- Market conditions: Rents rising (+1.9%/yr); 104 active listings in the ZIP; 40 comparable units currently listed for rent nearby; rentals at typical pace (median 19d on market — plan ~3-4 weeks tenant-placement turnaround); solid renter incomes; 2,207 units permitted in Suffolk County in 2024 (1,961 in 5+ unit buildings).
- This rent runs 33% of the median local income ($87k/yr) — at the standard rent-burdened threshold; future hikes will face affordability resistance.
Forward outlook
- Local home prices are declining (-3.0%/yr); year-one equity from $2k of loan paydown is wiped out by about $8k of value loss. Plan a longer hold.
- Suffolk County population projected at +37% by 2050 — long-run rental-demand tailwind backs the buy-and-hold thesis.
Negotiation context
- It's been on market 58 days — a 3% lower offer ($267k) is reasonable based on typical stale-listing flexibility.
- 4 sale attempts since 29y ago with the ask held roughly flat each time — persistent listings suggest the price (not the market) is what's stuck; bring a comps-based counter.
- Current owner paid $90k; list at $275k implies a 206% gain — meaningful room to come down on a strong offer.
Questions for the listing agent
- What do current leases actually rent for vs. the listed asking? Can we see a recent rent roll and the last 12 months of T-12 income?
- It's been on market 58 days. Have you received any prior offers? Is the seller open to a 17% concession, seller financing, or rate buy-down credit?
- Built in 1976 — when were the roof, HVAC, electrical panel, plumbing, and water heater last replaced?
- What does the HOA fee cover, when was the last increase, and are there any pending special assessments or reserve-fund shortfalls?
- Any open or pending special assessments — roof, HVAC, plumbing, elevator, façade? What's the per-unit balance and payoff schedule, and is the seller paying it off at close or rolling it to the buyer?
- Is there a deadline driving the sale (1031 exchange, divorce, estate, relocation)? That informs how much negotiation room exists.
- Schools are D-rated, which usually means shorter tenancies and higher turnover. Who's the typical renter profile here, and what's been the actual vacancy rate?
- Crime grade is D in this area — have there been break-ins, vandalism, or insurance claims at this property in the last 3 years? What carrier currently insures it and at what premium?
- The area grade is low — what's the realistic commute time and amenity access for the typical tenant pool here? Any planned neighborhood developments (good or bad) we should know about?
- What's the average days-on-market for RENTAL listings here right now (not sales)? A rising rental-DOM trend means longer vacancies and softer asking-rent achievability than the comps imply.
- What's the recent tenant-quality profile in this submarket — average credit score on applications, eviction rate, late-payment / NSF rate, and stable-employment percentage? A property-management company in the area should have these aggregated.
- How much new apartment / multifamily construction is in the pipeline within 1–3 miles? Heavy new supply (>2% of stock underway) typically softens rents 12–24 months out; light construction supports rent growth.
Investment metrics
- 1% rule
- 0.86% ✗
- Cap rate
- 5.12%
- Cash-on-cash
- -4.18%
- DSCR
- 0.81
- GRM
- 9.7
CMA / ARV
- ARV (median comp)
- $338,618
- List price
- $274,990
- Delta
- -18.79%
- Verdict
- UNDERPRICED
- Comps
- 20 within 1.0 mi
Projected returns pro-forma
-3.0% appreciation · 1.91% rent growth · sell at horizon
- IRR
- -24.6%
- Equity multiple
- 0.17×
- Total profit
- $-64,010
- Equity at exit
- $41,002
- IRR
- -24.0%
- Equity multiple
- -0.13×
- Total profit
- $-87,271
- Equity at exit
- $23,776
Cash invested: $76,997 (down + closing). Projections, not guarantees.
Landlord ↔ Tenant lean methodology
- Overall (STATE)
- 20 Strongly Tenant-Friendly
- State Massachusetts
- 20 Strongly Tenant-Friendly · D+15
- County
- — inherits STATE
- City
- — inherits STATE
ZIP-level market 02151
- Rents YoY
- 1.9%
- Active inventory
- 104
- Price-to-rent
- 9.7×
Monthly cashflow live
- Estimated rent
- $2,359 high interval (Pro) →
- Mortgage (P&I)
- −$1,442
- Tax from tax record
- −$194 /mo · $2,329/yr
- Insurance
- −$115
- HOA
- −$381
- Vacancy / Maint / Mgmt
- −$495
- Net cashflow
- $-268
Break-even live
Sensitivity live
| Price | -10% $-112 | -5% $-190 | +0% $-268 | +5% $-346 | +10% $-424 |
|---|---|---|---|---|---|
| Rent | -10% $-454 | -5% $-361 | +0% $-268 | +5% $-175 | +10% $-82 |
| Rate | -1.0pp $-130 | -0.5pp $-198 | base $-268 | +0.5pp $-339 | +1.0pp $-412 |
UW: 25.0% down · 7.5% · 30yr · 1.5% tax · 5.0% vac · 8.0% maint · 8.0% mgmt
Financing live
Cash to close
- Down payment
- $68,748
- Closing costs
- $8,250
- Reserves months
- —
- Total cash needed
- —
Loan-product check · same deal, 3 products live
Conventional
25% down · 7.5% · 30yr
- Down + closing
- —
- Monthly P&I
- —
- Monthly cashflow
- —
- DSCR
- —
- Eligible?
- —
Personal DTI + credit; lowest rate.
DSCR
20% down · 8.5% · 30yr
- Down + closing
- —
- Monthly P&I
- —
- Monthly cashflow
- —
- DSCR
- —
- Eligible?
- —
No personal income docs; deal must DSCR.
Hard money
10% down · 12.0% · 12mo
- Down + closing
- —
- Monthly P&I
- —
- Monthly cashflow
- —
- DSCR
- —
- Eligible?
- —
Short-term bridge; refi at stabilization.
Rent comps 40 comps
| Address | Beds | Baths | Sqft | Rent | $/sqft | DOM | Units | Dist |
|---|---|---|---|---|---|---|---|---|
| 595 Revere Beach Pkwy #26 Revere, MA | 2.0 | 1.0 | 744 | $2,200 | $2.96 | 19d | 1 | 0.01mi |
| 220 Broadway Unit 1 Revere, MA | 1.0 | 1.0 | 723 | $2,300 | $3.18 | 25d | 1 | 0.41mi |
| 250 Broadway Revere, MA | 1.0–2.0 | 1.0–2.0 | 831 | $2,695 | $3.24 | 4d | 6 | 0.43mi |
| 20 Central Ave Unit C Revere, MA | 1.0 | 1.0 | 750 | $1,800 | $2.40 | 45d | 1 | 0.44mi |
| 39 Arlington Ave Revere, MA | 1.0 | 1.0 | 732 | $2,200 | $3.01 | 16d | 1 | 0.50mi |
| 39 Arlington Ave Unit 1 Revere, MA | 1.0 | 1.0 | 732 | $2,050 | $2.80 | 19d | 1 | 0.50mi |
| 22 Centennial Ave Unit 2 Revere, MA | 2.0 | 1.0 | 450 | $2,300 | $5.11 | 18d | 1 | 0.54mi |
| 38 Walnut Ave Apt 301 Revere, MA | 1.0 | 1.0 | 556 | $2,200 | $3.96 | 45d | 1 | 0.60mi |
| 38 Walnut Ave Unit 102 Revere, MA | — | 1.0 | 441 | $1,900 | $4.31 | 45d | 1 | 0.60mi |
| 13 Nahant Ave Revere, MA | 2.0 | 1.0 | 444 | $2,195 | $4.94 | 3d | 12 | 0.61mi |
| 39 Louis St Unit 2 Chelsea, MA | 1.0 | 1.0 | 500 | $2,500 | $5.00 | 16d | 1 | 0.63mi |
| 177 Shirley Ave Apt 201 Revere, MA | 1.0 | 1.0 | 543 | $2,250 | $4.14 | 19d | 1 | 0.68mi |
| 1540 N Shore Rd Unit 205 Revere, MA | 1.0 | 1.0 | 467 | $2,200 | $4.71 | 25d | 1 | 0.70mi |
| 133 Kimball Ave Unit 2 Revere, MA | 2.0 | 1.0 | 750 | $2,250 | $3.00 | 45d | 1 | 0.70mi |
| 133 Kimball Ave Unit 1 Revere, MA | 1.0 | 1.0 | 575 | $1,950 | $3.39 | 25d | 1 | 0.70mi |
| 1540 N Shore Rd Unit 102 Revere, MA | — | 1.0 | 500 | $1,900 | $3.80 | 25d | 1 | 0.70mi |
| 9 Dehon St Revere, MA | 2.0 | 1.0 | 690 | $2,750 | $3.99 | 45d | 1 | 0.71mi |
| 196 Shirley Ave Unit 10 Revere, MA | — | 1.0 | 370 | $1,850 | $5.00 | 45d | 1 | 0.71mi |
| 1473 N Shore Rd Unit 101 Revere, MA | 1.0 | 1.0 | 423 | $2,150 | $5.08 | 45d | 1 | 0.74mi |
| 205 Revere Beach Pkwy Revere, MA | 2.0 | 1.0–2.0 | 795 | $3,106 | $3.91 | 0d | 15 | 0.76mi |
| 43 Bryant St #1 Revere, MA | 1.0 | 1.0 | 400 | $1,700 | $4.25 | 45d | 1 | 0.76mi |
| 218 Garfield Ave Unit 1 Revere, MA | 1.0 | 1.0 | 660 | $2,000 | $3.03 | 25d | 1 | 0.77mi |
| 1 Webster Ave Chelsea, MA | 2.0 | 1.0–2.0 | 780 | $2,578 | $3.30 | 0d | 8 | 0.80mi |
| 100 Stockton St Chelsea, MA | 2.0 | 1.0–2.0 | 787 | $2,738 | $3.48 | 0d | 13 | 0.81mi |
| 21 Revere Beach Blvd Revere, MA | 2.0 | 1.0–2.0 | 762 | $3,072 | $4.03 | 0d | 27 | 0.84mi |
| 50 Salt St Revere, MA | 2.0 | 1.0–2.0 | 764 | $3,199 | $4.18 | 0d | 88 | 0.84mi |
| 388 Ocean Ave Revere, MA | 1.0–2.0 | 1.0–2.0 | 956 | $1,725 | $1.80 | 0d | 14 | 0.92mi |
| 65 McKinley St Revere, MA | 1.0 | 1.0 | 700 | $1,495 | $2.14 | 19d | 1 | 0.96mi |
| 93 Bennington St Revere, MA | 2.0 | 1.0–2.0 | 769 | $3,172 | $4.12 | 0d | 5 | 0.97mi |
| 93 Bennington St Revere, MA | 2.0 | 1.0–2.0 | 757 | $3,225 | $4.26 | 45d | 1 | 0.97mi |
| 68 Shawmut St Unit 2 Revere, MA | 2.0 | 1.0 | 700 | $2,400 | $3.43 | 19d | 1 | 1.00mi |
| 896 Broadway Unit 6 Revere, MA | 2.0 | 1.0 | 700 | $2,600 | $3.71 | 45d | 1 | 1.00mi |
| 16 Shurtleff St Revere, MA | 1.0 | 1.0 | 650 | $1,995 | $3.07 | 45d | 1 | 1.01mi |
| 282 Revere St Revere, MA | 2.0 | 1.0 | 675 | $2,000 | $2.96 | 4d | 1 | 1.01mi |
| 500 Ocean Ave Revere, MA | 2.0 | 1.0–2.0 | 784 | $3,420 | $4.36 | 0d | 17 | 1.03mi |
| 740 Winthrop Ave Unit 12 Revere, MA | 2.0 | 1.0 | 700 | $2,595 | $3.71 | 45d | 1 | 1.06mi |
| 646 Ocean Ave Revere, MA | 2.0 | 1.0–2.0 | 851 | $3,468 | $4.07 | 0d | 95 | 1.10mi |
| 17 Kingman Ave Unit B Revere, MA | 2.0 | 1.0 | 700 | $2,500 | $3.57 | 0d | 1 | 1.12mi |
| 650 Ocean Ave Revere, MA | 2.0 | 1.0–2.0 | 788 | $2,835 | $3.60 | 3d | 14 | 1.15mi |
| 656 Ocean Ave Revere, MA | 2.0 | 1.0–2.0 | 1381 | $5,334 | $3.86 | 0d | 17 | 1.21mi |
HOA detail condo
- Monthly dues
- $381 · $4,572/yr
- Assessments
- None detected in remarks — confirm with the listing agent.
Listing history 25 events
-
2026-06-21days on market $274,990 Active 58 DOM
-
2026-06-18days on market $274,990 Active 55 DOM
-
2026-06-17days on market $274,990 Active 54 DOM
-
2026-06-16days on market $274,990 Active 53 DOM
-
2026-06-15days on market $274,990 Active 52 DOM
-
2026-06-13days on market $274,990 Active 50 DOM
-
2026-06-09days on market $274,990 Active 46 DOM
-
2026-06-08days on market $274,990 Active 45 DOM
-
2026-06-07days on market $274,990 Active 44 DOM
-
2026-06-04days on market $274,990 Active 41 DOM
-
2026-06-03days on market $274,990 Active 40 DOM
-
2026-06-02days on market $274,990 Active 39 DOM
-
2026-06-01days on market $274,990 Active 38 DOM
-
2026-05-31days on market $274,990 Active 37 DOM
-
2026-05-15status Back On Market 649-char remark
Show marketing remark (649 chars)
This oversized one-bedroom condo at Ambassador North Condominiums is ideal for both investors and owner-occupants. Conveniently located less than a mile from MBTA access at Beachmont Station (Blue Line), enjoy a commute to Downtown Boston in under 15 minutes. You’ll also love the proximity to shopping, dining, Revere Beach, and the exciting Suffolk Downs redevelopment. Situated on the second floor on the backside of the building away from the Parkway, of an elevator building, this unit offers a deeded parking space, private storage, and provides a path into ownership or investing to rent! With a little bit of love this unit will shine.
-
2026-05-12status Under Agreement 649-char remark
Show marketing remark (649 chars)
This oversized one-bedroom condo at Ambassador North Condominiums is ideal for both investors and owner-occupants. Conveniently located less than a mile from MBTA access at Beachmont Station (Blue Line), enjoy a commute to Downtown Boston in under 15 minutes. You’ll also love the proximity to shopping, dining, Revere Beach, and the exciting Suffolk Downs redevelopment. Situated on the second floor on the backside of the building away from the Parkway, of an elevator building, this unit offers a deeded parking space, private storage, and provides a path into ownership or investing to rent! With a little bit of love this unit will shine.
-
2026-04-28historical Contingent 649-char remark
Show marketing remark (649 chars)
This oversized one-bedroom condo at Ambassador North Condominiums is ideal for both investors and owner-occupants. Conveniently located less than a mile from MBTA access at Beachmont Station (Blue Line), enjoy a commute to Downtown Boston in under 15 minutes. You’ll also love the proximity to shopping, dining, Revere Beach, and the exciting Suffolk Downs redevelopment. Situated on the second floor on the backside of the building away from the Parkway, of an elevator building, this unit offers a deeded parking space, private storage, and provides a path into ownership or investing to rent! With a little bit of love this unit will shine.
-
2026-04-21$274,990 New 649-char remark
Show marketing remark (649 chars)
This oversized one-bedroom condo at Ambassador North Condominiums is ideal for both investors and owner-occupants. Conveniently located less than a mile from MBTA access at Beachmont Station (Blue Line), enjoy a commute to Downtown Boston in under 15 minutes. You’ll also love the proximity to shopping, dining, Revere Beach, and the exciting Suffolk Downs redevelopment. Situated on the second floor on the backside of the building away from the Parkway, of an elevator building, this unit offers a deeded parking space, private storage, and provides a path into ownership or investing to rent! With a little bit of love this unit will shine.
-
2008-03-31soldstatus $90,000 Sold 149-char remark
Show marketing remark (149 chars)
Bank owned. Priced below assessed value. Great location near the t, shopping, near the beach, minutes from Boston. Don't miss this great opportunity.
-
2008-02-22historical 149-char remark
Show marketing remark (149 chars)
Bank owned. Priced below assessed value. Great location near the t, shopping, near the beach, minutes from Boston. Don't miss this great opportunity.
-
2008-02-19$99,900 149-char remark
Show marketing remark (149 chars)
Bank owned. Priced below assessed value. Great location near the t, shopping, near the beach, minutes from Boston. Don't miss this great opportunity.
-
1997-07-10soldstatus $55,000
-
1997-07-10soldstatus $55,000
-
1997-04-16historical
-
1997-02-17$56,000
ⓘ Source: listings_history table (triggers on properties + properties_extension) + one-shot
backfill from property_details.listing_events for pre-trigger history.
Tax reassessment forecast MA · Partial reset (capped growth)
- Current annual tax
- $2,329 · $194/mo
- Projected year-2 tax
- $2,856 · $238/mo
- Expected delta
- +$527/yr (+$44/mo · 22.6%)
ⓘ Screening estimate from a state-policy table — verify with the county assessor before closing.
Nearby sold comps map
Loading sold comps map…
Walkable amenities ~0.75 mi
Loading nearby amenities…
Taxation est. · year 1
- Rental income
- $28,310
- − Mortgage interest
- −$15,404
- − Property taxes
- −$2,329
- − Insurance
- −$1,375
- − Repairs & maintenance
- −$2,265
- − Management
- −$2,265
- − HOA
- −$4,572
- − Depreciation
- −$8,000
- Taxable loss
- −$7,899
- Est. tax savings @ 24.0%
- +$1,896
- After-tax cash flow
- $-1,320/yr
For passive investors: Depreciation is non-cash, so a rental often shows a tax loss while cash-flowing — sheltering income. Rental losses are passive: they offset passive income freely, and up to $25,000/yr can offset ordinary (W-2) income if you actively participate and your MAGI is under $100k (phasing out to $0 by $150k); unused losses carry forward. On sale, claimed depreciation is recaptured at up to 25%, and gains may owe capital-gains tax (a 1031 exchange can defer both). Figures are a year-1 estimate at your 24.0% rate — not tax advice; consult a CPA.
Schools (NCES district)
- District
- Revere
- NCES district ID
- 2510050
- Math proficiency
- 19% ▼ -25.00%
- Reading proficiency
- 37% ▼ -11.00%
- Median HH income
- $51,159
- Composite
- 24.59/100
- National rank
- #7637
- State rank
- #261 of 302 in MA
Livability — Revere
- Score
- 72/100
- State rank
- #122
- US rank
- #6460
Category grades
Schools grade is shown separately in the Schools card above.
Census & demographics
- Census place
- Revere, MA
- County
- Suffolk County · 777,335 people
- City population
- 60,012
- Metro
- Boston-Cambridge-Newton, MA-NH
- Population (ZIP)
- 60,012
- Household income
- $86,969
- Rent vs Own
- Severe rent burden
- 3586.0
Population outlook (Suffolk County) Hauer SSP2
- Today (2025)
- 915,464 people
- By 2030
- 983,798 · +7.5%
- By 2040
- 1,119,602 · +22.3%
- By 2050
- 1,255,187 · +37.1%
- By 2075
- 1,534,434 · +67.6%
- By 2100
- 1,748,505 · +91.0%
Race, ethnicity, and origin ACS 2023
- Neighborhood character
- Diverse neighborhood (Simpson 0.62)
- Race & ethnicity
- White 48% Hispanic / Latino 39% Two or more races 21% Black 4% Asian 4%
- Hispanic origin (detail)
- Mexican 2% Puerto Rican 3% Dominican 2%
- Common ancestry
- Estonian 4% Romanian 2% Russian 2%
- Foreign-born
- 44% · Canada, Jamaica, China
- Languages at home
- 43% English-only · Spanish 35% Other Indo-European 11% Arabic 4%
Political lean MEDSL · Suffolk
- 2024 margin
- Solid D (+52.5) · D 74.8% · R 22.4% · Other 2.8%
- 2008→2024 swing
- -3.2pp toward R · 2008: 55.7pp · 2024: 52.5pp
- All cycles
- 2024: D+52.5 2020: D+63.2 2016: D+63.0 2012: D+56.7 2008: D+55.7
Not yet ingested
- Civics
- —
Market trends
- HPI YoY
- ▼ -285.62%
- Current HPI
- 358.7286
- Rent YoY
- ▲ 1.91%
- Metro
- Boston-Cambridge-Newton, MA-NH
- State GDP YoY
- ▲ 2.28%
- F500 in state
- 38
Industry mix (Fortune 500 HQ in MA)
| Industry | F500 HQs | Revenue |
|---|---|---|
| Technology | 3 | $17B |
|
||
| Insurance | 2 | $84B |
|
||
| Retail | 2 | $76B |
|
||
| Life Sciences | 1 | $43B |
|
||
| Energy Technology | 1 | $31B |
|
||
| Aerospace / Defense | 1 | $18B |
|
||
Price history
+391.1% since first listed11 events — show timeline
- 2026-05-15 Relisted — MLS PIN
- 2026-05-12 Pending — MLS PIN
- 2026-04-28 Contingent — MLS PIN
- 2026-04-21 Listed $274,990 MLS PIN
- 2008-03-31 Sold (MLS) $90,000 MLS PIN
- 2008-02-22 Listing Removed — MLS PIN
- 2008-02-19 Listed $99,900 MLS PIN
- 1997-07-10 Sold (Public Records) $55,000 Public Records
- 1997-07-10 Sold (MLS) $55,000 MLS PIN
- 1997-04-16 Listing Removed — MLS PIN
- 1997-02-17 Listed $56,000 MLS PIN
Property tax history
+2.8%/yrLatest (2023): $2,329 · -2.8% YoY. Source: county tax records.
Cash-flow waterfall
monthlySold comps — $/sqft
last 12 mo · ≤1 miLoading sold comps…