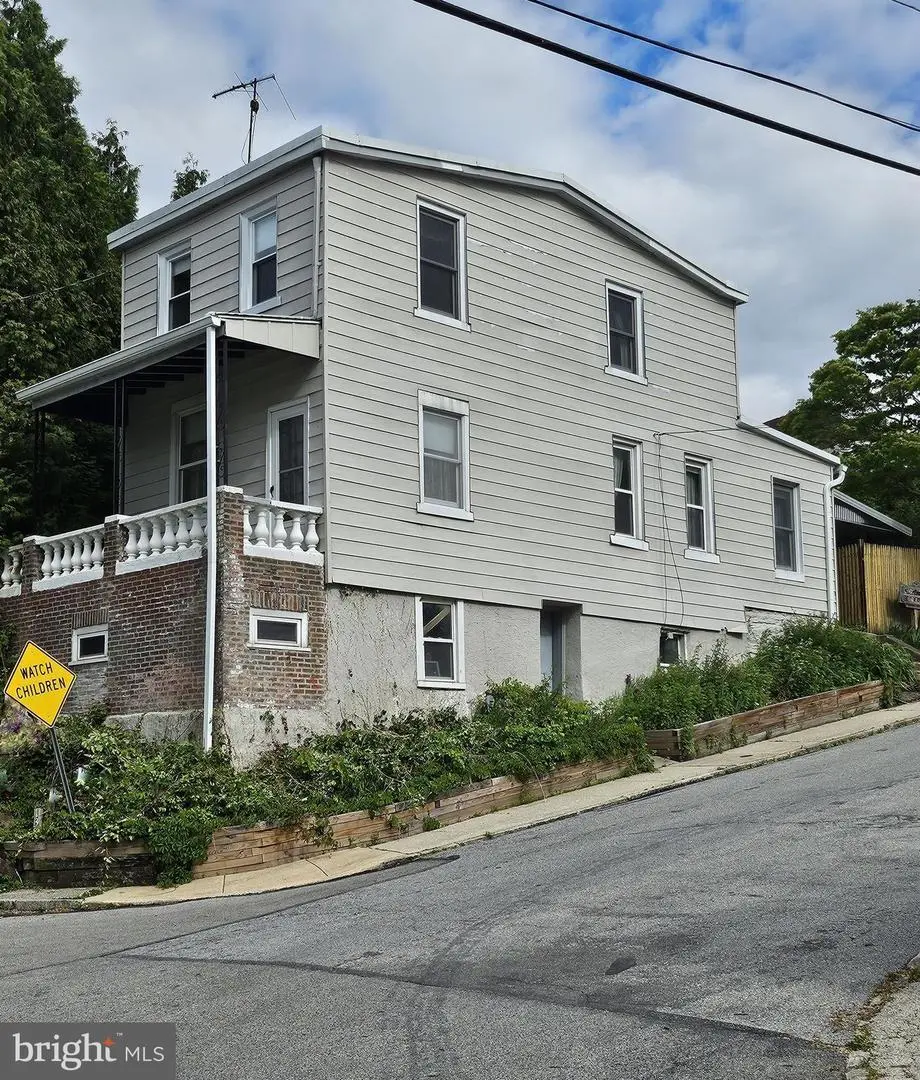
138 Ebenezer Ave · Philadelphia, PA
Flood risk 1/10 · Minimal
- FEMA flood zone
- X (unshaded)
- Chance of flooding over 30 yrs
- 0.0%
- Est. flood insurance / yr
- $473 – $860
Fire risk 1/10 · Minimal
- Est. fire insurance / yr
- $511 – $949
Heat risk 6/10 · Moderate
- Hot days now (above 102°F)
- 7 days/yr
- Hot days in 30 yrs
- 15 days/yr
Wind risk 6/10 · Moderate
- Chance of severe wind over 30 yrs
- 27.0%
Air-quality risk 4/10 · Minor
- Unhealthy air days now
- 4 days/yr
- Unhealthy air days in 30 yrs
- 5 days/yr
Risk factors via First Street. Map © Google.
Why this score? — see what drove the C- grade
The composite is a weighted blend of 9 inputs, each scored 0–100. Each bar is that input's sub-score; the figure is the points it added to the 100-point composite (weight × sub-score).
- ARV discount +15.0/15.0
- Cash flow +13.9/30.0
- Schools +7.3/10.0
- DSCR +4.2/10.0
- 1% rule +4.0/10.0
- Livability +3.9/5.0
- Rent growth +3.3/5.0
- Condition / age +2.5/5.0
- Appreciation +0.0/10.0
$325,000
🖨 Deal sheet 📄 Offer letter ✓ Due diligence
Listing remarks MLS
1St Flr:Lr W/ Oe To Porch, Den/Dr, New Country Kit W/ Hw Flrs & Wndw, Oe To Patio & Garden. 2Nd Flr:Two Sun Filled Br's, Hall Bath. Bsmnt: Full, Oe. Remarks:Wonderful, Sunny Home On Lrg Corner Lot. Beautifully Maintained.
Key facts
- 5,000 sq ft lot
- 4 parking spots
- Built 1902
Property features AI
Exterior
- Parking: Driveway parking; Space for 4 vehicles total (4 driveway spaces)
- Utilities: Public water; Public sewer; Natural gas for heating and hot water; Electric for cooling
- Home design: Detached property; Fee simple ownership
- Construction: Aluminum siding; Stone foundation; Above-grade and below-grade structures
- Exterior features: Paved driveway
Interior
- Kitchen: Kitchen (appliances not specified)
- Bedrooms: Two bedrooms on the upper level
- Bathrooms: One full bathroom
- Heating & cooling: Central heating; Window air conditioning units (electric)
- Interior features: Living room; Dining room; Kitchen; Basement with outside/side entrance and walkout level (unfinished)
- Laundry & utility: Hot water provided by natural gas
Neighborhood map
What this means for you Summary
Snapshot
- This is a 2-bed/1.0-bath single-family listed at $325k.
Deal economics
- At list price, monthly cash flow is $38 ($455/yr) — positive.
- The deal already cash-flows at list — no discount required.
- To meet the 1% rule (rent ≥ 1% of price), the offer needs to be $291k (10.5% below list).
- Recommended offer: $291k (10.5% below list) — sets the bar for 1% rule.
- Cap rate 6.4% vs local median 3.5% in Philadelphia — top-decile yield for the area; either an underpriced asset or a hidden risk that comps aren't pricing in. Stress-test before assuming the spread holds.
Location & tenants
- Location reads 77/100 on livability (#348 in PA, #3,054 nationally) — a middle-class / working-renter tenant base. Strengths: amenities A+, commute A+, cost of living A+; Watch: employment C-, schools D+, crime F.
- Lower Merion SD (suburban): math 74% / reading 84% proficiency, ranked #3 of 539 in PA (top 1%) — strong family-tenant draw, lease renewals of 3-5y typical; only 7% free/reduced lunch — higher-income household profile.
- Market conditions: Rents rising (+3.2%/yr); 57 active listings in the ZIP; 16 comparable units currently listed for rent nearby; rentals leasing fast (median 13d on market — plan ~1-2 weeks tenant-placement turnaround); high-income renter base; 1,936 units permitted in Montgomery County in 2024 (530 in 5+ unit buildings).
Forward outlook
- Local home prices are declining (-3.0%/yr); year-one equity from $2k of loan paydown is wiped out by about $10k of value loss. Plan a longer hold.
- Montgomery County population projected at +5% by 2050 — modest demand growth; plan on rents tracking national, not racing it.
Negotiation context
- Only 12 days on market — expect competitive offers; lowballing is unlikely to land.
- 2 sale attempts since 30y ago with the ask held roughly flat each time — persistent listings suggest the price (not the market) is what's stuck; bring a comps-based counter.
- Current owner paid $103k; list at $325k implies a 216% gain — meaningful room to come down on a strong offer.
Risks & watch-outs
- Watch-outs: built in 1902 — expect roof / HVAC / electrical / plumbing capex.
- Climate carrying-cost: major wind risk, 27% chance of damaging wind over 30y; extreme-heat days projected 7→15/yr by 2055 (HVAC capex compounding) — expect insurance premiums to compound above CPI over the hold.
Questions for the listing agent
- Built in 1902 — when were the roof, HVAC, electrical panel, plumbing, and water heater last replaced?
- Is there a deadline driving the sale (1031 exchange, divorce, estate, relocation)? That informs how much negotiation room exists.
- Schools are D-rated, which usually means shorter tenancies and higher turnover. Who's the typical renter profile here, and what's been the actual vacancy rate?
- Crime grade is F in this area — have there been break-ins, vandalism, or insurance claims at this property in the last 3 years? What carrier currently insures it and at what premium?
- What's the average days-on-market for RENTAL listings here right now (not sales)? A rising rental-DOM trend means longer vacancies and softer asking-rent achievability than the comps imply.
- What's the recent tenant-quality profile in this submarket — average credit score on applications, eviction rate, late-payment / NSF rate, and stable-employment percentage? A property-management company in the area should have these aggregated.
- How much new for-sale + rental construction is in the pipeline within 1–3 miles? Heavy new supply typically softens prices + rents 12–24 months out; constrained supply supports both.
Investment metrics
- 1% rule
- 0.90% ✗
- Cap rate
- 6.43%
- Cash-on-cash
- 0.50%
- DSCR
- 1.02
- GRM
- 9.3
CMA / ARV
- ARV (median comp)
- $413,437
- List price
- $325,000
- Delta
- -21.39%
- Verdict
- UNDERPRICED
- Comps
- 20 within 1.0 mi
Show comp detail 6 sales within ~0.75 mi
| Address | Dist | Beds/Ba | Sqft | Sold | Price | $/sf | Match |
|---|---|---|---|---|---|---|---|
| 139 Ebenezer Ave | 0.02mi | 3/3.0 (+1) | 1,329 (+1%) | 18mo | $350,000 | $263 | 69 |
| 10 Price St | 0.20mi | 3/1.0 (+1) | 1,140 (-14%) | 22mo | $418,000 | $367 | 44 |
| 152 School St | 0.30mi | 3/2.0 (+1) | 1,450 (+10%) | 22mo | $450,000 | $310 | 42 |
| 157 Fountain St | 0.48mi | 3/1.5 (+1) | 1,512 (+15%) | 12mo | $380,000 | $251 | 36 |
| 256 Hermitage St | 0.66mi | 3/2.0 (+1) | 1,455 (+10%) | 19mo | $367,500 | $253 | 27 |
| 4373 Cresson St Unit 3 | 0.71mi | 3/2.0 (+1) | 1,426 (+8%) | 23mo | $225,000 | $158 | 25 |
Match score weights: distance 35% · size 25% · config 20% · recency 20%. Top-matched comps best support the ARV.
Projected returns pro-forma
-3.0% appreciation · 3.24% rent growth · sell at horizon
- IRR
- -15.2%
- Equity multiple
- 0.46×
- Total profit
- $-49,490
- Equity at exit
- $48,459
- IRR
- -6.2%
- Equity multiple
- 0.59×
- Total profit
- $-36,864
- Equity at exit
- $28,100
Cash invested: $91,000 (down + closing). Projections, not guarantees.
Landlord ↔ Tenant lean methodology
- Overall (STATE)
- 62 Landlord-Friendly
- State Pennsylvania
- 62 Landlord-Friendly · EVEN
- County
- — inherits STATE
- City
- — inherits STATE
ZIP-level market 19004
- Rents YoY
- 3.2%
- Active inventory
- 57
- Price-to-rent
- 9.3×
Monthly cashflow live
- Estimated rent
- $2,910 high interval (Pro) →
- Mortgage (P&I)
- −$1,704
- Tax from tax record
- −$421 /mo · $5,051/yr
- Insurance
- −$135
- HOA
- −$0
- Vacancy / Maint / Mgmt
- −$611
- Net cashflow
- $38
Break-even live
UW: 25.0% down · 7.5% · 30yr · 1.5% tax · 5.0% vac · 8.0% maint · 8.0% mgmt
Financing live
Cash to close
- Down payment
- $81,250
- Closing costs
- $9,750
- Reserves months
- —
- Total cash needed
- —
Loan-product check · same deal, 3 products live
Conventional
25% down · 7.5% · 30yr
- Down + closing
- —
- Monthly P&I
- —
- Monthly cashflow
- —
- DSCR
- —
- Eligible?
- —
Personal DTI + credit; lowest rate.
DSCR
20% down · 8.5% · 30yr
- Down + closing
- —
- Monthly P&I
- —
- Monthly cashflow
- —
- DSCR
- —
- Eligible?
- —
No personal income docs; deal must DSCR.
Hard money
10% down · 12.0% · 12mo
- Down + closing
- —
- Monthly P&I
- —
- Monthly cashflow
- —
- DSCR
- —
- Eligible?
- —
Short-term bridge; refi at stabilization.
Rent comps 16 comps
| Address | Beds | Baths | Sqft | Rent | $/sqft | DOM | Units | Dist |
|---|---|---|---|---|---|---|---|---|
| 130 Rockland Ave Bala Cynwyd, PA | 3.0 | 2.0 | 1458 | $3,100 | $2.13 | 5d | 1 | 0.09mi |
| 23 Rock Hill Rd Bala Cynwyd, PA | 1.0–2.0 | 1.0–2.0 | 1132 | $4,560 | $4.03 | 2d | 39 | 0.53mi |
| 172 Conarroe St Philadelphia, PA | 1.0–3.0 | 1.0–3.0 | 1300 | $3,400 | $2.62 | 24d | 1 | 0.76mi |
| 4525 Fleming St Apt 3 Philadelphia, PA | 2.0–3.0 | 2.0–2.5 | 1749 | $2,250 | $1.29 | 2d | 3 | 0.89mi |
| 1637 Oakwood Dr Unit S122 Narberth, PA | 3.0 | 2.5 | 1512 | $3,695 | $2.44 | 2d | 1 | 1.26mi |
| 1637 Oakwood Dr Penn Valley, PA | 1.0–3.0 | 1.0–2.5 | 1185 | $2,798 | $2.36 | 12d | 3 | 1.26mi |
| 600 Righters Ferry Rd Bala Cynwyd, PA | 1.0–2.0 | 1.0–2.0 | 846 | $2,950 | $3.49 | 2d | 10 | 1.33mi |
| 1640 Oakwood Dr Penn Valley, PA | 1.0–3.0 | 1.0–2.0 | 1203 | $2,745 | $2.28 | 15d | 2 | 1.35mi |
| 1600 Hagys Ford Rd Unit 11V Penn Valley, PA | 3.0 | 2.5 | 1509 | $3,995 | $2.65 | 18d | 1 | 1.37mi |
| 1600 Hagys Ford Rd Penn Valley, PA | 1.0–3.0 | 1.5–2.5 | 1223 | $3,048 | $2.49 | 18d | 3 | 1.39mi |
| 1 Montgomery Ave Bala Cynwyd, PA | 2.0 | 1.0–2.0 | 717 | $2,105 | $2.94 | 3d | 5 | 1.43mi |
| 125 Montgomery Ave Bala Cynwyd, PA | 1.0–3.0 | 1.0–2.0 | 875 | $2,295 | $2.62 | 4d | 8 | 1.45mi |
| 121 Montgomery Ave Bala Cynwyd, PA | 2.0 | 2.0 | 1250 | $2,245 | $1.80 | 18d | 1 | 1.45mi |
| 121 Montgomery Ave Bala Cynwyd, PA | 2.0 | 2.0 | 1200 | $2,245 | $1.87 | 24d | 1 | 1.45mi |
| 115 Montgomery Ave Unit 2 Bala Cynwyd, PA | 2.0 | 1.0 | 1500 | $2,750 | $1.83 | 24d | 1 | 1.46mi |
| 10 Montgomery Ave Bala Cynwyd, PA | 1.0–2.0 | 1.0–2.0 | 949 | $2,200 | $2.32 | 1d | 8 | 1.47mi |
Listing history 7 events
-
2026-06-03status $325,000 Pending 12 DOM
-
2026-05-12$325,000 Active 323-char remark
-
2026-05-11historical $325,000 323-char remark
-
1996-07-01soldstatus $102,900
-
1996-06-24soldstatus $102,900 233-char remark
Show marketing remark (233 chars)
1St Flr:Lr W/ Oe To Porch, Den/Dr, New Country Kit W/ Hw Flrs & Wndw, Oe To Patio & Garden. 2Nd Flr:Two Sun Filled Br's, Hall Bath. Bsmnt: Full, Oe. Remarks:Wonderful, Sunny Home On Lrg Corner Lot. Beautifully Maintained.
-
1996-03-02$102,900 233-char remark
Show marketing remark (233 chars)
1St Flr:Lr W/ Oe To Porch, Den/Dr, New Country Kit W/ Hw Flrs & Wndw, Oe To Patio & Garden. 2Nd Flr:Two Sun Filled Br's, Hall Bath. Bsmnt: Full, Oe. Remarks:Wonderful, Sunny Home On Lrg Corner Lot. Beautifully Maintained.
-
1983-08-01soldstatus $52,000
ⓘ Source: listings_history table (triggers on properties + properties_extension) + one-shot
backfill from property_details.listing_events for pre-trigger history.
Tax reassessment forecast PA · Partial reset (capped growth)
- Current annual tax
- $5,051 · $421/mo
- Projected year-2 tax
- $5,093 · $424/mo
- Expected delta
- +$42/yr (+$4/mo · 0.8%)
ⓘ Screening estimate from a state-policy table — verify with the county assessor before closing.
Climate risk First Street
- Flood 1/10 Low FEMA zone X (unshaded) · 0% chance over 30 yrs
- Wildfire 1/10 Low
- Heat 6/10 Major 7 d/yr ≥102°F today · 15 d/yr by 30 yrs out
- Wind 6/10 Major 27% chance of damaging wind over 30 yrs
- Air quality 4/10 Moderate 4 unhealthy d/yr today · 5 by 30 yrs out
Nearby sold comps map
Loading sold comps map…
Walkable amenities ~0.75 mi
Loading nearby amenities…
Taxation est. · year 1
- Rental income
- $34,915
- − Mortgage interest
- −$18,205
- − Property taxes
- −$5,051
- − Insurance
- −$1,625
- − Repairs & maintenance
- −$2,793
- − Management
- −$2,793
- − Depreciation
- −$9,455
- Taxable loss
- −$5,006
- Est. tax savings @ 24.0%
- +$1,202
- After-tax cash flow
- $1,657/yr
For passive investors: Depreciation is non-cash, so a rental often shows a tax loss while cash-flowing — sheltering income. Rental losses are passive: they offset passive income freely, and up to $25,000/yr can offset ordinary (W-2) income if you actively participate and your MAGI is under $100k (phasing out to $0 by $150k); unused losses carry forward. On sale, claimed depreciation is recaptured at up to 25%, and gains may owe capital-gains tax (a 1031 exchange can defer both). Figures are a year-1 estimate at your 24.0% rate — not tax advice; consult a CPA.
Schools (NCES district)
- District
- Lower Merion SD
- NCES district ID
- 4214160
- Math proficiency
- 74% ▼ -5.00%
- Reading proficiency
- 84% ▼ -4.00%
- Median HH income
- $113,035
- Composite
- 72.82/100
- National rank
- #194
- State rank
- #3 of 539 in PA
Livability — Philadelphia
- Score
- 77/100
- State rank
- #348
- US rank
- #3054
Category grades
Schools grade is shown separately in the Schools card above.
Census & demographics
- County
- Montgomery County · 712,331 people
- City population
- 1,559,001
- Metro
- Philadelphia-Camden-Wilmington, PA-NJ-DE-MD
- Population (ZIP)
- 11,230
- Household income
- $149,232
- Rent vs Own
- Severe rent burden
- 245.0
Population outlook (Montgomery County) Hauer SSP2
- Today (2025)
- 856,074 people
- By 2030
- 870,887 · +1.7%
- By 2040
- 891,195 · +4.1%
- By 2050
- 896,417 · +4.7%
- By 2075
- 903,212 · +5.5%
- By 2100
- 843,240 · -1.5%
Race, ethnicity, and origin ACS 2023
- Neighborhood character
- Predominantly White (76%)
- Race & ethnicity
- White 76% Black 11% Asian 6% Two or more races 5% Hispanic / Latino 2%
- Common ancestry
- Scotch-Irish 7% Romanian 5% Italian 3%
- Foreign-born
- 13% · Canada, China, South Korea
- Languages at home
- 87% English-only · Other Indo-European 3% Chinese 2% French/Haitian/Cajun 2%
Political lean MEDSL · Montgomery
- 2024 margin
- Strong D (+22.8) · D 60.9% · R 38.1% · Other 1.1%
- 2008→2024 swing
- +2.0pp toward D · 2008: 20.8pp · 2024: 22.8pp
- All cycles
- 2024: D+22.8 2020: D+26.3 2016: D+21.1 2012: D+14.3 2008: D+20.8
Not yet ingested
- Civics
- —
Market trends
- HPI YoY
- ▼ -477.60%
- Current HPI
- 324.1722
- Rent YoY
- ▲ 3.24%
- Metro
- Philadelphia-Camden-Wilmington, PA-NJ-DE-MD
- State GDP YoY
- ▲ 1.68%
- F500 in state
- 34
Industry mix (Fortune 500 HQ in PA)
| Industry | F500 HQs | Revenue |
|---|---|---|
| Healthcare | 2 | $309B |
|
||
| Insurance | 2 | $27B |
|
||
| Telecommunications / Media | 1 | $124B |
|
||
| Industrial Distribution | 1 | $22B |
|
||
| Financial Services | 1 | $20B |
|
||
| Chemicals / Materials | 1 | $18B |
|
||
Price history
+525.0% since first listed8 events — show timeline
- 2026-06-02 Pending — BRIGHT MLS
- 2026-05-24 Contingent — BRIGHT MLS
- 2026-05-12 Listed $325,000 BRIGHT MLS
- 2026-05-11 Coming Soon $325,000 BRIGHT MLS
- 1996-07-01 Sold (Public Records) $102,900 Public Records
- 1996-06-24 Sold (MLS) $102,900 BRIGHT MLS
- 1996-03-02 Listed $102,900 BRIGHT MLS
- 1983-08-01 Sold (Public Records) $52,000 Public Records
Property tax history
+3.0%/yrLatest (2026): $5,051 · +4.6% YoY. Source: county tax records.
Cash-flow waterfall
monthlySold comps — $/sqft
last 12 mo · ≤1 miLoading sold comps…