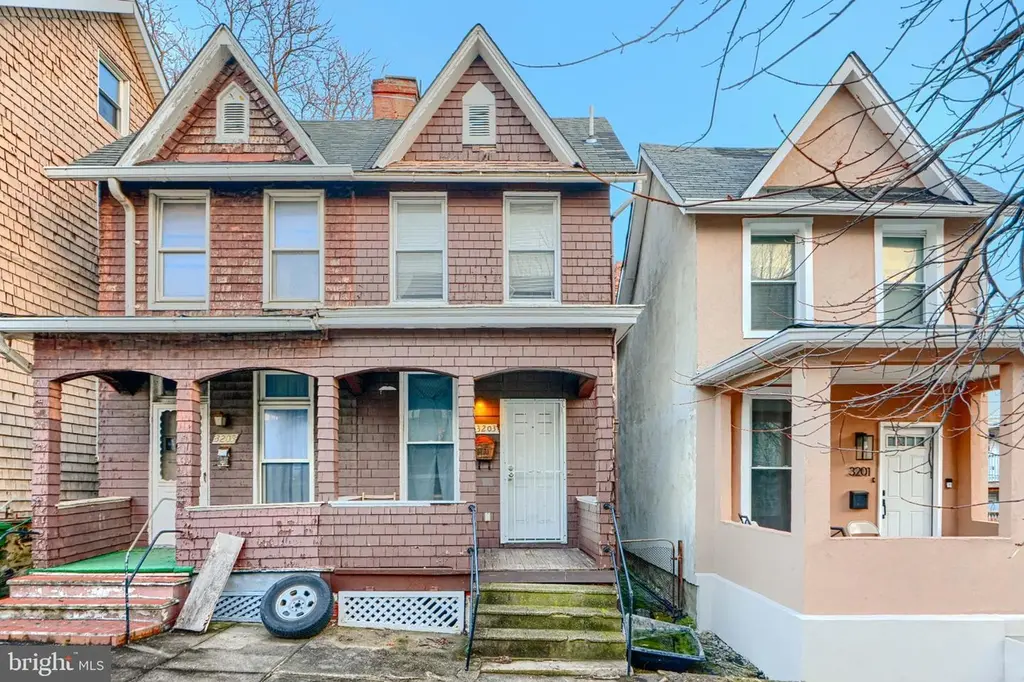
3203 Independence St · Baltimore, MD
Flood risk 1/10 · Minimal
- FEMA flood zone
- X (unshaded)
- Chance of flooding over 30 yrs
- 0.0%
- Est. flood insurance / yr
- $473 – $860
Fire risk 1/10 · Minimal
- Est. fire insurance / yr
- $755 – $1,403
Heat risk 7/10 · Major
- Hot days now (above 103°F)
- 7 days/yr
- Hot days in 30 yrs
- 15 days/yr
Wind risk 6/10 · Moderate
- Chance of severe wind over 30 yrs
- 27.0%
Air-quality risk 4/10 · Minor
- Unhealthy air days now
- 6 days/yr
- Unhealthy air days in 30 yrs
- 7 days/yr
Risk factors via First Street. Map © Google.
Why this score? — see what drove the B+ grade
The composite is a weighted blend of 9 inputs, each scored 0–100. Each bar is that input's sub-score; the figure is the points it added to the 100-point composite (weight × sub-score).
- Cash flow +30.0/30.0
- ARV discount +15.0/15.0
- 1% rule +10.0/10.0
- DSCR +10.0/10.0
- Livability +3.8/5.0
- Rent growth +2.9/5.0
- Condition / age +2.5/5.0
- Schools +1.0/10.0
- Appreciation +0.0/10.0
$99,000
🖨 Deal sheet 📄 Offer letter ✓ Due diligence
Listing remarks MLS
3 BR, 1 BA detached home in Better Waverly, rehabbed in 2021, including New Systems and appliances. Conveniently located behind Johns Hopkins at Eastern High Campus, a few blocks from Waverly YMCA, Stadium Place, Waverly Farmer's Market, to name a few. Close to public transportation. $5,000 Grant for Johns Hopkins qualified Full Time Employees (Check with HR for eligibility). Sold As-Is
Key facts
- Built 1890
- Listed 67 days
Neighborhood map
What this means for you Summary
Snapshot
- This is a 2-bed/1.0-bath townhouse listed at $99k.
Deal economics
- At list price, monthly cash flow is $429 ($5k/yr) — positive.
- The deal already cash-flows at list — no discount required.
- Meets the 1% rule at list price ($2k rent vs $99k).
- Recommended offer: $93k (6.0% below list) — sets the bar for market timing.
- Cap rate 11.5% vs local median 6.0% in Baltimore — top-decile yield for the area; either an underpriced asset or a hidden risk that comps aren't pricing in. Stress-test before assuming the spread holds.
Location & tenants
- Location reads 76/100 on livability (#90 in MD, #3,396 nationally) — a middle-class / working-renter tenant base. Strengths: amenities A+, commute A+, housing A+; Watch: schools D, crime F.
- Baltimore City Public Schools (urban): math 7% / reading 16% proficiency, ranked #24 of 24 in MD (top 100%) — low school quality limits family demand, transient renter base, plan for 1-2y turnover; 79% free/reduced lunch — lower-income household profile, screen leases tightly.
- Market conditions: Rents rising (+1.6%/yr); 325 active listings in the ZIP; 40 comparable units currently listed for rent nearby; rentals at typical pace (median 24d on market — plan ~3-4 weeks tenant-placement turnaround); 40% of comp listings sitting > 30 days — soft ceiling on asking rent; 1,273 units permitted in Baltimore city in 2024 (1,104 in 5+ unit buildings).
- This rent runs 30% of the median local income ($62k/yr) — at the standard rent-burdened threshold; future hikes will face affordability resistance.
Forward outlook
- Local home prices are declining (-3.0%/yr); year-one equity from $684 of loan paydown is wiped out by about $3k of value loss. Plan a longer hold.
- Baltimore County population projected to shrink 4% by 2050 — rents likely to lag national; underwrite the cash flow, not the appreciation.
- At projected returns (-3.0% appreciation + 1.6% rent growth), your $28k cash investment doubles in ~8 years — after that, you're playing with house money.
Negotiation context
- It's been on market 67 days — a 6% lower offer ($93k) is reasonable based on typical stale-listing flexibility.
- 10 sale attempts since 10y ago with the ask held roughly flat each time — persistent listings suggest the price (not the market) is what's stuck; bring a comps-based counter.
Risks & watch-outs
- Watch-outs: property tax is 3.0% of price; built in 1890 — expect roof / HVAC / electrical / plumbing capex.
- Climate carrying-cost: major wind risk, 27% chance of damaging wind over 30y; extreme-heat days projected 7→15/yr by 2055 (HVAC capex compounding) — expect insurance premiums to compound above CPI over the hold.
Questions for the listing agent
- It's been on market 67 days. Have you received any prior offers? Is the seller open to a 6% concession, seller financing, or rate buy-down credit?
- Built in 1890 — when were the roof, HVAC, electrical panel, plumbing, and water heater last replaced?
- Property tax is high relative to price — has the assessment been appealed recently, and will the sale trigger a re-assessment?
- Why hasn't it sold? Are there any deal-killer items the seller is aware of (foundation, flood, title, zoning, code violations)?
- Is there a deadline driving the sale (1031 exchange, divorce, estate, relocation)? That informs how much negotiation room exists.
- Schools are D-rated, which usually means shorter tenancies and higher turnover. Who's the typical renter profile here, and what's been the actual vacancy rate?
- Crime grade is F in this area — have there been break-ins, vandalism, or insurance claims at this property in the last 3 years? What carrier currently insures it and at what premium?
- What's the average days-on-market for RENTAL listings here right now (not sales)? A rising rental-DOM trend means longer vacancies and softer asking-rent achievability than the comps imply.
- What's the recent tenant-quality profile in this submarket — average credit score on applications, eviction rate, late-payment / NSF rate, and stable-employment percentage? A property-management company in the area should have these aggregated.
- How much new for-sale + rental construction is in the pipeline within 1–3 miles? Heavy new supply typically softens prices + rents 12–24 months out; constrained supply supports both.
Investment metrics
- 1% rule
- 1.58% ✓
- Cap rate
- 11.49%
- Cash-on-cash
- 18.57%
- DSCR
- 1.83
- GRM
- 5.3
CMA / ARV
- ARV (median comp)
- $147,997
- List price
- $99,000
- Delta
- -33.11%
- Verdict
- UNDERPRICED
- Comps
- 20 within 1.0 mi
Show comp detail 12 sales within ~0.75 mi
| Address | Dist | Beds/Ba | Sqft | Sold | Price | $/sf | Match |
|---|---|---|---|---|---|---|---|
| 3103 Independence St | 0.07mi | 2/1.0 | 930 (-10%) | 5mo | $145,000 | $156 | 76 |
| 616 E 30th St | 0.31mi | 2/1.0 | 1,092 (+5%) | 1mo | $65,000 | $60 | 76 |
| 3045 Frisby St | 0.28mi | 3/1.5 (+1) | 1,056 (+2%) | 3mo | $162,000 | $153 | 74 |
| 616 Montpelier St | 0.29mi | 3/1.0 (+1) | 1,120 (+8%) | 2mo | $145,000 | $129 | 66 |
| 704 E 36th St | 0.49mi | 2/1.5 | 976 (-6%) | 3mo | $60,000 | $61 | 63 |
| 738 E 37th St | 0.54mi | 3/1.5 (+1) | 986 (-5%) | 3mo | $215,000 | $218 | 57 |
| 731 E 36th St | 0.45mi | 2/1.0 | 1,156 (+12%) | 4mo | $140,000 | $121 | 57 |
| 2956 Greenmount Ave | 0.41mi | 3/2.0 (+1) | 1,130 (+9%) | 1mo | $209,395 | $185 | 56 |
| 1601 E 28th St | 0.53mi | 3/2.0 (+1) | 1,100 (+6%) | 3mo | $120,000 | $109 | 53 |
| 608 Chestnut Hill Ave | 0.63mi | 2/1.0 | 1,156 (+12%) | 1mo | $73,000 | $63 | 51 |
| 728 Bartlett Ave | 0.72mi | 3/1.0 (+1) | 1,100 (+6%) | 2mo | $40,000 | $36 | 50 |
| 712 Chestnut Hill Ave | 0.61mi | 3/1.5 (+1) | 1,120 (+8%) | 2mo | $151,580 | $135 | 49 |
Match score weights: distance 35% · size 25% · config 20% · recency 20%. Top-matched comps best support the ARV.
Projected returns pro-forma
-3.0% appreciation · 1.63% rent growth · sell at horizon
- IRR
- 8.7%
- Equity multiple
- 1.33×
- Total profit
- $9,254
- Equity at exit
- $14,761
- IRR
- 16.6%
- Equity multiple
- 2.27×
- Total profit
- $35,144
- Equity at exit
- $8,560
Cash invested: $27,720 (down + closing). Projections, not guarantees.
Landlord ↔ Tenant lean methodology
- Overall (CITY)
- 12 Strongly Tenant-Friendly
- State Maryland
- 27 Tenant-Leaning · D+14
- County
- — inherits STATE
- City Baltimore
- 12 Strongly Tenant-Friendly · D+58
ZIP-level market 21218
- Rents YoY
- 1.6%
- Active inventory
- 325
- Price-to-rent
- 5.3×
Monthly cashflow live
- Estimated rent
- $1,568 high interval (Pro) →
- Mortgage (P&I)
- −$519
- Tax from tax record
- −$250 /mo · $2,995/yr
- Insurance
- −$41
- HOA
- −$0
- Vacancy / Maint / Mgmt
- −$329
- Net cashflow
- $429
Break-even live
UW: 25.0% down · 7.5% · 30yr · 1.5% tax · 5.0% vac · 8.0% maint · 8.0% mgmt
Financing live
Cash to close
- Down payment
- $24,750
- Closing costs
- $2,970
- Reserves months
- —
- Total cash needed
- —
Loan-product check · same deal, 3 products live
Conventional
25% down · 7.5% · 30yr
- Down + closing
- —
- Monthly P&I
- —
- Monthly cashflow
- —
- DSCR
- —
- Eligible?
- —
Personal DTI + credit; lowest rate.
DSCR
20% down · 8.5% · 30yr
- Down + closing
- —
- Monthly P&I
- —
- Monthly cashflow
- —
- DSCR
- —
- Eligible?
- —
No personal income docs; deal must DSCR.
Hard money
10% down · 12.0% · 12mo
- Down + closing
- —
- Monthly P&I
- —
- Monthly cashflow
- —
- DSCR
- —
- Eligible?
- —
Short-term bridge; refi at stabilization.
Rent comps 40 comps
| Address | Beds | Baths | Sqft | Rent | $/sqft | DOM | Units | Dist |
|---|---|---|---|---|---|---|---|---|
| 936 Montpelier St Baltimore, MD | 2.0 | 1.0 | 1260 | $1,450 | $1.15 | 24d | 1 | 0.13mi |
| 3026 Mathews St Baltimore, MD | 2.0 | 1.0 | 996 | $1,350 | $1.36 | 14d | 1 | 0.28mi |
| 3012 Mathews St Baltimore, MD | 2.0 | 1.0 | 996 | $1,100 | $1.10 | 17d | 1 | 0.29mi |
| 616 Montpelier St Baltimore, MD | 3.0 | 1.0 | 1150 | $1,750 | $1.52 | 11d | 1 | 0.30mi |
| 615 Homestead St Unit 1B Baltimore, MD | 1.0 | 1.0 | 700 | $1,225 | $1.75 | 43d | 1 | 0.31mi |
| 1040 E 33rd St Baltimore, MD | 1.0–2.0 | 1.0–2.0 | 775 | $1,525 | $1.97 | 2d | 10 | 0.32mi |
| 2821 Mathews St Unit 27-666 Baltimore, MD | 1.0 | 1.0 | 730 | $1,050 | $1.44 | 24d | 1 | 0.37mi |
| 2821 Mathews St Unit 27-668 Baltimore, MD | 2.0 | 1.0 | 730 | $1,050 | $1.44 | 24d | 1 | 0.37mi |
| 724 E 35th St Baltimore, MD | 3.0 | 1.5 | 1368 | $2,000 | $1.46 | 14d | 1 | 0.38mi |
| 3221 The Alameda Unit 2 Baltimore, MD | 2.0 | 1.0 | 750 | $1,200 | $1.60 | 24d | 1 | 0.41mi |
| 2606 Cecil Ave Baltimore, MD | 2.0 | 1.5 | 1200 | $1,500 | $1.25 | 43d | 1 | 0.42mi |
| 519 E 28th St Baltimore, MD | 3.0 | 2.0 | 1500 | $2,000 | $1.33 | 4d | 1 | 0.43mi |
| 1519 E 28th St Baltimore, MD | 3.0 | 2.0 | 1100 | $1,350 | $1.23 | 43d | 1 | 0.45mi |
| 721 E 36th St Unit Na Baltimore, MD | 2.0 | 1.0 | 1156 | $1,650 | $1.43 | 43d | 1 | 0.45mi |
| 436 Ilchester Ave Unit 2 Baltimore, MD | 1.0 | 1.0 | 985 | $1,195 | $1.21 | 43d | 1 | 0.48mi |
| 436 Ilchester Ave Unit 1 Baltimore, MD | 2.0 | 2.0 | 1002 | $1,350 | $1.35 | 43d | 1 | 0.48mi |
| 402 E 28th St Baltimore, MD | 3.0 | 1.0 | 1436 | $2,200 | $1.53 | 43d | 1 | 0.54mi |
| 3529 Greenmount Ave Baltimore, MD | 3.0 | 2.0 | 1316 | $1,575 | $1.20 | 43d | 1 | 0.55mi |
| 1702 E 32nd St Baltimore, MD | 3.0 | 2.0 | 1344 | $2,300 | $1.71 | 43d | 1 | 0.55mi |
| 450 E Lorraine Ave Baltimore, MD | 3.0 | 1.0 | 1344 | $1,695 | $1.26 | 43d | 1 | 0.58mi |
| 428 E Lorraine Ave Unit 1 Baltimore, MD | 3.0 | 1.5 | 1344 | $1,875 | $1.40 | 43d | 1 | 0.60mi |
| 428 E Lorraine Ave Baltimore, MD | 3.0 | 2.0 | 1344 | $1,875 | $1.40 | 24d | 1 | 0.60mi |
| 1502 Fernley Rd Baltimore, MD | 3.0 | 2.0 | 1350 | $2,800 | $2.07 | 43d | 1 | 0.61mi |
| 3221 Guilford Ave Apt A Baltimore, MD | 3.0 | 1.5 | 1025 | $2,925 | $2.85 | 17d | 1 | 0.61mi |
| 600 E 37th St Apt 1 Baltimore, MD | 1.0 | 1.0 | 720 | $1,360 | $1.89 | 16d | 1 | 0.62mi |
| 600 E 37th St Apt 2 Baltimore, MD | 1.0 | 1.0 | 800 | $1,350 | $1.69 | 43d | 1 | 0.62mi |
| 2535 Greenmount Ave Unit 2 Baltimore, MD | 2.0 | 1.0 | 800 | $1,195 | $1.49 | 43d | 1 | 0.62mi |
| 612 Chestnut Hill Ave Unit 1 Baltimore, MD | 2.0 | 1.0 | 900 | $1,999 | $2.22 | 43d | 1 | 0.62mi |
| 400 E Lorraine Ave Baltimore, MD | 3.0 | 1.0 | 1500 | $1,800 | $1.20 | 20d | 1 | 0.63mi |
| 411 E Lorraine Ave Baltimore, MD | 3.0 | 1.5 | 1344 | $2,200 | $1.64 | 24d | 1 | 0.63mi |
| 3126 Guilford Ave Apt A Baltimore, MD | 2.0 | 1.0 | 700 | $1,770 | $2.53 | 3d | 1 | 0.63mi |
| 1802 E 28th St Baltimore, MD | 3.0 | 1.0 | 1300 | $1,600 | $1.23 | 24d | 1 | 0.63mi |
| 3130 Guilford Ave Apt B Baltimore, MD | 2.0 | 1.0 | 700 | $1,790 | $2.56 | 17d | 1 | 0.63mi |
| 3721 Ellerslie Ave Baltimore, MD | 1.0–3.0 | 1.0–2.0 | 894 | $1,382 | $1.54 | 1d | 1 | 0.64mi |
| 1815 E 29th St Baltimore, MD | 1.0 | 1.5 | 800 | $1,015 | $1.27 | 24d | 1 | 0.65mi |
| 1832 E 28th St Baltimore, MD | 3.0 | 1.0 | 1066 | $1,495 | $1.40 | 24d | 1 | 0.67mi |
| 205 E 30th St Baltimore, MD | 1.0 | 1.0 | 900 | $1,450 | $1.61 | 11d | 1 | 0.67mi |
| 3135 N Calvert St Baltimore, MD | 1.0 | 1.0 | 1000 | $1,450 | $1.45 | 17d | 1 | 0.67mi |
| 1504 Upshire Rd Unit 1E Baltimore, MD | 2.0 | 1.0 | 1000 | $1,400 | $1.40 | 43d | 1 | 0.69mi |
| 2516 Barclay St Baltimore, MD | 3.0 | 1.0 | 992 | $1,375 | $1.39 | 16d | 1 | 0.70mi |
Listing history 50 events
-
2026-06-18days on market $99,000 Active 67 DOM
-
2026-06-17days on market $99,000 Active 66 DOM
-
2026-06-16days on market $99,000 Active 65 DOM
-
2026-06-15days on market $99,000 Active 64 DOM
-
2026-06-13days on market $99,000 Active 62 DOM
-
2026-06-09days on market $99,000 Active 58 DOM
-
2026-06-08days on market $99,000 Active 57 DOM
-
2026-06-07days on market $99,000 Active 56 DOM
-
2026-06-04days on market $99,000 Active 53 DOM
-
2026-06-03days on market $99,000 Active 52 DOM
-
2026-06-02days on market $99,000 Active 51 DOM
-
2026-06-01days on market $99,000 Active 50 DOM
-
2026-05-31days on market $99,000 Active 49 DOM
-
2026-05-08status Active 389-char remark
Show marketing remark (389 chars)
3 BR, 1 BA detached home in Better Waverly, rehabbed in 2021, including New Systems and appliances. Conveniently located behind Johns Hopkins at Eastern High Campus, a few blocks from Waverly YMCA, Stadium Place, Waverly Farmer's Market, to name a few. Close to public transportation. $5,000 Grant for Johns Hopkins qualified Full Time Employees (Check with HR for eligibility). Sold As-Is
-
2026-04-17status Pending 389-char remark
Show marketing remark (389 chars)
3 BR, 1 BA detached home in Better Waverly, rehabbed in 2021, including New Systems and appliances. Conveniently located behind Johns Hopkins at Eastern High Campus, a few blocks from Waverly YMCA, Stadium Place, Waverly Farmer's Market, to name a few. Close to public transportation. $5,000 Grant for Johns Hopkins qualified Full Time Employees (Check with HR for eligibility). Sold As-Is
-
2026-03-30status Active 389-char remark
Show marketing remark (389 chars)
3 BR, 1 BA detached home in Better Waverly, rehabbed in 2021, including New Systems and appliances. Conveniently located behind Johns Hopkins at Eastern High Campus, a few blocks from Waverly YMCA, Stadium Place, Waverly Farmer's Market, to name a few. Close to public transportation. $5,000 Grant for Johns Hopkins qualified Full Time Employees (Check with HR for eligibility). Sold As-Is
-
2026-03-21status Pending 389-char remark
Show marketing remark (389 chars)
3 BR, 1 BA detached home in Better Waverly, rehabbed in 2021, including New Systems and appliances. Conveniently located behind Johns Hopkins at Eastern High Campus, a few blocks from Waverly YMCA, Stadium Place, Waverly Farmer's Market, to name a few. Close to public transportation. $5,000 Grant for Johns Hopkins qualified Full Time Employees (Check with HR for eligibility). Sold As-Is
-
2026-03-20historical Active Under Contract 389-char remark
Show marketing remark (389 chars)
3 BR, 1 BA detached home in Better Waverly, rehabbed in 2021, including New Systems and appliances. Conveniently located behind Johns Hopkins at Eastern High Campus, a few blocks from Waverly YMCA, Stadium Place, Waverly Farmer's Market, to name a few. Close to public transportation. $5,000 Grant for Johns Hopkins qualified Full Time Employees (Check with HR for eligibility). Sold As-Is
-
2026-03-12$99,000 Active 389-char remark
Show marketing remark (389 chars)
3 BR, 1 BA detached home in Better Waverly, rehabbed in 2021, including New Systems and appliances. Conveniently located behind Johns Hopkins at Eastern High Campus, a few blocks from Waverly YMCA, Stadium Place, Waverly Farmer's Market, to name a few. Close to public transportation. $5,000 Grant for Johns Hopkins qualified Full Time Employees (Check with HR for eligibility). Sold As-Is
-
2026-03-10historical $99,000 389-char remark
Show marketing remark (389 chars)
3 BR, 1 BA detached home in Better Waverly, rehabbed in 2021, including New Systems and appliances. Conveniently located behind Johns Hopkins at Eastern High Campus, a few blocks from Waverly YMCA, Stadium Place, Waverly Farmer's Market, to name a few. Close to public transportation. $5,000 Grant for Johns Hopkins qualified Full Time Employees (Check with HR for eligibility). Sold As-Is
-
2025-12-18historical
-
2025-12-05price $124,900
-
2025-11-21price $134,000
-
2025-11-18$139,000 Active
-
2021-06-07soldstatus $100,000
-
2021-03-26soldstatus $100,000 Closed
-
2021-02-25historical Active Under Contract
-
2021-02-19$115,000 Active
-
2020-12-31historical
-
2020-12-08price $60,000
-
2020-11-18$25,000 Active
-
2020-01-20historical
-
2019-10-10price $89,500
-
2019-10-05price $94,500
-
2019-09-30price $99,500
-
2019-09-30price $99,999
-
2019-09-25price $105,000
-
2019-09-18$110,000 Active
-
2017-04-06soldstatus $12,000 Sold
-
2017-04-06soldstatus $12,000
-
2017-03-15status Contract
-
2017-03-08price $15,000
-
2017-03-08status Active
-
2017-03-08historical Expired
-
2017-02-22price $16,000
-
2017-02-22status Active
-
2017-02-06historical Contingent (Kick Out)
-
2016-11-02price $30,000
-
2016-11-02price $25,000
-
2016-10-17price $35,000
ⓘ Source: listings_history table (triggers on properties + properties_extension) + one-shot
backfill from property_details.listing_events for pre-trigger history.
Tax reassessment forecast MD · Partial reset (capped growth)
- Current annual tax
- $2,995 · $250/mo
- Projected year-2 tax
- $2,995 · $250/mo
- Expected delta
- $0/yr ($0/mo · 0.0%)
ⓘ Screening estimate from a state-policy table — verify with the county assessor before closing.
Climate risk First Street
- Flood 1/10 Low FEMA zone X (unshaded) · 0% chance over 30 yrs
- Wildfire 1/10 Low
- Heat 7/10 Severe 7 d/yr ≥103°F today · 15 d/yr by 30 yrs out
- Wind 6/10 Major 27% chance of damaging wind over 30 yrs
- Air quality 4/10 Moderate 6 unhealthy d/yr today · 7 by 30 yrs out
Nearby sold comps map
Loading sold comps map…
Walkable amenities ~0.75 mi
Loading nearby amenities…
Taxation est. · year 1
- Rental income
- $18,821
- − Mortgage interest
- −$5,546
- − Property taxes
- −$2,995
- − Insurance
- −$495
- − Repairs & maintenance
- −$1,506
- − Management
- −$1,506
- − Depreciation
- −$2,880
- Taxable income
- $3,894
- Est. tax owed @ 24.0%
- −$935
- After-tax cash flow
- $4,214/yr
For passive investors: Depreciation is non-cash, so a rental often shows a tax loss while cash-flowing — sheltering income. Rental losses are passive: they offset passive income freely, and up to $25,000/yr can offset ordinary (W-2) income if you actively participate and your MAGI is under $100k (phasing out to $0 by $150k); unused losses carry forward. On sale, claimed depreciation is recaptured at up to 25%, and gains may owe capital-gains tax (a 1031 exchange can defer both). Figures are a year-1 estimate at your 24.0% rate — not tax advice; consult a CPA.
Schools (NCES district)
- District
- Baltimore City Public Schools
- NCES district ID
- 2400090
- Math proficiency
- 7% ▼ -9.00%
- Reading proficiency
- 16% ▼ -5.00%
- Median HH income
- $42,108
- Composite
- 10.08/100
- National rank
- #9805
- State rank
- #24 of 24 in MD
Livability — Baltimore
- Score
- 76/100
- State rank
- #90
- US rank
- #3396
Category grades
Schools grade is shown separately in the Schools card above.
Census & demographics
- Census place
- Baltimore, MD
- County
- Baltimore City · 558,601 people
- City population
- 588,727
- Metro
- Baltimore-Columbia-Towson, MD
- Population (ZIP)
- 44,014
- Household income
- $62,488
- Rent vs Own
- Severe rent burden
- 2564.0
Population outlook (Baltimore County) Hauer SSP2
- Today (2025)
- 624,249 people
- By 2030
- 621,541 · -0.4%
- By 2040
- 609,756 · -2.3%
- By 2050
- 597,249 · -4.3%
- By 2075
- 552,236 · -11.5%
- By 2100
- 513,934 · -17.7%
Race, ethnicity, and origin ACS 2023
- Neighborhood character
- Diverse neighborhood (Simpson 0.58)
- Race & ethnicity
- Black 60% White 26% Two or more races 6% Hispanic / Latino 5% Asian 5%
- Hispanic origin (detail)
- Common ancestry
- Romanian 2% Italian 1% Scotch-Irish 1%
- Foreign-born
- 10% · Canada, China, South Korea
- Languages at home
- 87% English-only · Spanish 4% French/Haitian/Cajun 2% Chinese 2%
Political lean MEDSL · Baltimore
- 2024 margin
- Solid D (+73.0) · D 85.2% · R 12.2% · Other 2.6%
- 2008→2024 swing
- -2.5pp toward R · 2008: 75.5pp · 2024: 73.0pp
- All cycles
- 2024: D+73.0 2020: D+76.6 2016: D+74.6 2012: D+76.4 2008: D+75.5
Not yet ingested
- Civics
- —
Market trends
- HPI YoY
- ▼ -463.14%
- Current HPI
- 292.3986
- Rent YoY
- ▲ 1.63%
- Metro
- Baltimore-Columbia-Towson, MD
- State GDP YoY
- ▲ 2.97%
- F500 in state
- 12
Industry mix (Fortune 500 HQ in MD)
| Industry | F500 HQs | Revenue |
|---|---|---|
| Aerospace / Defense | 1 | $71B |
|
||
| Utilities | 1 | $25B |
|
||
| Hotels | 1 | $24B |
|
||
| Consumer Goods | 1 | $7B |
|
||
| Real Estate | 1 | $6B |
|
||
| Chemicals | 1 | $2B |
|
||
Price history
+153.8% since first listed38 events — show timeline
- 2026-05-08 Relisted — BRIGHT MLS
- 2026-04-17 Pending — BRIGHT MLS
- 2026-03-30 Relisted — BRIGHT MLS
- 2026-03-21 Pending — BRIGHT MLS
- 2026-03-20 Contingent — BRIGHT MLS
- 2026-03-12 Listed $99,000 BRIGHT MLS
- 2026-03-10 Coming Soon $99,000 BRIGHT MLS
- 2025-12-18 Listing Removed — BRIGHT MLS
- 2025-12-05 Price Changed $124,900 BRIGHT MLS
- 2025-11-21 Price Changed $134,000 BRIGHT MLS
- 2025-11-18 Listed $139,000 BRIGHT MLS
- 2021-06-07 Sold (Public Records) $100,000 Public Records
- 2021-03-26 Sold (MLS) $100,000 BRIGHT MLS
- 2021-02-25 Contingent — BRIGHT MLS
- 2021-02-19 Listed $115,000 BRIGHT MLS
- 2020-12-31 Listing Removed — BRIGHT MLS
- 2020-12-08 Price Changed $60,000 BRIGHT MLS
- 2020-11-18 Listed $25,000 BRIGHT MLS
- 2020-01-20 Listing Removed — BRIGHT MLS
- 2019-10-10 Price Changed $89,500 BRIGHT MLS
- 2019-10-05 Price Changed $94,500 BRIGHT MLS
- 2019-09-30 Price Changed $99,500 BRIGHT MLS
- 2019-09-30 Price Changed $99,999 BRIGHT MLS
- 2019-09-25 Price Changed $105,000 BRIGHT MLS
- 2019-09-18 Listed $110,000 BRIGHT MLS
- 2017-04-06 Sold (MLS) $12,000 BRIGHT MLS
- 2017-04-06 Sold (MLS) $12,000 MRIS
- 2017-03-15 Pending — MRIS
- 2017-03-08 Price Changed $15,000 MRIS
- 2017-03-08 Relisted — MRIS
- 2017-03-08 Delisted — MRIS
- 2017-02-22 Price Changed $16,000 MRIS
- 2017-02-22 Relisted — MRIS
- 2017-02-06 Contingent — MRIS
- 2016-11-02 Price Changed $30,000 MRIS
- 2016-11-02 Price Changed $25,000 MRIS
- 2016-10-17 Price Changed $35,000 MRIS
- 2016-10-03 Listed $39,000 MRIS
Property tax history
+5.0%/yrLatest (2025): $2,995 · +6.6% YoY. Source: county tax records.
Cash-flow waterfall
monthlySold comps — $/sqft
last 12 mo · ≤1 miLoading sold comps…