4925 Praline Dr · Princeton, TX
Flood risk 1/10 · Minimal
- FEMA flood zone
- X (unshaded)
- Chance of flooding over 30 yrs
- 0.0%
- Est. flood insurance / yr
- $507 – $1,088
Fire risk 5/10 · Moderate
- Est. fire insurance / yr
- $1,222 – $2,270
Heat risk 7/10 · Major
- Hot days now (above 111°F)
- 7 days/yr
- Hot days in 30 yrs
- 23 days/yr
Wind risk 6/10 · Moderate
- Chance of severe wind over 30 yrs
- 27.0%
Air-quality risk 3/10 · Minor
- Unhealthy air days now
- 3 days/yr
- Unhealthy air days in 30 yrs
- 3 days/yr
Risk factors via First Street. Map © Google.
Why this score? — see what drove the C+ grade
The composite is a weighted blend of 9 inputs, each scored 0–100. Each bar is that input's sub-score; the figure is the points it added to the 100-point composite (weight × sub-score).
- Cash flow +22.3/30.0
- ARV discount +14.4/15.0
- DSCR +7.2/10.0
- 1% rule +6.3/10.0
- Schools +4.2/10.0
- Condition / age +4.0/5.0
- Livability +3.1/5.0
- Rent growth +2.2/5.0
- Appreciation +0.0/10.0
$175,999
🖨 Deal sheet 📄 Offer letter ✓ Due diligence
Listing remarks
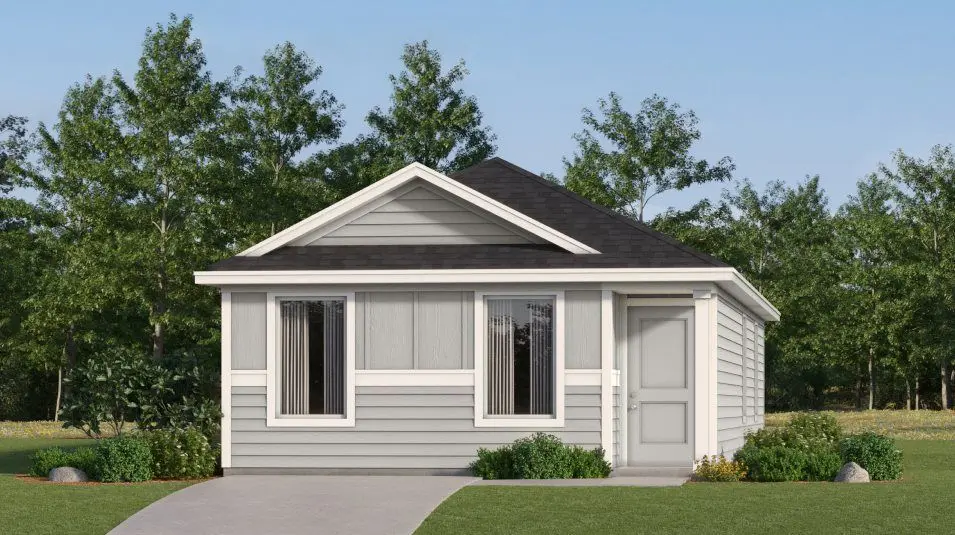
This single-level home showcases a spacious open floorplan shared between the kitchen, dining area and family room for easy entertaining during gatherings. An owner's suite enjoys a private location in the back of the home, complemented by an en-suite bathroom, walk-in closet and direct access to the backyard space. There are two secondary bedrooms that are both ideal for household members and overnight guests.
Key facts
- 4,400 sq ft lot
- 2 garage spots
- Built 2026
Property features AI
Finance
- Other: Address: 4925 Praline Dr, Princeton, TX 75407; Last modified: 2026-06-02
- Financial info: Listing status: Active; List price: 175999
Exterior
- Home design: Single-family property (Windrow plan)
- Construction: New construction (spec)
- Exterior features: Living area of 1,033
Interior
- Bedrooms: 3 bedrooms
- Bathrooms: 2 full bathrooms
- Interior features: Spec home (new construction, Windrow plan); 2 total bathrooms
Neighborhood map
What this means for you Summary
Snapshot
- This is a 3-bed/2.0-bath single-family listed at $176k. Condition is rated good.
Deal economics
- At list price, monthly cash flow is $291 ($3k/yr) — positive.
- The deal already cash-flows at list — no discount required.
- Meets the 1% rule at list price ($2k rent vs $176k).
- Cap rate 8.3% vs local median 4.5% in Princeton — top-decile yield for the area; either an underpriced asset or a hidden risk that comps aren't pricing in. Stress-test before assuming the spread holds.
Location & tenants
- Location reads 62/100 on livability (#969 in TX) — a middle-class / working-renter tenant base. Strengths: employment A+, housing A+, cost of living A; Watch: schools C-, amenities F, commute F.
- Princeton ISD (suburban): math 51% / reading 47% proficiency, ranked #188 of 826 in TX (top 23%) — families likely to look elsewhere, expect single-tenant / working-renter base with shorter leases.
- Market conditions: Rents soft (-1.0%/yr); 1404 active listings in the ZIP; 37 comparable units currently listed for rent nearby; rentals at typical pace (median 21d on market — plan ~3-4 weeks tenant-placement turnaround); solid renter incomes; 19,194 units permitted in Collin County in 2024 (3,988 in 5+ unit buildings).
Forward outlook
- Local home prices are declining (-3.0%/yr); year-one equity from $1k of loan paydown is wiped out by about $5k of value loss. Plan a longer hold.
- Collin County population projected at +60% by 2050 — long-run rental-demand tailwind backs the buy-and-hold thesis.
Negotiation context
- Only 6 days on market — expect competitive offers; lowballing is unlikely to land.
Risks & watch-outs
- Climate carrying-cost: major wind risk, 27% chance of damaging wind over 30y; moderate wildfire risk; extreme-heat days projected 7→23/yr by 2055 (HVAC capex compounding) — expect insurance premiums to compound above CPI over the hold.
Questions for the listing agent
- What does the HOA fee cover, when was the last increase, and are there any pending special assessments or reserve-fund shortfalls?
- Is there a deadline driving the sale (1031 exchange, divorce, estate, relocation)? That informs how much negotiation room exists.
- What's the average days-on-market for RENTAL listings here right now (not sales)? A rising rental-DOM trend means longer vacancies and softer asking-rent achievability than the comps imply.
- What's the recent tenant-quality profile in this submarket — average credit score on applications, eviction rate, late-payment / NSF rate, and stable-employment percentage? A property-management company in the area should have these aggregated.
- How much new for-sale + rental construction is in the pipeline within 1–3 miles? Heavy new supply typically softens prices + rents 12–24 months out; constrained supply supports both.
Investment metrics
- 1% rule
- 1.13% ✓
- Cap rate
- 8.28%
- Cash-on-cash
- 7.10%
- DSCR
- 1.32
- GRM
- 7.4
CMA / ARV
- ARV (on-the-fly)
- $207,633
- Comps found
- 3
Show comp detail 3 sales within ~0.75 mi
| Address | Dist | Beds/Ba | Sqft | Sold | Price | $/sf | Match |
|---|---|---|---|---|---|---|---|
| 207 Lemongrass | 0.60mi | 2/1.0 (-1) | 1,039 (+1%) | 8mo | $187,900 | $181 | 55 |
| 115 Lemongrass Dr | 0.58mi | 2/1.0 (-1) | 1,039 (+1%) | 13mo | $215,000 | $207 | 53 |
| 318 Moray Dr | 0.74mi | 2/1.0 (-1) | 1,047 (+1%) | 8mo | $210,000 | $201 | 48 |
Match score weights: distance 35% · size 25% · config 20% · recency 20%. Top-matched comps best support the ARV.
Projected returns pro-forma
-3.0% appreciation · 0.0% rent growth · sell at horizon
- IRR
- -9.0%
- Equity multiple
- 0.68×
- Total profit
- $-15,708
- Equity at exit
- $26,242
- IRR
- -4.3%
- Equity multiple
- 0.76×
- Total profit
- $-11,982
- Equity at exit
- $15,217
Cash invested: $49,280 (down + closing). Projections, not guarantees.
Landlord ↔ Tenant lean methodology
- Overall (STATE)
- 87 Strongly Landlord-Friendly
- State Texas
- 87 Strongly Landlord-Friendly · R+5
- County
- — inherits STATE
- City
- — inherits STATE
ZIP-level market 75407
- Home prices YoY
- -30.3%
- Rents YoY
- -1.0%
- Active inventory
- 1404
- Price-to-rent
- 7.4×
Monthly cashflow live
- Estimated rent
- $1,984 high interval (Pro) →
- Mortgage (P&I)
- −$923
- Tax est. 1.5%
- −$220 /mo · $2,640/yr
- Insurance
- −$73
- HOA
- −$60
- Vacancy / Maint / Mgmt
- −$417
- Net cashflow
- $291
Break-even live
UW: 25.0% down · 7.5% · 30yr · 1.5% tax · 5.0% vac · 8.0% maint · 8.0% mgmt
Financing live
Cash to close
- Down payment
- $44,000
- Closing costs
- $5,280
- Reserves months
- —
- Total cash needed
- —
Loan-product check · same deal, 3 products live
Conventional
25% down · 7.5% · 30yr
- Down + closing
- —
- Monthly P&I
- —
- Monthly cashflow
- —
- DSCR
- —
- Eligible?
- —
Personal DTI + credit; lowest rate.
DSCR
20% down · 8.5% · 30yr
- Down + closing
- —
- Monthly P&I
- —
- Monthly cashflow
- —
- DSCR
- —
- Eligible?
- —
No personal income docs; deal must DSCR.
Hard money
10% down · 12.0% · 12mo
- Down + closing
- —
- Monthly P&I
- —
- Monthly cashflow
- —
- DSCR
- —
- Eligible?
- —
Short-term bridge; refi at stabilization.
Rent comps 37 comps
| Address | Beds | Baths | Sqft | Rent | $/sqft | DOM | Units | Dist |
|---|---|---|---|---|---|---|---|---|
| 108 Wyndemere Ln Princeton, TX | 3.0 | 2.0 | 1438 | $2,100 | $1.46 | 43d | 1 | 0.40mi |
| 5105 Greywing Dr Princeton, TX | 3.0 | 2.0 | 1438 | $1,895 | $1.32 | 17d | 1 | 0.53mi |
| 136 Honeysuckle St Princeton, TX | 3.0 | 2.0 | 1267 | $1,700 | $1.34 | 43d | 1 | 0.64mi |
| 5504 Rockrose Ln Princeton, TX | 3.0 | 2.0 | 1479 | $1,999 | $1.35 | 4d | 1 | 0.72mi |
| 510 Olmstead Dr Princeton, TX | 3.0 | 2.0 | 1260 | $2,395 | $1.90 | 5d | 1 | 0.79mi |
| 119 Cypress Ln Princeton, TX | 3.0 | 2.0 | 1260 | $1,750 | $1.39 | 43d | 1 | 0.81mi |
| 5644 Rockrose Ln Princeton, TX | 3.0 | 2.0 | 1262 | $1,800 | $1.43 | 43d | 1 | 0.88mi |
| 320 Dewberry St Princeton, TX | 3.0 | 2.0 | 1481 | $1,745 | $1.18 | 12d | 1 | 0.89mi |
| 5213 Longshadow Dr Princeton, TX | 3.0 | 2.0 | 1260 | $2,035 | $1.62 | 5d | 1 | 0.90mi |
| 5708 Rockrose Ln Princeton, TX | 3.0 | 2.0 | 1440 | $1,925 | $1.34 | 43d | 1 | 0.92mi |
| 5720 Rockrose Ln Princeton, TX | 4.0 | 3.0 | 1500 | $2,205 | $1.47 | 5d | 1 | 0.95mi |
| 330 Ashbrook Way Princeton, TX | 3.0 | 2.0 | 1479 | $1,800 | $1.22 | 18d | 1 | 0.95mi |
| 5724 Rockrose Ln Princeton, TX | 3.0 | 2.0 | 1266 | $2,050 | $1.62 | 24d | 1 | 0.95mi |
| 5733 Rockrose Ln Princeton, TX | 3.0 | 2.0 | 1266 | $1,720 | $1.36 | 43d | 1 | 0.96mi |
| 5322 Longshadow Dr Princeton, TX | 3.0 | 2.0 | 1407 | $1,899 | $1.35 | 20d | 1 | 0.96mi |
| 5322 Longshadow Dr Princeton, TX | 3.0 | 2.0 | 1407 | $1,699 | $1.21 | 1d | 1 | 0.96mi |
| 617 Dashwood Dr Princeton, TX | 3.0 | 2.0 | 1440 | $1,619 | $1.12 | 2d | 1 | 0.97mi |
| 718 Trestle Dr Princeton, TX | 2.0 | 1.0 | 1012 | $1,750 | $1.73 | 16d | 1 | 0.97mi |
| 403 Ashbrook Way Princeton, TX | 3.0 | 2.0 | 1485 | $1,849 | $1.25 | 24d | 1 | 0.98mi |
| 403 Ashbrook Way Princeton, TX | 3.0 | 2.0 | 1485 | $1,749 | $1.18 | 5d | 1 | 0.98mi |
| 5817 Rockrose Ln Princeton, TX | 3.0 | 2.0 | 1411 | $1,624 | $1.15 | 20d | 1 | 1.00mi |
| 427 Ashbrook Way Princeton, TX | 3.0 | 2.0 | 1482 | $1,800 | $1.21 | 3d | 1 | 1.01mi |
| 5825 Rockrose Ln Princeton, TX | 3.0 | 2.0 | 1440 | $1,780 | $1.24 | 43d | 1 | 1.02mi |
| 318 Mahogany Ln Princeton, TX | 3.0 | 2.0 | 1479 | $1,800 | $1.22 | 24d | 1 | 1.03mi |
| 5324 Vinebrook Way Princeton, TX | 3.0 | 2.0 | 1262 | $1,695 | $1.34 | 43d | 1 | 1.03mi |
| 5836 Timber Point Dr Princeton, TX | 3.0 | 2.0 | 1440 | $1,875 | $1.30 | 18d | 1 | 1.03mi |
| 5318 Curwood Dr Princeton, TX | 3.0 | 2.0 | 1440 | $1,650 | $1.15 | 43d | 1 | 1.07mi |
| 228 Rubylace Dr Princeton, TX | 3.0 | 2.0 | 1436 | $1,700 | $1.18 | 43d | 1 | 1.07mi |
| 501 Yellow Rose Rd Princeton, TX | 3.0 | 2.0 | 1294 | $2,000 | $1.55 | 43d | 1 | 1.09mi |
| 5808 Cherry Hollow Way Princeton, TX | 3.0 | 2.0 | 1260 | $1,749 | $1.39 | 17d | 1 | 1.11mi |
| 5836 Crystal Water Way Princeton, TX | 3.0 | 2.0 | 1481 | $1,799 | $1.21 | 5d | 1 | 1.11mi |
| 5847 Rock Maple Dr Princeton, TX | 3.0 | 2.0 | 1481 | $1,785 | $1.21 | 7d | 1 | 1.14mi |
| 5847 Rock Maple Dr Princeton, TX | 3.0 | 2.0 | 1481 | $1,785 | $1.21 | 16d | 1 | 1.14mi |
| 3918 Applewood Trl Princeton, TX | 3.0 | 2.0 | 1294 | $1,875 | $1.45 | 21d | 1 | 1.19mi |
| 143 Plumcove Dr Princeton, TX | 3.0 | 3.0 | 1376 | $2,150 | $1.56 | 43d | 1 | 1.24mi |
| 241 Boxberry Way Princeton, TX | 3.0 | 2.0 | 1411 | $1,725 | $1.22 | 43d | 1 | 1.33mi |
| 6018 Primrose Rd , TX | 3.0–4.0 | 2.5 | 1484 | $1,800 | $1.21 | 3d | 5 | 1.49mi |
HOA detail
- Monthly dues
- $60 · $720/yr
Listing history 8 events
-
2026-06-18days on market $175,999 Active 6 DOM
-
2026-06-17days on market $175,999 Active 5 DOM
-
2026-06-16days on market $175,999 Active 4 DOM
-
2026-06-15days on market $175,999 Active 3 DOM
-
2026-06-13days on market $175,999 Active 1 DOM
-
2026-06-09days on market $175,999 Active 2 DOM
-
2026-06-02remarks 414-char remark
-
2026-06-02$175,999 Active 1 DOM
ⓘ Source: listings_history table (triggers on properties + properties_extension) + one-shot
backfill from property_details.listing_events for pre-trigger history.
Climate risk First Street
- Flood 1/10 Low FEMA zone X (unshaded) · 0% chance over 30 yrs
- Wildfire 5/10 Major
- Heat 7/10 Severe 7 d/yr ≥111°F today · 23 d/yr by 30 yrs out
- Wind 6/10 Major 27% chance of damaging wind over 30 yrs
- Air quality 3/10 Moderate 3 unhealthy d/yr today · 3 by 30 yrs out
Nearby sold comps map
Loading sold comps map…
Walkable amenities ~0.75 mi
Loading nearby amenities…
Taxation est. · year 1
- Rental income
- $23,813
- − Mortgage interest
- −$9,859
- − Property taxes
- −$2,640
- − Insurance
- −$880
- − Repairs & maintenance
- −$1,905
- − Management
- −$1,905
- − HOA
- −$720
- − Depreciation
- −$5,120
- Taxable income
- $785
- Est. tax owed @ 24.0%
- −$188
- After-tax cash flow
- $3,309/yr
For passive investors: Depreciation is non-cash, so a rental often shows a tax loss while cash-flowing — sheltering income. Rental losses are passive: they offset passive income freely, and up to $25,000/yr can offset ordinary (W-2) income if you actively participate and your MAGI is under $100k (phasing out to $0 by $150k); unused losses carry forward. On sale, claimed depreciation is recaptured at up to 25%, and gains may owe capital-gains tax (a 1031 exchange can defer both). Figures are a year-1 estimate at your 24.0% rate — not tax advice; consult a CPA.
Condition & rehab AI · 12 photos
This single-level home features a spacious open floorplan with modern amenities and a good condition. It is ready for move-in and would benefit from a fresh coat of paint on the exterior to enhance its curb appeal and value.
Value-add opportunities
- Both Paint exterior siding — Enhances curb appeal and value
- Both Clean windows — Improves natural light and air circulation
Renovation cost estimate screening
Value-add ROI direction
- Both Paint exterior siding — Enhances curb appeal and value ↑
- Both Clean windows — Improves natural light and air circulation ↑
ⓘ Cost ranges are severity-bucket heuristics (US national rule-of-thumb). Get contractor quotes + a written scope before underwriting a rehab budget.
Schools (NCES district)
- District
- Princeton ISD
- NCES district ID
- 4835850
- Math proficiency
- 51% ▼ -8.00%
- Reading proficiency
- 47% ▬ 0.00%
- Median HH income
- $54,827
- Composite
- 42.44/100
- National rank
- #3226
- State rank
- #188 of 826 in TX
Livability — Princeton
- Score
- 62/100
- State rank
- #969
- US rank
- #17215
Category grades
Schools grade is shown separately in the Schools card above.
Census & demographics
- County
- Collin County · 1,159,394 people
- City population
- 34,171
- Metro
- Dallas-Fort Worth-Arlington, TX
- Population (ZIP)
- 34,171
- Household income
- $100,037
- Rent vs Own
- Severe rent burden
- 368.0
Population outlook (Collin County) Hauer SSP2
- Today (2025)
- 1,210,074 people
- By 2030
- 1,358,201 · +12.2%
- By 2040
- 1,654,061 · +36.7%
- By 2050
- 1,937,359 · +60.1%
- By 2075
- 2,567,039 · +112.1%
- By 2100
- 2,952,048 · +144.0%
Race, ethnicity, and origin ACS 2023
- Neighborhood character
- Diverse neighborhood (Simpson 0.66)
- Race & ethnicity
- White 47% Hispanic / Latino 30% Black 17% Two or more races 10% Asian 4% Native American 1%
- Hispanic origin (detail)
- Mexican 26%
- Common ancestry
- Lithuanian 2% Romanian 1% Russian 1%
- Foreign-born
- 15% · Canada, China, Mexico
- Languages at home
- 70% English-only · Spanish 22% Other Indo-European 2% Other Asian/Pacific 1%
Political lean MEDSL · Collin
- 2024 margin
- R (+11.1) · D 43.1% · R 54.3% · Other 2.6%
- 2008→2024 swing
- +14.4pp toward D · 2008: -25.6pp · 2024: -11.1pp
- All cycles
- 2024: R+11.1 2020: R+4.3 2016: R+17.0 2012: R+31.6 2008: R+25.6
Not yet ingested
- Civics
- —
Market trends
- HPI YoY
- ▼ -103.99%
- Current HPI
- 238.9373
- Rent YoY
- ▼ -1.02%
- Metro
- Dallas-Fort Worth-Arlington, TX
- State GDP YoY
- ▲ 3.95%
- F500 in state
- 110
Industry mix (Fortune 500 HQ in TX)
| Industry | F500 HQs | Revenue |
|---|---|---|
| Energy | 16 | $1,198B |
|
||
| Technology | 5 | $198B |
|
||
| Engineering / Construction | 4 | $72B |
|
||
| Energy Services | 3 | $60B |
|
||
| Utilities | 3 | $41B |
|
||
| Healthcare | 2 | $330B |
|
||
Cash-flow waterfall
monthlySold comps — $/sqft
last 12 mo · ≤1 miLoading sold comps…