509 N Rosemary Ave · Andrews, SC
Flood risk 1/10 · Minimal
- FEMA flood zone
- X (unshaded)
- Chance of flooding over 30 yrs
- 0.0%
- Est. flood insurance / yr
- $507 – $1,088
Fire risk 5/10 · Moderate
- Est. fire insurance / yr
- $783 – $1,453
Heat risk 9/10 · Severe
- Hot days now (above 110°F)
- 7 days/yr
- Hot days in 30 yrs
- 19 days/yr
Wind risk 8/10 · Major
- Chance of severe wind over 30 yrs
- 97.0%
Air-quality risk 3/10 · Minor
- Unhealthy air days now
- 2 days/yr
- Unhealthy air days in 30 yrs
- 3 days/yr
Risk factors via First Street. Map © Google.
Why this score? — see what drove the C grade
The composite is a weighted blend of 9 inputs, each scored 0–100. Each bar is that input's sub-score; the figure is the points it added to the 100-point composite (weight × sub-score).
- ARV discount +15.0/15.0
- Cash flow +14.4/30.0
- Appreciation +10.0/10.0
- DSCR +4.4/10.0
- Livability +3.2/5.0
- 1% rule +2.8/10.0
- Schools +2.7/10.0
- Rent growth +2.5/5.0
- Condition / age +2.5/5.0
$145,000
🖨 Deal sheet (PDF) 📄 Offer letter ✓ Due diligence
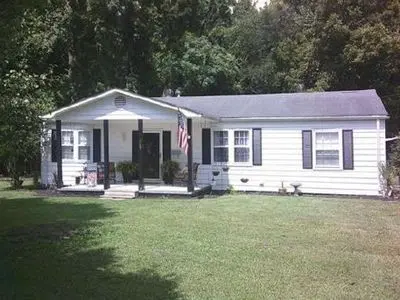
Listing remarks
Beautiful single family home, 3br, 1bth, secluded private residential lot on the outskirts of the city of Andrews, within Georgetown county. This home features a separate living room, dinning room, kitchen with gas appliances, 3 spacious bedrooms original hardwood floors throughout. 1 bathroom centrally located in the home with a large addition on the back of the house accessible through the kitchen that serves as the laundry room. This room includes a built in pantry, utility sick, cabinet for storage, large wall to wall closet along the far wall giving you tons of room for storage and a 3rd access door leading you outside to the covered 2bay carport located at the end of the end of a rock
Key facts
- Laundry room
- Dining room
- Large addition
Tags
Neighborhood map
What this means for you Summary
Snapshot
- This is a 2-bed/1.0-bath single-family listed at $145k.
Deal economics
- At list price, monthly cash flow is $28 ($341/yr) — positive.
- The deal already cash-flows at list — no discount required.
- To meet the 1% rule (rent ≥ 1% of price), the offer needs to be $112k (22.5% below list).
- Recommended offer: $112k (22.5% below list) — sets the bar for 1% rule.
- Cap rate 6.5% vs local median 3.5% in Andrews — top-decile yield for the area; either an underpriced asset or a hidden risk that comps aren't pricing in. Stress-test before assuming the spread holds.
Location & tenants
- Location reads 63/100 on livability (#183 in SC) — a middle-class / working-renter tenant base. Strengths: cost of living A+, housing A+, health & safety A+; Watch: employment D, crime F, amenities F.
- Georgetown 01 (town): math 26% / reading 38% proficiency, ranked #51 of 80 in SC (top 64%) — families likely to look elsewhere, expect single-tenant / working-renter base with shorter leases.
- Zoned schools: Andrews Elementary (math 21% / reading 19%, grade F, #492 of 597 statewide, top 83%, 684 students, 100% FRL); Rosemary Middle (math 9% / reading 17%, grade F, #210 of 229 statewide, top 93%, 378 students, 100% FRL); Andrews High (math 27% / reading 77%, grade D+, #142 of 196 statewide, top 74%, 519 students, 100% FRL) — zoned schools average 100% FRL vs 59% district-wide (41 pts higher); higher-poverty schools than district average — tighter screening recommended.
- Market conditions: 58 active listings in the ZIP; 323 units permitted in Georgetown County in 2024 (0 in 5+ unit buildings).
Forward outlook
- In year one you build about $16k of equity ($1k loan paydown + $14k appreciation (10.0% local appreciation)).
- At projected returns (10.0% appreciation + 3.0% rent growth), your $41k cash investment doubles in ~3 years — after that, you're playing with house money.
- By year 3, paydown + projected appreciation supports a ~$39k cash-out refi (75% LTV) — recoverable capital for the next deal without selling this one.
Negotiation context
- It's been on market 71 days — a 6% lower offer ($136k) is reasonable based on typical stale-listing flexibility.
- Current owner paid $60k; list at $145k implies a 142% gain — meaningful room to come down on a strong offer.
Risks & watch-outs
- Watch-outs: built in 1950 — expect roof / HVAC / electrical / plumbing capex.
- Climate carrying-cost: severe wind risk, 97% chance of damaging wind over 30y; moderate wildfire risk; extreme-heat days projected 7→19/yr by 2055 (HVAC capex compounding) — expect insurance premiums to compound above CPI over the hold.
Questions for the listing agent
- It's been on market 71 days. Have you received any prior offers? Is the seller open to a 22% concession, seller financing, or rate buy-down credit?
- Built in 1950 — when were the roof, HVAC, electrical panel, plumbing, and water heater last replaced?
- Why hasn't it sold? Are there any deal-killer items the seller is aware of (foundation, flood, title, zoning, code violations)?
- Is there a deadline driving the sale (1031 exchange, divorce, estate, relocation)? That informs how much negotiation room exists.
- Schools are F-rated, which usually means shorter tenancies and higher turnover. Who's the typical renter profile here, and what's been the actual vacancy rate?
- Crime grade is F in this area — have there been break-ins, vandalism, or insurance claims at this property in the last 3 years? What carrier currently insures it and at what premium?
- What's the average days-on-market for RENTAL listings here right now (not sales)? A rising rental-DOM trend means longer vacancies and softer asking-rent achievability than the comps imply.
- What's the recent tenant-quality profile in this submarket — average credit score on applications, eviction rate, late-payment / NSF rate, and stable-employment percentage? A property-management company in the area should have these aggregated.
- How much new for-sale + rental construction is in the pipeline within 1–3 miles? Heavy new supply typically softens prices + rents 12–24 months out; constrained supply supports both.
Investment metrics
- 1% rule
- 0.78% ✗
- Cap rate
- 6.53%
- Cash-on-cash
- 0.84%
- DSCR
- 1.04
- GRM
- 10.7
CMA / ARV
- ARV (on-the-fly)
- $183,264
- Comps found
- 7
Show comp detail 7 sales within ~0.75 mi
| Address | Dist | Beds/Ba | Sqft | Sold | Price | $/sf | Match |
|---|---|---|---|---|---|---|---|
| 105 East Cherry St | 0.25mi | 3/1.5 (+1) | 1,320 (-1%) | 4mo | $85,000 | $64 | 77 |
| 604 N Morgan Ave | 0.10mi | 3/1.0 (+1) | 1,200 (-10%) | 2mo | $195,000 | $163 | 73 |
| 109 W Hickory St | 0.24mi | 2/1.0 | 1,196 (-10%) | 5mo | $165,000 | $138 | 68 |
| 8 North Magnolia Ave | 0.48mi | 3/2.0 (+1) | 1,344 (+1%) | 7mo | $200,000 | $149 | 61 |
| 201 N Farr Ave | 0.38mi | 3/1.0 (+1) | 1,248 (-6%) | 24mo | $165,000 | $132 | 47 |
| 611 E Ashland St | 0.69mi | 3/1.0 (+1) | 1,205 (-9%) | 15mo | $145,000 | $120 | 35 |
| 109 S Farr Ave | 0.71mi | 3/1.0 (+1) | 1,175 (-12%) | 21mo | $194,500 | $166 | 26 |
Match score weights: distance 35% · size 25% · config 20% · recency 20%. Top-matched comps best support the ARV.
Projected returns pro-forma
10.0% appreciation · 3.0% rent growth · sell at horizon
- IRR
- 24.9%
- Equity multiple
- 2.99×
- Total profit
- $80,708
- Equity at exit
- $130,627
- IRR
- 21.9%
- Equity multiple
- 6.82×
- Total profit
- $236,111
- Equity at exit
- $281,703
Cash invested: $40,600 (down + closing). Projections, not guarantees.
Landlord ↔ Tenant lean methodology
- Overall (STATE)
- 90 Strongly Landlord-Friendly
- State South Carolina
- 90 Strongly Landlord-Friendly · R+6
- County
- — inherits STATE
- City
- — inherits STATE
ZIP-level market 29510
- Home prices YoY
- 10.2%
- Active inventory
- 58
- Price-to-rent
- 10.7×
Monthly cashflow live
- Estimated rent
- $1,124 medium interval (Pro) →
- Mortgage (P&I)
- −$760
- Tax from tax record
- −$39 /mo · $469/yr
- Insurance
- −$60
- HOA
- −$0
- Vacancy / Maint / Mgmt
- −$236
- Net cashflow
- $28
Break-even live
Sensitivity live
| Price | -10% $110 | -5% $69 | +0% $28 | +5% $-13 | +10% $-54 |
|---|---|---|---|---|---|
| Rent | -10% $-60 | -5% $-16 | +0% $28 | +5% $73 | +10% $117 |
| Rate | -1.0pp $101 | -0.5pp $65 | base $28 | +0.5pp $-9 | +1.0pp $-47 |
UW: 25.0% down · 7.5% · 30yr · 1.5% tax · 5.0% vac · 8.0% maint · 8.0% mgmt
Financing live
Cash to close
- Down payment
- $36,250
- Closing costs
- $4,350
- Reserves months
- —
- Total cash needed
- —
Loan-product check · same deal, 3 products live
Conventional
25% down · 7.5% · 30yr
- Down + closing
- —
- Monthly P&I
- —
- Monthly cashflow
- —
- DSCR
- —
- Eligible?
- —
Personal DTI + credit; lowest rate.
DSCR
20% down · 8.5% · 30yr
- Down + closing
- —
- Monthly P&I
- —
- Monthly cashflow
- —
- DSCR
- —
- Eligible?
- —
No personal income docs; deal must DSCR.
Hard money
10% down · 12.0% · 12mo
- Down + closing
- —
- Monthly P&I
- —
- Monthly cashflow
- —
- DSCR
- —
- Eligible?
- —
Short-term bridge; refi at stabilization.
Listing history 17 events
-
2026-06-22days on market $145,000 Active 71 DOM
-
2026-06-18days on market $145,000 Active 68 DOM
-
2026-06-17days on market $145,000 Active 67 DOM
-
2026-06-16days on market $145,000 Active 66 DOM
-
2026-06-15days on market $145,000 Active 65 DOM
-
2026-06-14days on market $145,000 Active 63 DOM
-
2026-06-10days on market $145,000 Active 60 DOM
-
2026-06-09days on market $145,000 Active 59 DOM
-
2026-06-08days on market $145,000 Active 58 DOM
-
2026-06-07days on market $145,000 Active 57 DOM
-
2026-06-03days on market $145,000 Active 53 DOM
-
2026-06-02days on market $145,000 Active 52 DOM
-
2026-06-01days on market $145,000 Active 51 DOM
-
2026-05-31days on market $145,000 Active 50 DOM
-
2026-05-30days on market $145,000 Active 49 DOM
-
2026-04-10$145,000 Active
-
2023-02-27soldstatus $60,000
ⓘ Source: listings_history table (triggers on properties + properties_extension) + one-shot
backfill from property_details.listing_events for pre-trigger history.
Tax reassessment forecast SC · Resets to sale price
- Current annual tax
- $469 · $39/mo
- Projected year-2 tax
- $826 · $69/mo
- Expected delta
- +$357/yr (+$30/mo · 76.1%)
ⓘ Screening estimate from a state-policy table — verify with the county assessor before closing.
Climate risk First Street
- Flood 1/10 Low FEMA zone X (unshaded) · 0% chance over 30 yrs
- Wildfire 5/10 Major
- Heat 9/10 Extreme 7 d/yr ≥110°F today · 19 d/yr by 30 yrs out
- Wind 8/10 Severe 97% chance of damaging wind over 30 yrs
- Air quality 3/10 Moderate 2 unhealthy d/yr today · 3 by 30 yrs out
Nearby sold comps map
Loading sold comps map…
Walkable amenities ~0.75 mi
Loading nearby amenities…
Taxation est. · year 1
- Rental income
- $13,493
- − Mortgage interest
- −$8,122
- − Property taxes
- −$469
- − Insurance
- −$725
- − Repairs & maintenance
- −$1,079
- − Management
- −$1,079
- − Depreciation
- −$4,218
- Taxable loss
- −$2,200
- Est. tax savings @ 24.0%
- +$528
- After-tax cash flow
- $869/yr
For passive investors: Depreciation is non-cash, so a rental often shows a tax loss while cash-flowing — sheltering income. Rental losses are passive: they offset passive income freely, and up to $25,000/yr can offset ordinary (W-2) income if you actively participate and your MAGI is under $100k (phasing out to $0 by $150k); unused losses carry forward. On sale, claimed depreciation is recaptured at up to 25%, and gains may owe capital-gains tax (a 1031 exchange can defer both). Figures are a year-1 estimate at your 24.0% rate — not tax advice; consult a CPA.
Schools (NCES district)
- District
- Georgetown 01
- NCES district ID
- 4502280
- Math proficiency
- 26% ▼ -11.00%
- Reading proficiency
- 38% ▼ -5.00%
- Median HH income
- $43,045
- Composite
- 27.15/100
- National rank
- #7030
- State rank
- #51 of 80 in SC
Livability — Andrews
- Score
- 63/100
- State rank
- #183
- US rank
- #15970
Category grades
Schools grade is shown separately in the Schools card above.
Census & demographics
- Population (ZIP)
- 9,803
Population outlook (Georgetown County) Hauer SSP2
- Today (2025)
- 63,275 people
- By 2030
- 63,630 · +0.6%
- By 2040
- 63,130 · -0.2%
- By 2050
- 61,904 · -2.2%
- By 2075
- 59,305 · -6.3%
- By 2100
- 53,852 · -14.9%
Race, ethnicity, and origin ACS 2023
- Neighborhood character
- Majority White (55%)
- Race & ethnicity
- White 55% Black 40% Hispanic / Latino 3% Two or more races 2%
- Common ancestry
- Slovak 2% Lithuanian 1% Italian 1%
- Foreign-born
- 1% · Canada
- Languages at home
- 99% English-only · Spanish 1%
Political lean MEDSL · Georgetown
- 2024 margin
- R (+19.5) · D 39.6% · R 59.1% · Other 1.2%
- 2008→2024 swing
- -14.2pp toward R · 2008: -5.2pp · 2024: -19.5pp
- All cycles
- 2024: R+19.5 2020: R+12.7 2016: R+13.0 2012: R+7.6 2008: R+5.2
Not yet ingested
- Civics
- —
Market trends
- HPI YoY
- ▲ 25.29%
- Current HPI
- 273.496
- Rent YoY
- —
- Metro
- —
- State GDP YoY
- ▲ 4.51%
- F500 in state
- 2
Industry mix (Fortune 500 HQ in SC)
| Industry | F500 HQs | Revenue |
|---|---|---|
| Packaging | 1 | $7B |
|
||
Price history
+141.7% since first listed2 events — show timeline
- 2026-04-10 Listed $145,000 Fizber.com
- 2023-02-27 Sold (Public Records) $60,000 Public Records
Property tax history
+14.4%/yrLatest (2025): $469 · +4.1% YoY. Source: county tax records.
Cash-flow waterfall
monthlySold comps — $/sqft
last 12 mo · ≤1 miLoading sold comps…