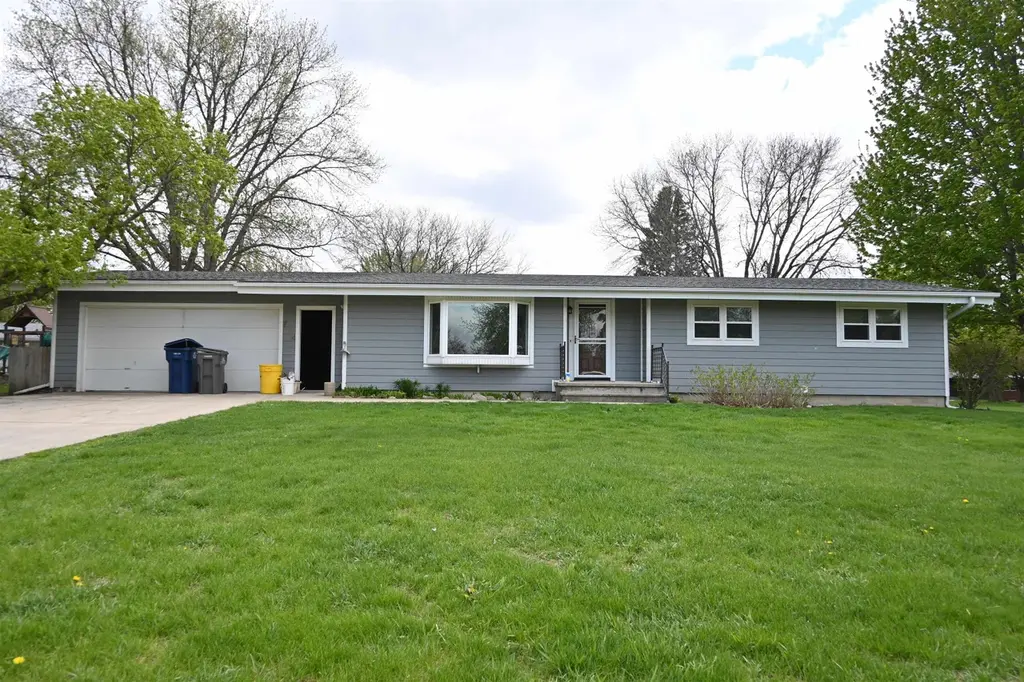
704 E 18th St · Spencer, IA
Flood risk 1/10 · Minimal
- FEMA flood zone
- X (unshaded)
- Chance of flooding over 30 yrs
- 0.0%
- Est. flood insurance / yr
- $473 – $860
Fire risk 3/10 · Minor
- Est. fire insurance / yr
- $902 – $1,676
Heat risk 2/10 · Minimal
- Hot days now (above 100°F)
- 7 days/yr
- Hot days in 30 yrs
- 16 days/yr
Wind risk 2/10 · Minimal
- Chance of severe wind over 30 yrs
- —
Air-quality risk 2/10 · Minimal
- Unhealthy air days now
- 1 days/yr
- Unhealthy air days in 30 yrs
- 1 days/yr
Risk factors via First Street. Map © Google.
Why this score? — see what drove the D grade
The composite is a weighted blend of 9 inputs, each scored 0–100. Each bar is that input's sub-score; the figure is the points it added to the 100-point composite (weight × sub-score).
- Cash flow +13.3/30.0
- Schools +6.1/10.0
- ARV discount +5.9/15.0
- DSCR +4.0/10.0
- Livability +3.9/5.0
- 1% rule +3.7/10.0
- Rent growth +2.5/5.0
- Condition / age +2.5/5.0
- Appreciation +0.0/10.0
$170,000
🖨 Deal sheet (PDF) 📄 Offer letter ✓ Due diligence
Listing remarks
Smart Start - Designed for easy main-level living with room to grow over time, this three-bedroom ranch home puts everything you need right within reach. The kitchen offers warm cabinetry, a peninsula with counter seating and track lighting, while the living room feels bright and inviting, centered around a bay window that brings in natural light and adds a touch of character. With a little TLC, this home offers wonderful potential. The full bath is thoughtfully adapted with a walk-in bathtub, while the primary bedroom includes its own walk through half bath. One of the bedrooms features laundry hookups, giving you the flexibility to keep it as a bedroom or create a convenient laundry space
Key facts
- Nicely sized yard
- Walk-in bathtub
- Main-level living
Tags
Property features AI
Exterior
- Parking: Attached concrete garage with 2 spaces
- Utilities: Public water; Public sewer
- Home design: Single-family residence; One story
- Construction: Block construction; Asphalt roof
- Exterior features: Deck; Publicly maintained road
Interior
- Kitchen: Dishwasher; Disposal; Refrigerator
- Bathrooms: 1 full bathroom; 1 half bathroom
- Heating & cooling: Electric forced-air heating; Central air conditioning
- Interior features: Dishwasher; Disposal; Refrigerator; Unfinished full basement
- Laundry & utility: Main-level laundry
Neighborhood map
What this means for you Summary
Snapshot
- This is a 3-bed/1.5-bath single-family listed at $170k.
Deal economics
- At list price, monthly cash flow is $1 ($9/yr) — positive.
- The deal already cash-flows at list — no discount required.
- To meet the 1% rule (rent ≥ 1% of price), the offer needs to be $148k (13.2% below list).
- Recommended offer: $148k (13.2% below list) — sets the bar for 1% rule.
- Cap rate 6.3% vs local median 4.7% in Spencer — top-decile yield for the area; either an underpriced asset or a hidden risk that comps aren't pricing in. Stress-test before assuming the spread holds.
Location & tenants
- Location reads 77/100 on livability (#168 in IA, #3,020 nationally) — a middle-class / working-renter tenant base. Strengths: schools A+, crime A+, cost of living A+; Watch: employment D, amenities F, commute F.
- Spencer Community School District (town): math 73% / reading 72% proficiency, ranked #114 of 289 in IA (top 39%) — strong family-tenant draw, lease renewals of 3-5y typical.
- Market conditions: 109 active listings in the ZIP; 11 units permitted in Clay County in 2024 (0 in 5+ unit buildings).
Forward outlook
- Local home prices are declining (-3.0%/yr); year-one equity from $1k of loan paydown is wiped out by about $5k of value loss. Plan a longer hold.
- Clay County population projected to shrink 6% by 2050 — rents likely to lag national; underwrite the cash flow, not the appreciation.
Negotiation context
- Only 6 days on market — expect competitive offers; lowballing is unlikely to land.
Questions for the listing agent
- Built in 1976 — when were the roof, HVAC, electrical panel, plumbing, and water heater last replaced?
- Is there a deadline driving the sale (1031 exchange, divorce, estate, relocation)? That informs how much negotiation room exists.
- Schools are A-rated — typically a magnet for longer-tenancy family renters. What's the average tenant stay here, and is there a school-zone premium baked into asking?
- The area grade is low — what's the realistic commute time and amenity access for the typical tenant pool here? Any planned neighborhood developments (good or bad) we should know about?
- What's the average days-on-market for RENTAL listings here right now (not sales)? A rising rental-DOM trend means longer vacancies and softer asking-rent achievability than the comps imply.
- What's the recent tenant-quality profile in this submarket — average credit score on applications, eviction rate, late-payment / NSF rate, and stable-employment percentage? A property-management company in the area should have these aggregated.
- How much new for-sale + rental construction is in the pipeline within 1–3 miles? Heavy new supply typically softens prices + rents 12–24 months out; constrained supply supports both.
Investment metrics
- 1% rule
- 0.87% ✗
- Cap rate
- 6.30%
- Cash-on-cash
- 0.02%
- DSCR
- 1.00
- GRM
- 9.6
CMA / ARV
- ARV (median comp)
- $164,258
- List price
- $170,000
- Delta
- 3.50%
- Verdict
- FAIR
- Comps
- 20 within 1.0 mi
Show comp detail 12 sales within ~0.75 mi
| Address | Dist | Beds/Ba | Sqft | Sold | Price | $/sf | Match |
|---|---|---|---|---|---|---|---|
| 704 E 18th St | 0.00mi | 3/1.5 | 1,236 (0%) | 0mo | $175,100 | $142 | 100 |
| 611 E 17th St | 0.06mi | 3/2.0 | 1,288 (+4%) | 6mo | $142,500 | $111 | 83 |
| 313 E 14th St | 0.36mi | 3/1.0 | 1,200 (-3%) | 6mo | $135,000 | $113 | 72 |
| 1607 Grand Ave | 0.54mi | 3/1.0 | 1,272 (+3%) | 3mo | $159,000 | $125 | 66 |
| 702 E 8th St | 0.69mi | 3/2.0 | 1,250 (+1%) | 2mo | $162,000 | $130 | 62 |
| 321 E 14th St | 0.34mi | 2/1.0 (-1) | 1,118 (-10%) | 1mo | $134,890 | $121 | 60 |
| 1222 4th Ave E | 0.40mi | 2/2.0 (-1) | 1,144 (-7%) | 4mo | $170,000 | $149 | 58 |
| 507 E 9th St | 0.61mi | 3/1.5 | 1,331 (+8%) | 2mo | $155,000 | $116 | 57 |
| 1622 1st Ave E | 0.42mi | 2/1.0 (-1) | 1,104 (-11%) | 0mo | $174,900 | $158 | 55 |
| 723 E 11th St | 0.44mi | 3/1.0 | 1,380 (+12%) | 4mo | $14,000 | $10 | 54 |
| 106 E 10th St | 0.69mi | 3/1.0 | 1,296 (+5%) | 6mo | $112,500 | $87 | 53 |
| 314 E 12th St | 0.48mi | 2/1.0 (-1) | 1,357 (+10%) | 9mo | $40,000 | $29 | 47 |
Match score weights: distance 35% · size 25% · config 20% · recency 20%. Top-matched comps best support the ARV.
Projected returns pro-forma
-3.0% appreciation · 3.0% rent growth · sell at horizon
- IRR
- -16.3%
- Equity multiple
- 0.42×
- Total profit
- $-27,484
- Equity at exit
- $25,348
- IRR
- -8.0%
- Equity multiple
- 0.50×
- Total profit
- $-23,807
- Equity at exit
- $14,698
Cash invested: $47,600 (down + closing). Projections, not guarantees.
Landlord ↔ Tenant lean methodology
- Overall (STATE)
- 83 Strongly Landlord-Friendly
- State Iowa
- 83 Strongly Landlord-Friendly · R+6
- County
- — inherits STATE
- City
- — inherits STATE
ZIP-level market 51301
- Home prices YoY
- -35.0%
- Active inventory
- 109
- Price-to-rent
- 9.6×
Monthly cashflow live
- Estimated rent
- $1,475 medium interval (Pro) →
- Mortgage (P&I)
- −$891
- Tax from tax record
- −$202 /mo · $2,428/yr
- Insurance
- −$71
- HOA
- −$0
- Vacancy / Maint / Mgmt
- −$310
- Net cashflow
- $1
Break-even live
Sensitivity live
| Price | -10% $97 | -5% $49 | +0% $1 | +5% $-47 | +10% $-95 |
|---|---|---|---|---|---|
| Rent | -10% $-116 | -5% $-58 | +0% $1 | +5% $59 | +10% $117 |
| Rate | -1.0pp $86 | -0.5pp $44 | base $1 | +0.5pp $-43 | +1.0pp $-88 |
UW: 25.0% down · 7.5% · 30yr · 1.5% tax · 5.0% vac · 8.0% maint · 8.0% mgmt
Financing live
Cash to close
- Down payment
- $42,500
- Closing costs
- $5,100
- Reserves months
- —
- Total cash needed
- —
Loan-product check · same deal, 3 products live
Conventional
25% down · 7.5% · 30yr
- Down + closing
- —
- Monthly P&I
- —
- Monthly cashflow
- —
- DSCR
- —
- Eligible?
- —
Personal DTI + credit; lowest rate.
DSCR
20% down · 8.5% · 30yr
- Down + closing
- —
- Monthly P&I
- —
- Monthly cashflow
- —
- DSCR
- —
- Eligible?
- —
No personal income docs; deal must DSCR.
Hard money
10% down · 12.0% · 12mo
- Down + closing
- —
- Monthly P&I
- —
- Monthly cashflow
- —
- DSCR
- —
- Eligible?
- —
Short-term bridge; refi at stabilization.
Listing history 3 events
-
2026-05-07status Pending 1064-char remark
-
2026-05-07historical Active Under Contract 1064-char remark
-
2026-05-01$170,000 Active 1064-char remark
ⓘ Source: listings_history table (triggers on properties + properties_extension) + one-shot
backfill from property_details.listing_events for pre-trigger history.
Tax reassessment forecast IA · Partial reset (capped growth)
- Current annual tax
- $2,428 · $202/mo
- Projected year-2 tax
- $2,548 · $212/mo
- Expected delta
- +$120/yr (+$10/mo · 5.0%)
ⓘ Screening estimate from a state-policy table — verify with the county assessor before closing.
Climate risk First Street
- Flood 1/10 Low FEMA zone X (unshaded) · 0% chance over 30 yrs
- Wildfire 3/10 Moderate
- Heat 2/10 Low 7 d/yr ≥100°F today · 16 d/yr by 30 yrs out
- Wind 2/10 Low
- Air quality 2/10 Low 1 unhealthy d/yr today · 1 by 30 yrs out
Nearby sold comps map
Loading sold comps map…
Walkable amenities ~0.75 mi
Loading nearby amenities…
Taxation est. · year 1
- Rental income
- $17,702
- − Mortgage interest
- −$9,523
- − Property taxes
- −$2,428
- − Insurance
- −$850
- − Repairs & maintenance
- −$1,416
- − Management
- −$1,416
- − Depreciation
- −$4,945
- Taxable loss
- −$2,876
- Est. tax savings @ 24.0%
- +$690
- After-tax cash flow
- $699/yr
For passive investors: Depreciation is non-cash, so a rental often shows a tax loss while cash-flowing — sheltering income. Rental losses are passive: they offset passive income freely, and up to $25,000/yr can offset ordinary (W-2) income if you actively participate and your MAGI is under $100k (phasing out to $0 by $150k); unused losses carry forward. On sale, claimed depreciation is recaptured at up to 25%, and gains may owe capital-gains tax (a 1031 exchange can defer both). Figures are a year-1 estimate at your 24.0% rate — not tax advice; consult a CPA.
Schools (NCES district)
- District
- Spencer Community School District
- NCES district ID
- 1926910
- Math proficiency
- 73% ▼ -7.00%
- Reading proficiency
- 72% ▼ -6.00%
- Median HH income
- $45,474
- Composite
- 61.02/100
- National rank
- #797
- State rank
- #114 of 289 in IA
Livability — Spencer
- Score
- 77/100
- State rank
- #168
- US rank
- #3020
Category grades
Schools grade is shown separately in the Schools card above.
Census & demographics
- Census place
- Spencer, IA
- City population
- 12,402
- Population (ZIP)
- 12,402
Population outlook (Clay County) Hauer SSP2
- Today (2025)
- 16,277 people
- By 2030
- 16,073 · -1.3%
- By 2040
- 15,638 · -3.9%
- By 2050
- 15,315 · -5.9%
- By 2075
- 15,026 · -7.7%
- By 2100
- 14,638 · -10.1%
Race, ethnicity, and origin ACS 2023
- Neighborhood character
- Predominantly White (91%)
- Race & ethnicity
- White 91% Hispanic / Latino 5% Two or more races 4%
- Hispanic origin (detail)
- Mexican 4%
- Common ancestry
- Portuguese 14% Iranian 4% Lithuanian 2%
- Foreign-born
- 1% · Canada, South Korea
- Languages at home
- 98% English-only · Spanish 1%
Political lean MEDSL · Clay
- 2024 margin
- Solid R (+43.2) · D 27.8% · R 71.0% · Other 1.2%
- 2008→2024 swing
- -38.1pp toward R · 2008: -5.1pp · 2024: -43.2pp
- All cycles
- 2024: R+43.2 2020: R+38.7 2016: R+42.4 2012: R+18.7 2008: R+5.1
Not yet ingested
- Civics
- —
Market trends
- HPI YoY
- ▼ -103.43%
- Current HPI
- 192.1741
- Rent YoY
- —
- Metro
- —
- State GDP YoY
- ▲ 2.48%
- F500 in state
- 4
Industry mix (Fortune 500 HQ in IA)
| Industry | F500 HQs | Revenue |
|---|---|---|
| Financial Services | 1 | $16B |
|
||
| Retail / Convenience | 1 | $15B |
|
||
Price history
+3.0% since first listed4 events — show timeline
- 2026-06-17 Sold (MLS) $175,100 Iowa Great Lakes BOR
- 2026-05-07 Pending — Iowa Great Lakes BOR
- 2026-05-07 Contingent — Iowa Great Lakes BOR
- 2026-05-01 Listed $170,000 Iowa Great Lakes BOR
Property tax history
+3.2%/yrLatest (2025): $2,428 · +3.7% YoY. Source: county tax records.
Cash-flow waterfall
monthlySold comps — $/sqft
last 12 mo · ≤1 miLoading sold comps…