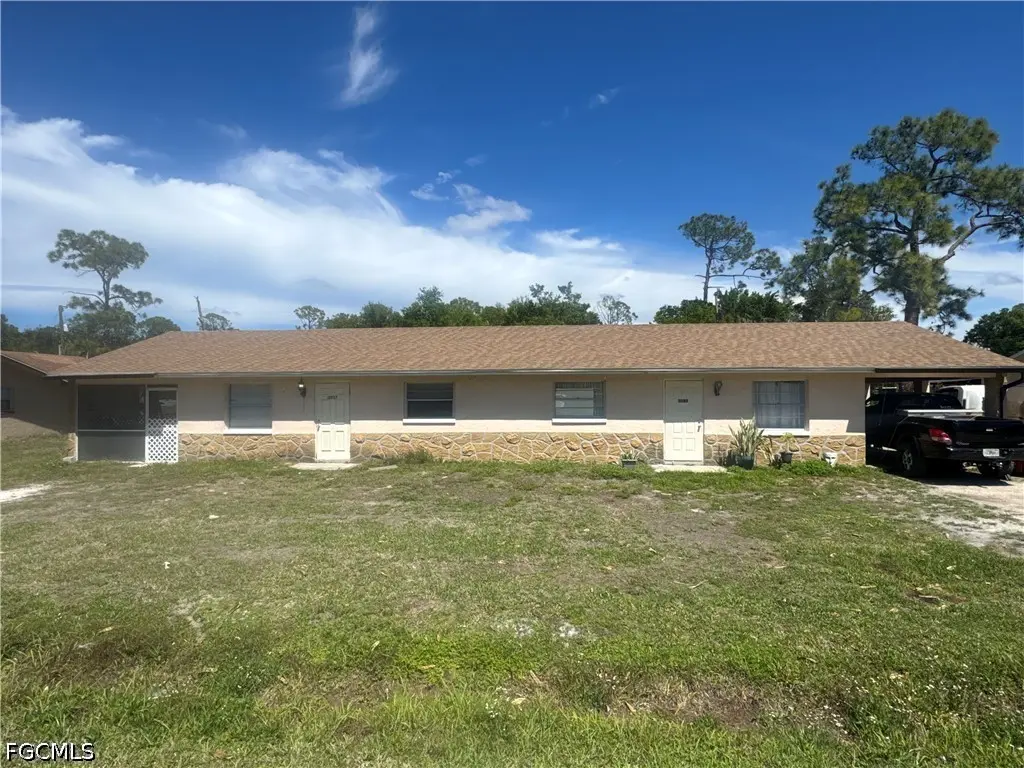
 Duplex
2035/2037 Eloise Cir · North Fort Myers, FL
Flood risk 1/10 · Minimal
- FEMA flood zone
- X (unshaded)
- Chance of flooding over 30 yrs
- 0.0%
- Est. flood insurance / yr
- $507 – $1,088
Fire risk 4/10 · Minor
- Est. fire insurance / yr
- $947 – $1,759
Heat risk 10/10 · Severe
- Hot days now (above 107°F)
- 7 days/yr
- Hot days in 30 yrs
- 29 days/yr
Wind risk 10/10 · Severe
- Chance of severe wind over 30 yrs
- 99.0%
Air-quality risk 2/10 · Minimal
- Unhealthy air days now
- 1 days/yr
- Unhealthy air days in 30 yrs
- 1 days/yr
Risk factors via First Street. Map © Google.
Why this score? — see what drove the B- grade
The composite is a weighted blend of 9 inputs, each scored 0–100. Each bar is that input's sub-score; the figure is the points it added to the 100-point composite (weight × sub-score).
- Cash flow +26.5/30.0
- DSCR +9.0/10.0
- ARV discount +7.5/15.0
- 1% rule +7.1/10.0
- Schools +4.1/10.0
- Condition / age +4.0/5.0
- Livability +3.7/5.0
- Rent growth +3.2/5.0
- Appreciation +0.0/10.0
$275,000
🖨 Deal sheet 📄 Offer letter ✓ Due diligence
Multi-family units
County records classify this as Multi-Family (2-4 Unit). Listing-text estimate: 2 units. confirmed
Listing remarks
Don't miss this turnkey, cash-flowing duplex perfectly positioned in prime North Fort Myers! This fully rented, income-producing property offers immediate ROI with two mirror-image 2-bedroom, 1-bathroom units featuring open kitchen floor plans, central A/C, enclosed screen room, and convenient concrete carport. Situated on a deep lot, the property boasts a massive backyard with plenty of room to stretch out, while big-ticket items like the 2022 shingle roof and new AC offer peace of mind. The location is an absolute magnet for long-term tenants, perfectly positioned within easy walking distance to North Fort Myers High School and just a short drive over the bridge to downtown Fort Myers din
Key facts
- Turnkey duplex
- Enclosed screen room
- Central a/c
Tags
Property features AI
Finance
- Other: Zoning: TFC-2
- Financial info: Gross scheduled income: $32,000; Operating expenses: $2,000
- HOA & community: Non-gated community; No regular association fee
Exterior
- Utilities: Cable available; Sewer assessment paid; Water assessment paid; Irrigation included in assessment
- Home design: Single-story property; Block, concrete and stucco construction; Shingle roof
- Construction: Built with block, concrete and stucco; Shingle roof
- Exterior features: Room for pool; Rectangular lot; Lot dimensions approximately 80 x 100 x 80 x 100
Interior
- Flooring: Tile
- Bathrooms: 2 full bathrooms
- Heating & cooling: Central electric heating; Central electric cooling
- Interior features: Tile flooring; Resale condition
Neighborhood map
What this means for you Summary
Snapshot
- This is a 2 × 2-bed/1.0-bath units multifamily listed at $275k. Condition is rated good.
Deal economics
- At list price, monthly cash flow is $727 ($9k/yr) — positive. Per door: $364/mo.
- The deal already cash-flows at list — no discount required.
- Meets the 1% rule at list price ($3k rent vs $275k).
- Recommended offer: $258k (6.0% below list) — sets the bar for market timing.
- Cap rate 9.5% vs local median 3.6% in North Fort Myers — top-decile yield for the area; either an underpriced asset or a hidden risk that comps aren't pricing in. Stress-test before assuming the spread holds.
Location & tenants
- Location reads 74/100 on livability (#269 in FL, #4,409 nationally) — a middle-class / working-renter tenant base. Strengths: cost of living A+, housing A+, health & safety A+; Watch: employment C-, amenities F, commute F.
- Lee (suburban): math 47% / reading 50% proficiency, ranked #42 of 73 in FL (top 58%) — families likely to look elsewhere, expect single-tenant / working-renter base with shorter leases.
- Market conditions: Rents rising (+2.6%/yr); 841 active listings in the ZIP; 40 comparable units currently listed for rent nearby; rentals at typical pace (median 19d on market — plan ~3-4 weeks tenant-placement turnaround); 15,411 units permitted in Lee County in 2024 (4,686 in 5+ unit buildings).
- At $3,326/mo this rent would consume 73% of the median local household income ($55k/yr) (locally 775% of renters already pay >50% of income on rent) — very limited rent-growth headroom before tenants either downsize or default.
Forward outlook
- Local home prices are declining (-3.0%/yr); year-one equity from $2k of loan paydown is wiped out by about $8k of value loss. Plan a longer hold.
- Lee County population projected at +44% by 2050 — long-run rental-demand tailwind backs the buy-and-hold thesis.
Negotiation context
- It's been on market 66 days — a 6% lower offer ($258k) is reasonable based on typical stale-listing flexibility.
Risks & watch-outs
- Climate carrying-cost: severe wind risk, 99% chance of damaging wind over 30y; extreme-heat days projected 7→29/yr by 2055 (HVAC capex compounding) — expect insurance premiums to compound above CPI over the hold.
Questions for the listing agent
- It's been on market 66 days. Have you received any prior offers? Is the seller open to a 6% concession, seller financing, or rate buy-down credit?
- Can we see the unit-by-unit rent roll, current vacancy, and any below-market leases? What's the average tenancy length?
- What capital expenditures (roof, boiler, parking lot, exteriors) have been made in the last 5 years, and what's planned in the next 2?
- Built in 1976 — when were the roof, HVAC, electrical panel, plumbing, and water heater last replaced?
- Why hasn't it sold? Are there any deal-killer items the seller is aware of (foundation, flood, title, zoning, code violations)?
- Is there a deadline driving the sale (1031 exchange, divorce, estate, relocation)? That informs how much negotiation room exists.
- What's the average days-on-market for RENTAL listings here right now (not sales)? A rising rental-DOM trend means longer vacancies and softer asking-rent achievability than the comps imply.
- What's the recent tenant-quality profile in this submarket — average credit score on applications, eviction rate, late-payment / NSF rate, and stable-employment percentage? A property-management company in the area should have these aggregated.
- How much new apartment / multifamily construction is in the pipeline within 1–3 miles? Heavy new supply (>2% of stock underway) typically softens rents 12–24 months out; light construction supports rent growth.
Investment metrics
- 1% rule
- 1.21% ✓
- Cap rate
- 9.47%
- Cash-on-cash
- 11.33%
- DSCR
- 1.50
- GRM
- 6.9
CMA / ARV
No comps found within radius.
Projected returns pro-forma
-3.0% appreciation · 2.63% rent growth · sell at horizon
- IRR
- 0.2%
- Equity multiple
- 1.01×
- Total profit
- $563
- Equity at exit
- $41,003
- IRR
- 9.5%
- Equity multiple
- 1.72×
- Total profit
- $55,298
- Equity at exit
- $23,777
Cash invested: $77,000 (down + closing). Projections, not guarantees.
Landlord ↔ Tenant lean methodology
- Overall (STATE)
- 87 Strongly Landlord-Friendly
- State Florida
- 87 Strongly Landlord-Friendly · R+3
- County
- — inherits STATE
- City
- — inherits STATE
ZIP-level market 33917
- Home prices YoY
- -30.2%
- Rents YoY
- 2.6%
- Active inventory
- 841
- Price-to-rent
- 13.8×
Monthly cashflow live
- Estimated rent
- $3,326 high interval (Pro) →
- Mortgage (P&I)
- −$1,442
- Tax est. 1.5%
- −$344 /mo · $4,125/yr
- Insurance
- −$115
- HOA
- −$0
- Vacancy / Maint / Mgmt
- −$698
- Net cashflow
- $727
Break-even live
2-unit breakdown (identical units grouped — click to expand)
| Units | Beds | Baths | Est. rent |
|---|---|---|---|
| 2× units | 2 | 1 | $3,326 |
| #1 | 2 | 1 | $1,663 |
| #2 | 2 | 1 | $1,663 |
| Total (2 units) | $3,326 | ||
UW: 25.0% down · 7.5% · 30yr · 1.5% tax · 5.0% vac · 8.0% maint · 8.0% mgmt
Financing live
Cash to close
- Down payment
- $68,750
- Closing costs
- $8,250
- Reserves months
- —
- Total cash needed
- —
Loan-product check · same deal, 3 products live
Conventional
25% down · 7.5% · 30yr
- Down + closing
- —
- Monthly P&I
- —
- Monthly cashflow
- —
- DSCR
- —
- Eligible?
- —
Personal DTI + credit; lowest rate.
DSCR
20% down · 8.5% · 30yr
- Down + closing
- —
- Monthly P&I
- —
- Monthly cashflow
- —
- DSCR
- —
- Eligible?
- —
No personal income docs; deal must DSCR.
Hard money
10% down · 12.0% · 12mo
- Down + closing
- —
- Monthly P&I
- —
- Monthly cashflow
- —
- DSCR
- —
- Eligible?
- —
Short-term bridge; refi at stabilization.
Rent comps 40 comps
| Address | Beds | Baths | Sqft | Rent | $/sqft | DOM | Units | Dist |
|---|---|---|---|---|---|---|---|---|
| 4232 Pine Drop Ln North Fort Myers, FL | 3.0 | 2.0 | 1914 | $1,495 | $0.78 | 3d | 1 | 0.18mi |
| 4234 Pine Drop Ln North Fort Myers, FL | 3.0 | 2.0 | 1914 | $1,495 | $0.78 | 3d | 1 | 0.18mi |
| 2861 N 2nd St North Fort Myers, FL | 3.0 | 2.0 | 1951 | $2,500 | $1.28 | 21d | 1 | 0.23mi |
| 2861 N 2nd St North Fort Myers, FL | 3.0 | 2.0 | 1951 | $2,500 | $1.28 | 23d | 1 | 0.23mi |
| 4120 Pine Drop Ln North Fort Myers, FL | 3.0 | 2.0 | 957 | $1,895 | $1.98 | 23d | 1 | 0.25mi |
| 17124 Pompeii Way North Fort Myers, FL | 5.0 | 3.0 | 2587 | $2,600 | $1.01 | 11d | 1 | 0.37mi |
| 17158 Pompeii Way North Fort Myers, FL | 4.0 | 3.0 | 2205 | $2,600 | $1.18 | 13d | 1 | 0.39mi |
| 17167 Pompeii Way North Fort Myers, FL | 5.0 | 3.0 | 2587 | $2,700 | $1.04 | 11d | 1 | 0.41mi |
| 4106 San Felice Ln North Fort Myers, FL | 4.0 | 2.5 | 1874 | $2,400 | $1.28 | 23d | 1 | 0.45mi |
| 17257 Cantu Ct North Fort Myers, FL | 5.0 | 2.5 | 2570 | $2,450 | $0.95 | 23d | 1 | 0.46mi |
| 17499 Monte Isola Way Unit 17499 North Fort Myers, FL | 3.0 | 2.5 | 1405 | $1,800 | $1.28 | 13d | 1 | 0.47mi |
| 17489 Monte Isola Way North Fort Myers, FL | 3.0 | 2.5 | 1347 | $1,800 | $1.34 | 14d | 1 | 0.49mi |
| 17244 Cantu Ct North Fort Myers, FL | 4.0 | 2.0 | 1824 | $2,200 | $1.21 | 14d | 1 | 0.50mi |
| 17225 Cantu Ct North Fort Myers, FL | 4.0 | 2.0 | 1824 | $2,200 | $1.21 | 23d | 1 | 0.53mi |
| 17459 Monte Isola Way North Fort Myers, FL | 3.0 | 2.5 | 300 | $2,000 | $6.67 | 18d | 1 | 0.56mi |
| 17459 Monte Isola Way North Fort Myers, FL | 3.0 | 2.5 | — | $1,750 | — | 23d | 1 | 0.56mi |
| 4106 Lattuca Ln North Fort Myers, FL | 4.0 | 2.5 | 1874 | $2,200 | $1.17 | 23d | 1 | 0.57mi |
| 17449 Monte Isola Way Unit 17449 North Fort Myers, FL | 3.0 | 2.5 | — | $2,000 | — | 23d | 1 | 0.58mi |
| 4208 Caterina Ct North Fort Myers, FL | 3.0 | 2.5 | 1347 | $1,800 | $1.34 | 14d | 1 | 0.60mi |
| 574 Leopard Ln #574 North Fort Myers, FL | 4.0 | 2.0 | 1459 | $1,599 | $1.10 | 13d | 1 | 0.61mi |
| 4228 Caterina Ct North Fort Myers, FL | 3.0 | 2.5 | — | $1,850 | — | 3d | 1 | 0.62mi |
| 4228 Caterina Ct North Fort Myers, FL | 3.0 | 2.5 | 1700 | $1,850 | $1.09 | 11d | 1 | 0.62mi |
| 4106 Granita Ct North Fort Myers, FL | 4.0 | 2.5 | 1812 | $2,300 | $1.27 | 23d | 1 | 0.62mi |
| 17596 Monte Isola Way North Fort Myers, FL | 4.0 | 2.5 | 2500 | $2,550 | $1.02 | 23d | 1 | 0.63mi |
| 17669 Paradiso Way North Fort Myers, FL | 3.0 | 2.0 | 1551 | $1,999 | $1.29 | 3d | 1 | 0.63mi |
| 17669 Paradiso Way North Fort Myers, FL | 3.0 | 2.0 | 1551 | $1,999 | $1.29 | 23d | 1 | 0.63mi |
| 4241 Caterina Ct North Fort Myers, FL | 3.0 | 2.5 | 1529 | $1,900 | $1.24 | 15d | 1 | 0.66mi |
| 17404 Monte Isola Way North Fort Myers, FL | 5.0 | 2.5 | 2279 | $2,099 | $0.92 | 13d | 1 | 0.68mi |
| 17400 Monte Isola Way North Fort Myers, FL | 3.0 | 2.0 | 1448 | $1,875 | $1.29 | 23d | 1 | 0.69mi |
| 4264 Cirella Ct North Fort Myers, FL | 3.0 | 2.5 | 1442 | $2,000 | $1.39 | 11d | 1 | 0.70mi |
| 4276 Cirella Ct North Fort Myers, FL | 3.0 | 2.5 | 1378 | $1,800 | $1.31 | 23d | 1 | 0.70mi |
| 266 Mongoose Ln #266 North Fort Myers, FL | 3.0 | 2.0 | 1372 | $1,499 | $1.09 | 3d | 1 | 0.71mi |
| 8086 Heck Dr Unit 14 North Fort Myers, FL | 3.0 | 2.0 | — | $1,095 | — | 21d | 1 | 0.72mi |
| 535 Zebra Dr #535 North Fort Myers, FL | 3.0 | 2.0 | 1352 | $1,499 | $1.11 | 14d | 1 | 0.76mi |
| 4275 Cirella Ct North Fort Myers, FL | 3.0 | 2.5 | 1378 | $1,800 | $1.31 | 23d | 1 | 0.78mi |
| 17392 Monte Isola Way North Fort Myers, FL | 4.0 | 2.5 | 1871 | $2,299 | $1.23 | 23d | 1 | 0.80mi |
| 3358 Sabal Springs Blvd North Fort Myers, FL | 3.0 | 2.0 | 1621 | $2,200 | $1.36 | 23d | 1 | 1.02mi |
| 4216 Villa Rapallo Way North Fort Myers, FL | 4.0 | 2.0 | 1817 | $2,000 | $1.10 | 1d | 1 | 1.06mi |
| 4232 Villa Rapallo Way North Fort Myers, FL | 4.0 | 2.0 | 1812 | $1,900 | $1.05 | 23d | 1 | 1.07mi |
| 4263 Villa Rapallo Way North Fort Myers, FL | 4.0 | 2.0 | 1936 | $2,200 | $1.14 | 15d | 1 | 1.11mi |
Listing history 2 events
-
2026-04-20price $275,000
-
2026-03-24$285,000 Active
ⓘ Source: listings_history table (triggers on properties + properties_extension) + one-shot
backfill from property_details.listing_events for pre-trigger history.
Climate risk First Street
- Flood 1/10 Low FEMA zone X (unshaded) · 0% chance over 30 yrs
- Wildfire 4/10 Moderate
- Heat 10/10 Extreme 7 d/yr ≥107°F today · 29 d/yr by 30 yrs out
- Wind 10/10 Extreme 99% chance of damaging wind over 30 yrs
- Air quality 2/10 Low 1 unhealthy d/yr today · 1 by 30 yrs out
Nearby sold comps map
Loading sold comps map…
Walkable amenities ~0.75 mi
Loading nearby amenities…
Taxation est. · year 1
- Rental income
- $39,912
- − Mortgage interest
- −$15,404
- − Property taxes
- −$4,125
- − Insurance
- −$1,375
- − Repairs & maintenance
- −$3,193
- − Management
- −$3,193
- − Depreciation
- −$8,000
- Taxable income
- $4,622
- Est. tax owed @ 24.0%
- −$1,109
- After-tax cash flow
- $7,616/yr
For passive investors: Depreciation is non-cash, so a rental often shows a tax loss while cash-flowing — sheltering income. Rental losses are passive: they offset passive income freely, and up to $25,000/yr can offset ordinary (W-2) income if you actively participate and your MAGI is under $100k (phasing out to $0 by $150k); unused losses carry forward. On sale, claimed depreciation is recaptured at up to 25%, and gains may owe capital-gains tax (a 1031 exchange can defer both). Figures are a year-1 estimate at your 24.0% rate — not tax advice; consult a CPA.
Condition & rehab AI · 2 photos
This fully rented, income-producing property is in good condition with minimal maintenance required. It offers immediate ROI and is well-positioned for long-term tenants.
Value-add opportunities
- Both Paint exterior — Enhances curb appeal and property value.
- Both Landscaping maintenance — Improves curb appeal and property value.
- Rental Replace HVAC filters — Keeps systems running efficiently and reduces maintenance costs.
Renovation cost estimate screening
Value-add ROI direction
- Both Paint exterior — Enhances curb appeal and property value. ↑
- Both Landscaping maintenance — Improves curb appeal and property value. ↑
- Rental Replace HVAC filters — Keeps systems running efficiently and reduces maintenance costs. ↑
ⓘ Cost ranges are severity-bucket heuristics (US national rule-of-thumb). Get contractor quotes + a written scope before underwriting a rehab budget.
Schools (NCES district)
- District
- Lee
- NCES district ID
- 1201080
- Math proficiency
- 47% ▼ -11.00%
- Reading proficiency
- 50% ▼ -4.00%
- Median HH income
- $49,518
- Composite
- 41.49/100
- National rank
- #3458
- State rank
- #42 of 73 in FL
Livability — North Fort Myers
- Score
- 74/100
- State rank
- #269
- US rank
- #4409
Category grades
Schools grade is shown separately in the Schools card above.
Census & demographics
- Census place
- North Fort Myers, FL
- County
- Lee County · 788,662 people
- City population
- 57,035
- Metro
- Cape Coral-Fort Myers, FL
- Population (ZIP)
- 33,380
- Household income
- $55,000
- Rent vs Own
- Severe rent burden
- 775.0
Population outlook (Lee County) Hauer SSP2
- Today (2025)
- 871,946 people
- By 2030
- 955,468 · +9.6%
- By 2040
- 1,113,587 · +27.7%
- By 2050
- 1,256,891 · +44.1%
- By 2075
- 1,560,270 · +78.9%
- By 2100
- 1,726,848 · +98.0%
Race, ethnicity, and origin ACS 2023
- Neighborhood character
- Predominantly White (85%)
- Race & ethnicity
- White 85% Hispanic / Latino 10% Two or more races 7% Asian 1% Black 1%
- Hispanic origin (detail)
- Mexican 2% Puerto Rican 1% Cuban 3%
- Common ancestry
- Lithuanian 3% Romanian 3% Slovak 2%
- Foreign-born
- 10% · Canada
- Languages at home
- 88% English-only · Spanish 9% Other Indo-European 1% Russian/Polish/Slavic 1%
Political lean MEDSL · Lee
- 2024 margin
- Strong R (+28.4) · D 35.5% · R 63.9%
- 2008→2024 swing
- -18.0pp toward R · 2008: -10.4pp · 2024: -28.4pp
- All cycles
- 2024: R+28.4 2020: R+19.2 2016: R+20.4 2012: R+16.6 2008: R+10.4
Not yet ingested
- Civics
- —
Market trends
- HPI YoY
- ▼ -122.28%
- Current HPI
- 282.2895
- Rent YoY
- ▲ 2.63%
- Metro
- Cape Coral-Fort Myers, FL
- State GDP YoY
- ▲ 3.28%
- F500 in state
- 36
Industry mix (Fortune 500 HQ in FL)
| Industry | F500 HQs | Revenue |
|---|---|---|
| Industrial Technology | 2 | $29B |
|
||
| Insurance | 2 | $17B |
|
||
| Retail | 1 | $60B |
|
||
| Technology Distribution | 1 | $58B |
|
||
| Homebuilding | 1 | $35B |
|
||
| Technology Manufacturing | 1 | $35B |
|
||
Price history
-3.5% since first listed2 events — show timeline
- 2026-04-20 Price Changed $275,000 FORTMLS
- 2026-03-24 Listed $285,000 FORTMLS
Cash-flow waterfall
monthlySold comps — $/sqft
last 12 mo · ≤1 miLoading sold comps…