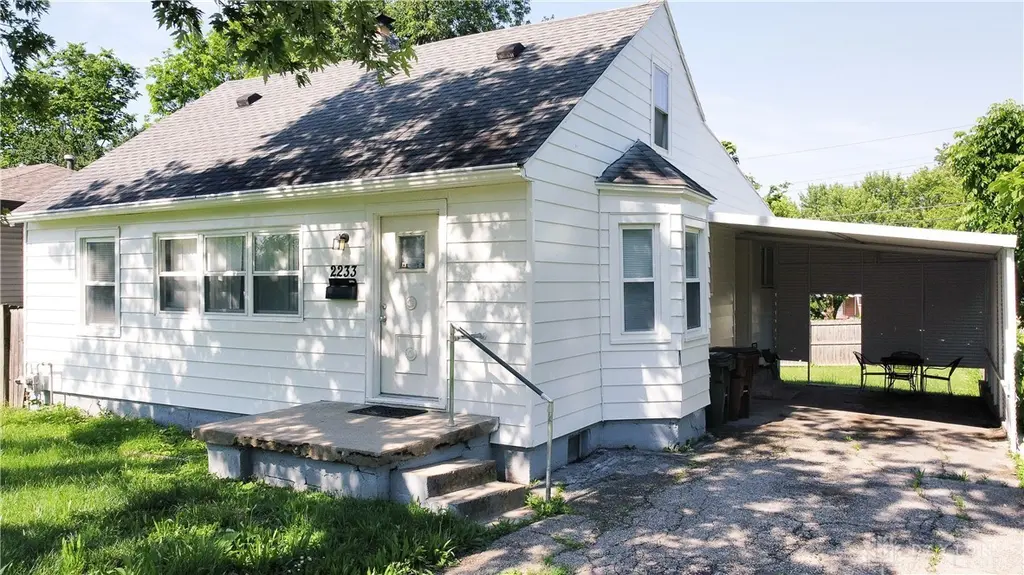
2233 Deering Ave · Fort McKinley, OH
Flood risk 1/10 · Minimal
- FEMA flood zone
- X (unshaded)
- Chance of flooding over 30 yrs
- 0.0%
- Est. flood insurance / yr
- $473 – $860
Fire risk 1/10 · Minimal
- Est. fire insurance / yr
- $713 – $1,323
Heat risk 3/10 · Minor
- Hot days now (above 103°F)
- 7 days/yr
- Hot days in 30 yrs
- 19 days/yr
Wind risk 2/10 · Minimal
- Chance of severe wind over 30 yrs
- 0.0%
Air-quality risk 3/10 · Minor
- Unhealthy air days now
- 2 days/yr
- Unhealthy air days in 30 yrs
- 4 days/yr
Risk factors via First Street. Map © Google.
Why this score? — see what drove the C- grade
The composite is a weighted blend of 9 inputs, each scored 0–100. Each bar is that input's sub-score; the figure is the points it added to the 100-point composite (weight × sub-score).
- Cash flow +20.7/30.0
- ARV discount +10.9/15.0
- DSCR +6.6/10.0
- 1% rule +5.2/10.0
- Rent growth +3.3/5.0
- Livability +2.5/5.0
- Condition / age +2.5/5.0
- Schools +1.3/10.0
- Appreciation +0.0/10.0
$114,900
🖨 Deal sheet 📄 Offer letter ✓ Due diligence
Listing remarks MLS
This 3 bedroom ranch features beautiful hardwood floors and 1,381 sf of living space per PRC. Dining room features bay window and opens to the kitchen. All bedrooms and 1 bath are located on the first floor. Home also features a full unfinished basement and carport.
Key facts
- Fenced in back yard
- Spacious basement
- 5,502 sq ft lot
Tags
Property features AI
Finance
- Financial info: Offered for sale
Exterior
- Parking: Carport
- Utilities: Natural gas available; Sewer available
- Home design: Single-story home; Aluminum siding
- Construction: Aluminum siding construction
- Exterior features: Residential zoning
Interior
- Kitchen: Eat-in kitchen; Range
- Bedrooms: Bedroom on main level
- Bathrooms: One full bathroom and one half bathroom (both on main level)
- Heating & cooling: Natural gas heating; Central air conditioning
- Interior features: Full, unfinished basement
Neighborhood map
What this means for you Summary
Snapshot
- This is a 3-bed/1.0-bath single-family listed at $115k.
Deal economics
- At list price, monthly cash flow is $155 ($2k/yr) — positive.
- The deal already cash-flows at list — no discount required.
- Meets the 1% rule at list price ($1k rent vs $115k).
- Recommended offer: $113k (1.5% below list) — sets the bar for market timing.
Location & tenants
- Location reads: area grade C — affects rentability + tenant quality, not the cash-flow math above.
- Dayton City (urban): math 12% / reading 21% proficiency, ranked #641 of 656 in OH (top 98%) — low school quality limits family demand, transient renter base, plan for 1-2y turnover; 74% free/reduced lunch — lower-income household profile, screen leases tightly.
- Market conditions: Rents rising (+3.0%/yr); 156 active listings in the ZIP; 31 comparable units currently listed for rent nearby; rentals at typical pace (median 23d on market — plan ~3-4 weeks tenant-placement turnaround); lower-income renter base — watch delinquency; 907 units permitted in Montgomery County in 2024 (416 in 5+ unit buildings).
- This rent runs 34% of the median local income ($42k/yr) — at the standard rent-burdened threshold; future hikes will face affordability resistance.
Forward outlook
- Local home prices are declining (-3.0%/yr); year-one equity from $794 of loan paydown is wiped out by about $3k of value loss. Plan a longer hold.
- Montgomery County population projected at -10% by 2050 — secular population decline; favor cash flow + early exit over multi-decade hold.
Negotiation context
- It's been on market 17 days — a 2% lower offer ($113k) is reasonable based on typical stale-listing flexibility.
- 2 sale attempts since 13y ago with the ask held roughly flat each time — persistent listings suggest the price (not the market) is what's stuck; bring a comps-based counter.
- Current owner paid $6k; list at $115k implies a 1989% gain — meaningful room to come down on a strong offer.
Risks & watch-outs
- Watch-outs: built in 1952 — expect roof / HVAC / electrical / plumbing capex.
Questions for the listing agent
- Built in 1952 — when were the roof, HVAC, electrical panel, plumbing, and water heater last replaced?
- Is there a deadline driving the sale (1031 exchange, divorce, estate, relocation)? That informs how much negotiation room exists.
- What's the average days-on-market for RENTAL listings here right now (not sales)? A rising rental-DOM trend means longer vacancies and softer asking-rent achievability than the comps imply.
- What's the recent tenant-quality profile in this submarket — average credit score on applications, eviction rate, late-payment / NSF rate, and stable-employment percentage? A property-management company in the area should have these aggregated.
- How much new for-sale + rental construction is in the pipeline within 1–3 miles? Heavy new supply typically softens prices + rents 12–24 months out; constrained supply supports both.
Investment metrics
- 1% rule
- 1.02% ✓
- Cap rate
- 7.91%
- Cash-on-cash
- 5.78%
- DSCR
- 1.26
- GRM
- 8.2
CMA / ARV
- ARV (on-the-fly)
- $124,290
- Comps found
- 12
Show comp detail 12 sales within ~0.75 mi
| Address | Dist | Beds/Ba | Sqft | Sold | Price | $/sf | Match |
|---|---|---|---|---|---|---|---|
| 2247 Esmeralda Ave | 0.06mi | 4/1.0 (+1) | 1,406 (+2%) | 2mo | $68,000 | $48 | 88 |
| 2413 Archwood Dr | 0.48mi | 3/1.0 | 1,377 (-0%) | 0mo | $100,100 | $73 | 77 |
| 2019 Fairport Ave | 0.24mi | 4/1.0 (+1) | 1,445 (+5%) | 10mo | $130,000 | $90 | 68 |
| 1870 Kipling Dr | 0.60mi | 3/1.0 | 1,376 (-0%) | 11mo | $53,570 | $39 | 62 |
| 4643 Saint Johns Ave | 0.57mi | 3/1.0 | 1,363 (-1%) | 11mo | $51,750 | $38 | 62 |
| 2208 Kensington Dr | 0.44mi | 4/2.5 (+1) | 1,399 (+1%) | 9mo | $155,000 | $111 | 59 |
| 3729 El Paso Ave | 0.64mi | 3/1.0 | 1,248 (-10%) | 9mo | $68,500 | $55 | 47 |
| 2512 England Ave | 0.52mi | 3/2.0 | 1,188 (-14%) | 8mo | $142,250 | $120 | 42 |
| 2553 Greenbrier Dr | 0.71mi | 3/1.5 | 1,218 (-12%) | 9mo | $152,000 | $125 | 38 |
| 2521 Arlene Ave | 0.73mi | 3/1.0 | 1,176 (-15%) | 4mo | $100,500 | $85 | 37 |
| 4131 Merryfield Ave | 0.74mi | 2/1.0 (-1) | 1,210 (-12%) | 6mo | $146,700 | $121 | 35 |
| 1730 Wesleyan Rd | 0.74mi | 3/2.0 | 1,176 (-15%) | 10mo | $142,000 | $121 | 29 |
Match score weights: distance 35% · size 25% · config 20% · recency 20%. Top-matched comps best support the ARV.
Projected returns pro-forma
-3.0% appreciation · 3.03% rent growth · sell at horizon
- IRR
- -7.3%
- Equity multiple
- 0.73×
- Total profit
- $-8,711
- Equity at exit
- $17,132
- IRR
- 2.3%
- Equity multiple
- 1.16×
- Total profit
- $5,275
- Equity at exit
- $9,934
Cash invested: $32,172 (down + closing). Projections, not guarantees.
Landlord ↔ Tenant lean methodology
- Overall (STATE)
- 73 Landlord-Friendly
- State Ohio
- 73 Landlord-Friendly · R+6
- County
- — inherits STATE
- City
- — inherits STATE
ZIP-level market 45406
- Rents YoY
- 3.0%
- Active inventory
- 156
- Price-to-rent
- 8.2×
Monthly cashflow live
- Estimated rent
- $1,167 high interval (Pro) →
- Mortgage (P&I)
- −$603
- Tax from tax record
- −$117 /mo · $1,399/yr
- Insurance
- −$48
- HOA
- −$0
- Vacancy / Maint / Mgmt
- −$245
- Net cashflow
- $155
Break-even live
UW: 25.0% down · 7.5% · 30yr · 1.5% tax · 5.0% vac · 8.0% maint · 8.0% mgmt
Financing live
Cash to close
- Down payment
- $28,725
- Closing costs
- $3,447
- Reserves months
- —
- Total cash needed
- —
Loan-product check · same deal, 3 products live
Conventional
25% down · 7.5% · 30yr
- Down + closing
- —
- Monthly P&I
- —
- Monthly cashflow
- —
- DSCR
- —
- Eligible?
- —
Personal DTI + credit; lowest rate.
DSCR
20% down · 8.5% · 30yr
- Down + closing
- —
- Monthly P&I
- —
- Monthly cashflow
- —
- DSCR
- —
- Eligible?
- —
No personal income docs; deal must DSCR.
Hard money
10% down · 12.0% · 12mo
- Down + closing
- —
- Monthly P&I
- —
- Monthly cashflow
- —
- DSCR
- —
- Eligible?
- —
Short-term bridge; refi at stabilization.
Rent comps 31 comps
| Address | Beds | Baths | Sqft | Rent | $/sqft | DOM | Units | Dist |
|---|---|---|---|---|---|---|---|---|
| 2609 Fairport Ave Dayton, OH | 3.0 | 1.0 | 1000 | $1,025 | $1.02 | 2d | 1 | 0.24mi |
| 4446 Waymire Ave Dayton, OH | 3.0 | 1.0 | 1100 | $1,100 | $1.00 | 21d | 1 | 0.40mi |
| 1720 Kings Mill Ct Dayton, OH | 2.0 | 1.5 | 975 | $925 | $0.95 | 23d | 1 | 0.59mi |
| 3537 Otterbein Ave Unit d Dayton, OH | 2.0 | 1.0 | 900 | $925 | $1.03 | 43d | 1 | 0.67mi |
| 4629 Queens Ave Dayton, OH | 2.0 | 1.0 | 900 | $1,100 | $1.22 | 43d | 1 | 0.68mi |
| 3311 Otterbein Ave Dayton, OH | 3.0 | 1.5 | 1004 | $1,300 | $1.29 | 11d | 1 | 0.73mi |
| 3650 Otterbein Ave Unit 3650 Dayton, OH | 2.0 | 1.0 | 900 | $800 | $0.89 | 2d | 1 | 0.76mi |
| 2002 Val Vista Ct Dayton, OH | 3.0 | 1.0 | 975 | $1,095 | $1.12 | 21d | 1 | 0.79mi |
| 4916 Copeland Ave Dayton, OH | 3.0 | 1.5 | 1515 | $1,125 | $0.74 | 11d | 1 | 0.80mi |
| 2141 Philadelphia Dr Dayton, OH | 3.0 | 1.0 | 1736 | $1,395 | $0.80 | 43d | 1 | 0.83mi |
| 3668 Karwin Dr Unit 3672 Dayton, OH | 2.0 | 1.0 | 1500 | $995 | $0.66 | 23d | 1 | 0.87mi |
| 3672 Karwin Dr Unit 3672 Dayton, OH | 2.0 | 1.0 | 1500 | $995 | $0.66 | 43d | 1 | 0.87mi |
| 4246 Redonda Ln Dayton, OH | 3.0 | 1.0 | 1600 | $1,495 | $0.93 | 43d | 1 | 0.88mi |
| 5112 W Hillcrest Ave Unit 1 Dayton, OH | 3.0 | 1.0 | 972 | $700 | $0.72 | 23d | 1 | 0.89mi |
| 3207 Cornell Dr Dayton, OH | 3.0 | 1.0 | 1168 | $1,000 | $0.86 | 3d | 1 | 1.05mi |
| 1927 Burroughs Dr Dayton, OH | 3.0 | 2.0 | 1409 | $1,245 | $0.88 | 14d | 1 | 1.08mi |
| 1207 W Fairview Ave Dayton, OH | 2.0 | 1.0 | 1023 | $825 | $0.81 | 43d | 1 | 1.10mi |
| 1207 W Fairview Ave Dayton, OH | 2.0 | 1.0 | 1023 | $825 | $0.81 | 3d | 1 | 1.10mi |
| 4132 Natchez Ave Dayton, OH | 3.0 | 1.5 | 991 | $1,250 | $1.26 | 3d | 1 | 1.12mi |
| 3031 Garvin Rd Unit C Dayton, OH | 2.0 | 2.0 | 1269 | $1,150 | $0.91 | 43d | 1 | 1.15mi |
| 2247 Salem Ave Unit 2249 Dayton, OH | 3.0 | 1.5 | 1300 | $1,400 | $1.08 | 43d | 1 | 1.19mi |
| 2247 Salem Ave Unit 2247 Dayton, OH | 3.0 | 1.5 | 1300 | $1,350 | $1.04 | 3d | 1 | 1.19mi |
| 2232 Salem Ave Dayton, OH | 3.0 | 1.0 | 1250 | $1,200 | $0.96 | 3d | 1 | 1.21mi |
| 1004 W Fairview Ave Dayton, OH | 2.0 | 1.0 | 1053 | $950 | $0.90 | 23d | 1 | 1.23mi |
| 4161 Mapleleaf Dr Dayton, OH | 3.0 | 1.0 | 960 | $1,250 | $1.30 | 2d | 1 | 1.25mi |
| 1019 Cherry Dr Dayton, OH | 4.0 | 1.0 | 1057 | $1,125 | $1.06 | 43d | 1 | 1.26mi |
| 3220 Princeton Dr Dayton, OH | 3.0 | 1.0 | 900 | $1,000 | $1.11 | 43d | 1 | 1.29mi |
| 3668 Castano Dr Dayton, OH | 3.0 | 2.0 | 1608 | $1,600 | $1.00 | 2d | 1 | 1.39mi |
| 4527 Channing Ln Dayton, OH | 3.0 | 1.0 | 946 | $1,600 | $1.69 | 43d | 1 | 1.46mi |
| 2333 Rustic Rd Dayton, OH | 2.0 | 1.0 | 1000 | $840 | $0.84 | 43d | 1 | 1.47mi |
| 2333 Rustic Rd Unit 4 Dayton, OH | 2.0 | 1.0 | 1000 | $840 | $0.84 | 2d | 1 | 1.47mi |
Listing history 14 events
-
2026-06-18days on market $114,900 Active 17 DOM
-
2026-06-17days on market $114,900 Active 16 DOM
-
2026-06-16days on market $114,900 Active 15 DOM
-
2026-06-15days on market $114,900 Active 14 DOM
-
2026-06-14days on market $114,900 Active 12 DOM
-
2026-06-13days on market $114,900 Active 11 DOM
-
2026-06-10days on market $114,900 Active 9 DOM
-
2026-06-09days on market $114,900 Active 8 DOM
-
2026-06-08days on market $114,900 Active 7 DOM
-
2026-06-07days on market $114,900 Active 6 DOM
-
2026-06-05days on market $114,900 Active 3 DOM
-
2026-06-03days on market $114,900 Active 2 DOM
-
2026-06-01remarks 658-char remark
-
2026-06-01$114,900 Active 1 DOM
ⓘ Source: listings_history table (triggers on properties + properties_extension) + one-shot
backfill from property_details.listing_events for pre-trigger history.
Tax reassessment forecast OH · Partial reset (capped growth)
- Current annual tax
- $1,399 · $117/mo
- Projected year-2 tax
- $1,596 · $133/mo
- Expected delta
- +$196/yr (+$16/mo · 14.0%)
ⓘ Screening estimate from a state-policy table — verify with the county assessor before closing.
Climate risk First Street
- Flood 1/10 Low FEMA zone X (unshaded) · 0% chance over 30 yrs
- Wildfire 1/10 Low
- Heat 3/10 Moderate 7 d/yr ≥103°F today · 19 d/yr by 30 yrs out
- Wind 2/10 Low 0% chance of damaging wind over 30 yrs
- Air quality 3/10 Moderate 2 unhealthy d/yr today · 4 by 30 yrs out
Nearby sold comps map
Loading sold comps map…
Walkable amenities ~0.75 mi
Loading nearby amenities…
Taxation est. · year 1
- Rental income
- $14,006
- − Mortgage interest
- −$6,436
- − Property taxes
- −$1,399
- − Insurance
- −$574
- − Repairs & maintenance
- −$1,120
- − Management
- −$1,120
- − Depreciation
- −$3,343
- Taxable income
- $12
- Est. tax owed @ 24.0%
- −$3
- After-tax cash flow
- $1,857/yr
For passive investors: Depreciation is non-cash, so a rental often shows a tax loss while cash-flowing — sheltering income. Rental losses are passive: they offset passive income freely, and up to $25,000/yr can offset ordinary (W-2) income if you actively participate and your MAGI is under $100k (phasing out to $0 by $150k); unused losses carry forward. On sale, claimed depreciation is recaptured at up to 25%, and gains may owe capital-gains tax (a 1031 exchange can defer both). Figures are a year-1 estimate at your 24.0% rate — not tax advice; consult a CPA.
Schools (NCES district)
- District
- Dayton City
- NCES district ID
- 3904384
- Math proficiency
- 12% ▼ -12.00%
- Reading proficiency
- 21% ▼ -11.00%
- Median HH income
- $28,688
- Composite
- 12.94/100
- National rank
- #9579
- State rank
- #641 of 656 in OH
Livability — Fort McKinley
No livability data for this city. (Only ~50 U.S. cities are tracked.)
Census & demographics
- Census place
- Fort McKinley, OH
- County
- Montgomery County · 459,541 people
- Metro
- Dayton-Kettering, OH
- Population (ZIP)
- 19,991
- Household income
- $41,796
- Rent vs Own
- Severe rent burden
- 1504.0
Population outlook (Montgomery County) Hauer SSP2
- Today (2025)
- 523,241 people
- By 2030
- 514,948 · -1.6%
- By 2040
- 493,378 · -5.7%
- By 2050
- 469,639 · -10.2%
- By 2075
- 418,360 · -20.0%
- By 2100
- 353,315 · -32.5%
Race, ethnicity, and origin ACS 2023
- Neighborhood character
- Predominantly Black (75%)
- Race & ethnicity
- Black 75% White 16% Two or more races 7% Hispanic / Latino 3%
- Common ancestry
- Italian 2% Lithuanian 1% Slovak 1%
- Foreign-born
- 2% · Canada
- Languages at home
- 97% English-only · Spanish 1%
Political lean MEDSL · Montgomery
- 2024 margin
- Toss-up / Even · D 49.8% · R 49.3%
- 2008→2024 swing
- -5.8pp toward R · 2008: 6.2pp · 2024: 0.5pp
- All cycles
- 2024: D+0.5 2020: D+2.2 2016: R+1.2 2012: D+3.1 2008: D+6.2
Not yet ingested
- Civics
- —
Market trends
- HPI YoY
- ▼ -113.75%
- Current HPI
- 197.1302
- Rent YoY
- ▲ 3.03%
- Metro
- Dayton-Kettering, OH
- State GDP YoY
- ▲ 1.98%
- F500 in state
- 48
Industry mix (Fortune 500 HQ in OH)
| Industry | F500 HQs | Revenue |
|---|---|---|
| Insurance | 3 | $145B |
|
||
| Industrial Machinery | 3 | $49B |
|
||
| Financial Services | 3 | $24B |
|
||
| Consumer Goods | 2 | $93B |
|
||
| Aerospace / Defense | 2 | $47B |
|
||
| Utilities | 2 | $33B |
|
||
Price history
+1847.5% since first listed5 events — show timeline
- 2026-06-01 Listed $114,900 Dayton MLS
- 2013-06-21 Sold (MLS) $5,500 Dayton MLS
- 2013-06-21 Sold (MLS) $5,500 Dayton MLS
- 2013-05-31 Listing Removed — Dayton MLS
- 2013-03-04 Listed $5,900 Dayton MLS
Property tax history
+8.1%/yrLatest (2025): $1,399 · -4.4% YoY. Source: county tax records.
Cash-flow waterfall
monthlySold comps — $/sqft
last 12 mo · ≤1 miLoading sold comps…