275 Morton Rd · Gray, GA
Flood risk 1/10 · Minimal
- FEMA flood zone
- X (unshaded)
- Chance of flooding over 30 yrs
- 0.0%
- Est. flood insurance / yr
- $507 – $1,088
Fire risk 3/10 · Minor
- Est. fire insurance / yr
- $963 – $1,789
Heat risk 6/10 · Moderate
- Hot days now (above 107°F)
- 7 days/yr
- Hot days in 30 yrs
- 17 days/yr
Wind risk 6/10 · Moderate
- Chance of severe wind over 30 yrs
- 60.0%
Air-quality risk 4/10 · Minor
- Unhealthy air days now
- 4 days/yr
- Unhealthy air days in 30 yrs
- 5 days/yr
Risk factors via First Street. Map © Google.
Why this score? — see what drove the C+ grade
The composite is a weighted blend of 9 inputs, each scored 0–100. Each bar is that input's sub-score; the figure is the points it added to the 100-point composite (weight × sub-score).
- Cash flow +25.1/30.0
- DSCR +8.2/10.0
- ARV discount +7.5/15.0
- 1% rule +6.0/10.0
- Appreciation +4.0/10.0
- Livability +3.8/5.0
- Schools +2.9/10.0
- Rent growth +2.5/5.0
- Condition / age +2.5/5.0
$165,000
🖨 Deal sheet 📄 Offer letter ✓ Due diligence
Listing remarks MLS
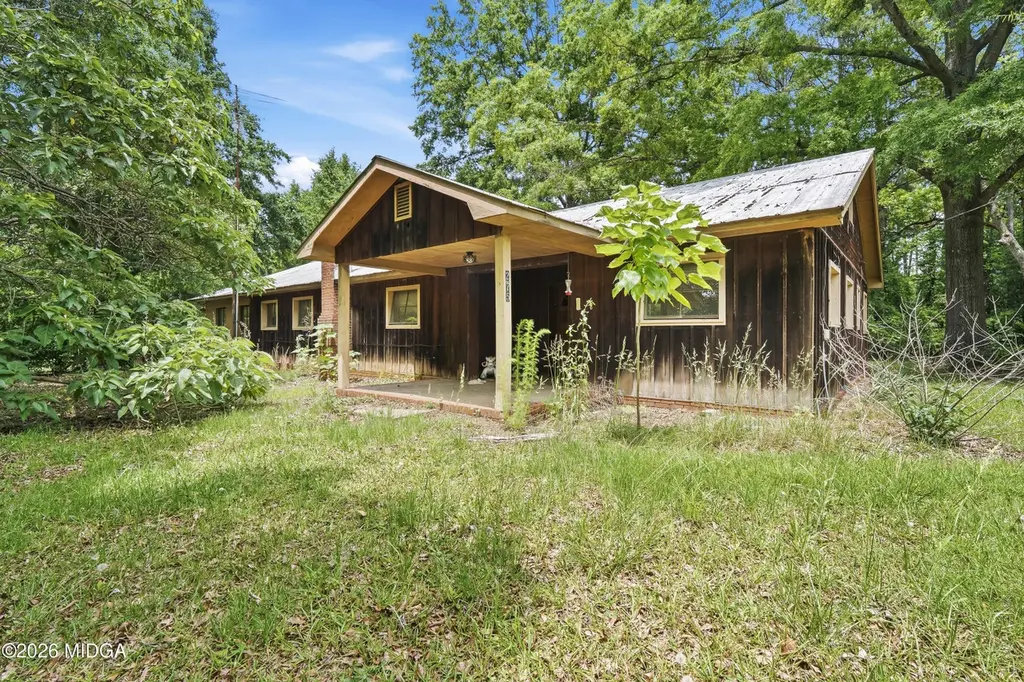
Investor opportunity in the heart of Gray! Situated on over 2 acres, this 3-bedroom, 2-bath property offers endless potential for investors, renovators, or buyers looking to create their own vision. With plenty of space both inside and out, the property provides room for expansion, outdoor living, or future improvements. Conveniently located near local amenities while still offering a private, country-style setting. Whether you're looking for a rental investment, flip opportunity, or a home with acreage, this property is full of possibilities. Don't miss the chance to unlock the value of this spacious property in a growing area!
Key facts
- Home with acreage
- Over 2 acres
- Room for expansion
Tags
Property features AI
Finance
- Other: Property listed by eXp Realty
- HOA & community: No HOA; No community features
Exterior
- Parking: Detached garage; Detached parking
- Utilities: Well water; Septic tank; Electricity available; Natural gas available
- Home design: Single-family residence; House structure; One level; Resale property
- Construction: Built in 1977
- Exterior features: Metal roof; Wood siding; Lot features: Other; 2.1-acre lot
Interior
- Kitchen: No appliances listed
- Bedrooms: 3 bedrooms (all on the main level)
- Flooring: Carpet and other flooring types
- Bathrooms: 2 full bathrooms (main level)
- Heating & cooling: No heating; No cooling
- Interior features: Other interior features
- Laundry & utility: Laundry features: Other
Neighborhood map
What this means for you Summary
Snapshot
- This is a 3-bed/1.5-bath single-family listed at $165k.
Deal economics
- At list price, monthly cash flow is $366 ($4k/yr) — positive.
- The deal already cash-flows at list — no discount required.
- Meets the 1% rule at list price ($2k rent vs $165k).
- Cap rate 9.0% vs local median 4.2% in Gray — top-decile yield for the area; either an underpriced asset or a hidden risk that comps aren't pricing in. Stress-test before assuming the spread holds.
Location & tenants
- Location reads 76/100 on livability (#26 in GA, #3,600 nationally) — a middle-class / working-renter tenant base. Strengths: crime A+, cost of living A+, housing A+; Watch: amenities F, commute F.
- Jones County (rural): math 32% / reading 34% proficiency, ranked #72 of 174 in GA (top 41%) — families likely to look elsewhere, expect single-tenant / working-renter base with shorter leases.
- Zoned schools: Gray Elementary School (math 36% / reading 35%, grade F, #519 of 1,228 statewide, top 42%, 533 students, 66% FRL); Gray Station Middle School (math 33% / reading 40%, grade F, #167 of 470 statewide, top 38%, 653 students, 45% FRL).
- Market conditions: 94 active listings in the ZIP; 106 units permitted in Jones County in 2024 (6 in 5+ unit buildings).
Forward outlook
- Local home prices are declining (-1.9%/yr); year-one equity from $1k of loan paydown is wiped out by about $3k of value loss. Plan a longer hold.
- Jones County population projected at -11% by 2050 — secular population decline; favor cash flow + early exit over multi-decade hold.
- At projected returns (-1.9% appreciation + 3.0% rent growth), your $46k cash investment doubles in ~10 years — after that, you're playing with house money.
Negotiation context
- Only 13 days on market — expect competitive offers; lowballing is unlikely to land.
- 2 sale attempts with the ask held roughly flat each time — persistent listings suggest the price (not the market) is what's stuck; bring a comps-based counter.
Risks & watch-outs
- Climate carrying-cost: major wind risk, 60% chance of damaging wind over 30y; extreme-heat days projected 7→17/yr by 2055 (HVAC capex compounding) — expect insurance premiums to compound above CPI over the hold.
Questions for the listing agent
- Built in 1977 — when were the roof, HVAC, electrical panel, plumbing, and water heater last replaced?
- Is there a deadline driving the sale (1031 exchange, divorce, estate, relocation)? That informs how much negotiation room exists.
- Schools are D-rated, which usually means shorter tenancies and higher turnover. Who's the typical renter profile here, and what's been the actual vacancy rate?
- What's the average days-on-market for RENTAL listings here right now (not sales)? A rising rental-DOM trend means longer vacancies and softer asking-rent achievability than the comps imply.
- What's the recent tenant-quality profile in this submarket — average credit score on applications, eviction rate, late-payment / NSF rate, and stable-employment percentage? A property-management company in the area should have these aggregated.
- How much new for-sale + rental construction is in the pipeline within 1–3 miles? Heavy new supply typically softens prices + rents 12–24 months out; constrained supply supports both.
Investment metrics
- 1% rule
- 1.10% ✓
- Cap rate
- 8.96%
- Cash-on-cash
- 9.51%
- DSCR
- 1.42
- GRM
- 7.6
CMA / ARV
No comps found within radius.
Projected returns pro-forma
-1.92% appreciation · 3.0% rent growth · sell at horizon
- IRR
- 2.2%
- Equity multiple
- 1.09×
- Total profit
- $4,161
- Equity at exit
- $32,669
- IRR
- 10.0%
- Equity multiple
- 1.87×
- Total profit
- $40,395
- Equity at exit
- $28,516
Cash invested: $46,200 (down + closing). Projections, not guarantees.
Landlord ↔ Tenant lean methodology
- Overall (STATE)
- 90 Strongly Landlord-Friendly
- State Georgia
- 90 Strongly Landlord-Friendly · R+3
- County
- — inherits STATE
- City
- — inherits STATE
ZIP-level market 31032
- Home prices YoY
- -0.9%
- Active inventory
- 94
- Price-to-rent
- 7.6×
Monthly cashflow live
- Estimated rent
- $1,820 medium interval (Pro) →
- Mortgage (P&I)
- −$865
- Tax from tax record
- −$137 /mo · $1,646/yr
- Insurance
- −$69
- HOA
- −$0
- Vacancy / Maint / Mgmt
- −$382
- Net cashflow
- $366
Break-even live
Sensitivity live
| Price | -10% $460 | -5% $413 | +0% $366 | +5% $320 | +10% $273 |
|---|---|---|---|---|---|
| Rent | -10% $223 | -5% $294 | +0% $366 | +5% $438 | +10% $510 |
| Rate | -1.0pp $449 | -0.5pp $408 | base $366 | +0.5pp $324 | +1.0pp $280 |
UW: 25.0% down · 7.5% · 30yr · 1.5% tax · 5.0% vac · 8.0% maint · 8.0% mgmt
Financing live
Cash to close
- Down payment
- $41,250
- Closing costs
- $4,950
- Reserves months
- —
- Total cash needed
- —
Loan-product check · same deal, 3 products live
Conventional
25% down · 7.5% · 30yr
- Down + closing
- —
- Monthly P&I
- —
- Monthly cashflow
- —
- DSCR
- —
- Eligible?
- —
Personal DTI + credit; lowest rate.
DSCR
20% down · 8.5% · 30yr
- Down + closing
- —
- Monthly P&I
- —
- Monthly cashflow
- —
- DSCR
- —
- Eligible?
- —
No personal income docs; deal must DSCR.
Hard money
10% down · 12.0% · 12mo
- Down + closing
- —
- Monthly P&I
- —
- Monthly cashflow
- —
- DSCR
- —
- Eligible?
- —
Short-term bridge; refi at stabilization.
Listing history 9 events
-
2026-06-09status $165,000 Under Contract 13 DOM
-
2026-06-08days on market $165,000 New 13 DOM
-
2026-06-07days on market $165,000 New 12 DOM
-
2026-06-02days on market $165,000 New 7 DOM
-
2026-06-01days on market $165,000 New 6 DOM
-
2026-05-31days on market $165,000 New 5 DOM
-
2026-05-30days on market $165,000 New 4 DOM
-
2026-05-26$165,000 Active 636-char remark
Show marketing remark (636 chars)
Investor opportunity in the heart of Gray! Situated on over 2 acres, this 3-bedroom, 2-bath property offers endless potential for investors, renovators, or buyers looking to create their own vision. With plenty of space both inside and out, the property provides room for expansion, outdoor living, or future improvements. Conveniently located near local amenities while still offering a private, country-style setting. Whether you're looking for a rental investment, flip opportunity, or a home with acreage, this property is full of possibilities. Don't miss the chance to unlock the value of this spacious property in a growing area!
-
2026-05-11$165,000 New
ⓘ Source: listings_history table (triggers on properties + properties_extension) + one-shot
backfill from property_details.listing_events for pre-trigger history.
Tax reassessment forecast GA · Resets to sale price
- Current annual tax
- $1,646 · $137/mo
- Projected year-2 tax
- $1,646 · $137/mo
- Expected delta
- $0/yr ($0/mo · 0.0%)
ⓘ Screening estimate from a state-policy table — verify with the county assessor before closing.
Climate risk First Street
- Flood 1/10 Low FEMA zone X (unshaded) · 0% chance over 30 yrs
- Wildfire 3/10 Moderate
- Heat 6/10 Major 7 d/yr ≥107°F today · 17 d/yr by 30 yrs out
- Wind 6/10 Major 60% chance of damaging wind over 30 yrs
- Air quality 4/10 Moderate 4 unhealthy d/yr today · 5 by 30 yrs out
Nearby sold comps map
Loading sold comps map…
Walkable amenities ~0.75 mi
Loading nearby amenities…
Taxation est. · year 1
- Rental income
- $21,835
- − Mortgage interest
- −$9,243
- − Property taxes
- −$1,646
- − Insurance
- −$825
- − Repairs & maintenance
- −$1,747
- − Management
- −$1,747
- − Depreciation
- −$4,800
- Taxable income
- $1,828
- Est. tax owed @ 24.0%
- −$439
- After-tax cash flow
- $3,957/yr
For passive investors: Depreciation is non-cash, so a rental often shows a tax loss while cash-flowing — sheltering income. Rental losses are passive: they offset passive income freely, and up to $25,000/yr can offset ordinary (W-2) income if you actively participate and your MAGI is under $100k (phasing out to $0 by $150k); unused losses carry forward. On sale, claimed depreciation is recaptured at up to 25%, and gains may owe capital-gains tax (a 1031 exchange can defer both). Figures are a year-1 estimate at your 24.0% rate — not tax advice; consult a CPA.
Schools (NCES district)
- District
- Jones County
- NCES district ID
- 1303150
- Math proficiency
- 32% ▼ -8.00%
- Reading proficiency
- 34% ▼ -8.00%
- Median HH income
- $51,630
- Composite
- 28.84/100
- National rank
- #6649
- State rank
- #72 of 174 in GA
Livability — Gray
- Score
- 76/100
- State rank
- #26
- US rank
- #3600
Category grades
Schools grade is shown separately in the Schools card above.
Census & demographics
- Population (ZIP)
- 13,755
Population outlook (Jones County) Hauer SSP2
- Today (2025)
- 28,682 people
- By 2030
- 28,394 · -1.0%
- By 2040
- 27,246 · -5.0%
- By 2050
- 25,575 · -10.8%
- By 2075
- 21,857 · -23.8%
- By 2100
- 17,453 · -39.1%
Race, ethnicity, and origin ACS 2023
- Neighborhood character
- Predominantly White (77%)
- Race & ethnicity
- White 77% Black 18% Two or more races 2% Hispanic / Latino 2%
- Common ancestry
- Italian 3% Romanian 2% Slovak 2%
- Foreign-born
- 2% · Canada
- Languages at home
- 97% English-only · Spanish 2%
Political lean MEDSL · Jones
- 2024 margin
- Solid R (+38.0) · D 30.8% · R 68.8%
- 2008→2024 swing
- -12.2pp toward R · 2008: -25.8pp · 2024: -38.0pp
- All cycles
- 2024: R+38.0 2020: R+33.9 2016: R+34.7 2012: R+28.7 2008: R+25.8
Not yet ingested
- Civics
- —
Market trends
- HPI YoY
- ▼ -1.92%
- Current HPI
- 211.7341
- Rent YoY
- —
- Metro
- —
- State GDP YoY
- ▲ 2.66%
- F500 in state
- 28
Industry mix (Fortune 500 HQ in GA)
| Industry | F500 HQs | Revenue |
|---|---|---|
| Paper / Packaging | 2 | $29B |
|
||
| Retail | 1 | $160B |
|
||
| Transportation / Logistics | 1 | $91B |
|
||
| Airlines | 1 | $62B |
|
||
| Consumer Goods | 1 | $47B |
|
||
| Utilities | 1 | $25B |
|
||
Price history
+0.0% since first listed2 events — show timeline
- 2026-05-26 Listed $165,000 MGMLS
- 2026-05-11 Listed $165,000 GAMLS
Property tax history
+8.0%/yrLatest (2025): $1,646 · +3.2% YoY. Source: county tax records.
Cash-flow waterfall
monthlySold comps — $/sqft
last 12 mo · ≤1 miLoading sold comps…