1348 John Ross Dr · Kalamazoo, MI
Flood risk No data
- FEMA flood zone
- —
- Chance of flooding over 30 yrs
- —
- Est. flood insurance / yr
- —
Fire risk No data
- Est. fire insurance / yr
- —
Heat risk No data
- Hot days now (above threshold)
- —
- Hot days in 30 yrs
- —
Wind risk No data
- Chance of severe wind over 30 yrs
- —
Air-quality risk No data
- Unhealthy air days now
- —
- Unhealthy air days in 30 yrs
- —
Risk factors via First Street. Map © Google.
Why this score? — see what drove the B- grade
The composite is a weighted blend of 9 inputs, each scored 0–100. Each bar is that input's sub-score; the figure is the points it added to the 100-point composite (weight × sub-score).
- Cash flow +30.0/30.0
- 1% rule +10.0/10.0
- DSCR +10.0/10.0
- ARV discount +7.5/15.0
- Schools +4.7/10.0
- Livability +3.8/5.0
- Condition / age +2.5/5.0
- Rent growth +1.3/5.0
- Appreciation +0.0/10.0
$78,000
🖨 Deal sheet (PDF) 📄 Offer letter ✓ Due diligence
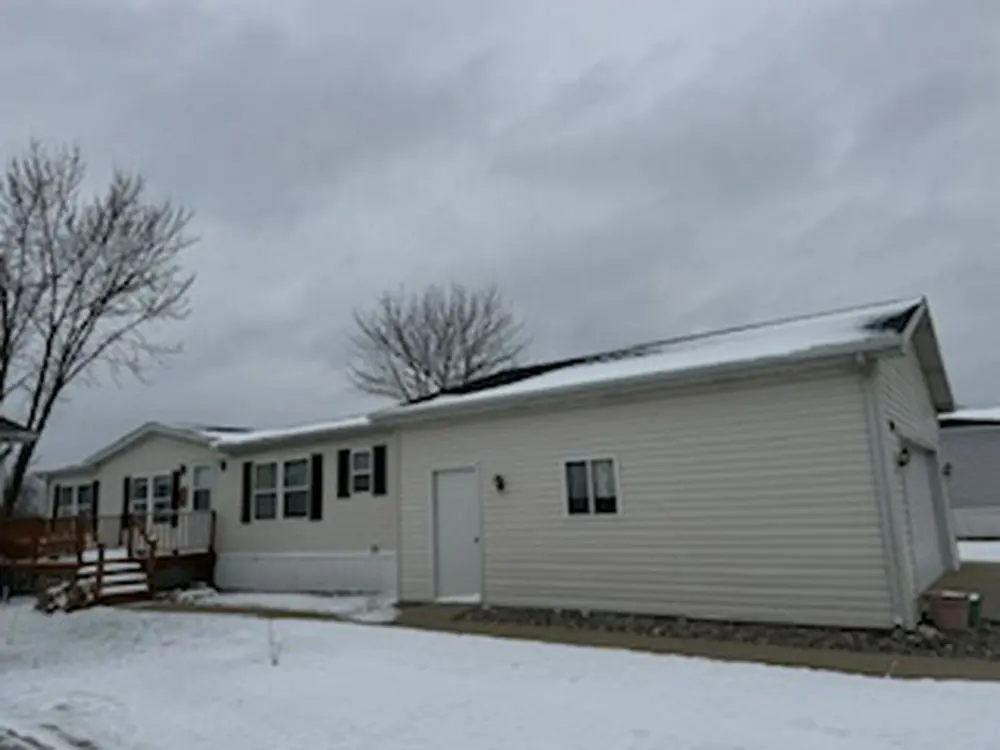
Listing remarks
Lovely 3 bedroom, 2 bath home with large 2 car garage in beautiful Fountain Springs community. Lot rent in the community includes pet fess, lawn mowing, trimming, and other basic lawn needs, pool, clubhouse, pickleball court. Home is for sale only and not moveable. For a tour please message or call the community office M-F 9-6. Financing available with multiple lending partners. All appliances are included. Roof, windows and mechanicals have been been updated within last 5 years. EHO
Key facts
- Pickleball court
- Clubhouse
- Roof updated
Tags
Neighborhood map
What this means for you Summary
Snapshot
- This is a 3-bed/1.0-bath single-family listed at $78k.
Deal economics
- At list price, monthly cash flow is $844 ($10k/yr) — positive.
- The deal already cash-flows at list — no discount required.
- Meets the 1% rule at list price ($2k rent vs $78k).
- Recommended offer: $77k (1.5% below list) — sets the bar for market timing.
- Cap rate 19.3% vs local median 3.4% in Kalamazoo — top-decile yield for the area; either an underpriced asset or a hidden risk that comps aren't pricing in. Stress-test before assuming the spread holds.
Location & tenants
- Location reads 76/100 on livability (#141 in MI, #3,492 nationally) — a middle-class / working-renter tenant base. Strengths: commute A+, cost of living A+, housing A+; Watch: crime F, employment D-.
- Kalamazoo Public Schools (urban): math 43% / reading 72% proficiency, ranked #71 of 540 in MI (top 13%) — acceptable for families but not a draw, mixed tenant base, ~2y average lease; 66% free/reduced lunch — lower-income household profile, screen leases tightly.
- Zoned schools: Prairie Ridge Elementary School (470 students, 71% FRL); Maple Street Magnet School For The Arts (math 75% / reading 75%, grade A, #8 of 493 statewide, top 3%, 860 students, 59% FRL); Loy Norrix High School (math 47% / reading 82%, grade B-, #46 of 713 statewide, top 7%, 1,771 students, 68% FRL) — zoned schools at 66% FRL track the district average.
- Zoned-school proficiency averages 70% at this address vs 58% district-wide (+12 pts) — the actual schools serving this property are materially stronger than the Kalamazoo Public Schools average implies; a family-tenant draw the district grade alone would hide.
- Market conditions: Rents falling (-5.0%/yr); 382 active listings in the ZIP; 6 comparable units currently listed for rent nearby; rentals at typical pace (median 15d on market — plan ~3-4 weeks tenant-placement turnaround); solid renter incomes; 339 units permitted in Kalamazoo County in 2024 (22 in 5+ unit buildings).
Forward outlook
- Local home prices are declining (-3.0%/yr); year-one equity from $539 of loan paydown is wiped out by about $2k of value loss. Plan a longer hold.
- Kalamazoo County population projected at +18% by 2050 — long-run rental-demand tailwind backs the buy-and-hold thesis.
- At projected returns (-3.0% appreciation + 0.0% rent growth), your $22k cash investment doubles in ~3 years — after that, you're playing with house money.
Negotiation context
- It's been on market 17 days — a 2% lower offer ($77k) is reasonable based on typical stale-listing flexibility.
Questions for the listing agent
- Is there a deadline driving the sale (1031 exchange, divorce, estate, relocation)? That informs how much negotiation room exists.
- Crime grade is F in this area — have there been break-ins, vandalism, or insurance claims at this property in the last 3 years? What carrier currently insures it and at what premium?
- What's the average days-on-market for RENTAL listings here right now (not sales)? A rising rental-DOM trend means longer vacancies and softer asking-rent achievability than the comps imply.
- What's the recent tenant-quality profile in this submarket — average credit score on applications, eviction rate, late-payment / NSF rate, and stable-employment percentage? A property-management company in the area should have these aggregated.
- How much new for-sale + rental construction is in the pipeline within 1–3 miles? Heavy new supply typically softens prices + rents 12–24 months out; constrained supply supports both.
Investment metrics
- 1% rule
- 2.12% ✓
- Cap rate
- 19.28%
- Cash-on-cash
- 46.38%
- DSCR
- 3.06
- GRM
- 3.9
CMA / ARV
- ARV (on-the-fly)
- $266,215
- Comps found
- 1
Show comp detail 1 sale within ~0.75 mi
| Address | Dist | Beds/Ba | Sqft | Sold | Price | $/sf | Match |
|---|---|---|---|---|---|---|---|
| 2089 S 9th St | 0.65mi | 3/2.5 | 1,608 (+12%) | 14mo | $297,000 | $185 | 33 |
Match score weights: distance 35% · size 25% · config 20% · recency 20%. Top-matched comps best support the ARV.
Projected returns pro-forma
-3.0% appreciation · 0.0% rent growth · sell at horizon
- IRR
- 40.4%
- Equity multiple
- 2.66×
- Total profit
- $36,269
- Equity at exit
- $11,630
- IRR
- 45.3%
- Equity multiple
- 4.76×
- Total profit
- $82,032
- Equity at exit
- $6,744
Cash invested: $21,840 (down + closing). Projections, not guarantees.
Landlord ↔ Tenant lean methodology
- Overall (STATE)
- 62 Landlord-Friendly
- State Michigan
- 62 Landlord-Friendly · EVEN
- County
- — inherits STATE
- City
- — inherits STATE
ZIP-level market 49009
- Rents YoY
- -5.0%
- Active inventory
- 382
- Price-to-rent
- 3.9×
Monthly cashflow live
- Estimated rent
- $1,650 high interval (Pro) →
- Mortgage (P&I)
- −$409
- Tax from tax record
- −$18 /mo · $212/yr
- Insurance
- −$32
- HOA
- −$0
- Vacancy / Maint / Mgmt
- −$346
- Net cashflow
- $844
Break-even live
Sensitivity live
| Price | -10% $888 | -5% $866 | +0% $844 | +5% $822 | +10% $800 |
|---|---|---|---|---|---|
| Rent | -10% $714 | -5% $779 | +0% $844 | +5% $909 | +10% $975 |
| Rate | -1.0pp $883 | -0.5pp $864 | base $844 | +0.5pp $824 | +1.0pp $803 |
UW: 25.0% down · 7.5% · 30yr · 1.5% tax · 5.0% vac · 8.0% maint · 8.0% mgmt
Financing live
Cash to close
- Down payment
- $19,500
- Closing costs
- $2,340
- Reserves months
- —
- Total cash needed
- —
Loan-product check · same deal, 3 products live
Conventional
25% down · 7.5% · 30yr
- Down + closing
- —
- Monthly P&I
- —
- Monthly cashflow
- —
- DSCR
- —
- Eligible?
- —
Personal DTI + credit; lowest rate.
DSCR
20% down · 8.5% · 30yr
- Down + closing
- —
- Monthly P&I
- —
- Monthly cashflow
- —
- DSCR
- —
- Eligible?
- —
No personal income docs; deal must DSCR.
Hard money
10% down · 12.0% · 12mo
- Down + closing
- —
- Monthly P&I
- —
- Monthly cashflow
- —
- DSCR
- —
- Eligible?
- —
Short-term bridge; refi at stabilization.
Rent comps 6 comps
| Address | Beds | Baths | Sqft | Rent | $/sqft | DOM | Units | Dist |
|---|---|---|---|---|---|---|---|---|
| 1410 S 9th St Kalamazoo, MI | 2.0–3.0 | 2.0 | 1204 | $1,719 | $1.43 | 22d | 1 | 0.13mi |
| 5900 Copper Beech Blvd Kalamazoo, MI | 1.0–4.0 | 1.0–4.5 | 1325 | $916 | $0.69 | 15d | 1 | 0.92mi |
| 6065 Fairgrove St Kalamazoo, MI | 3.0 | 3.0 | 1400 | $2,000 | $1.43 | 15d | 1 | 0.99mi |
| 5500 W KL Ave Kalamazoo, MI | 1.0–3.0 | 1.0–2.0 | 836 | $1,349 | $1.61 | 15d | 1 | 1.20mi |
| 6660 W Main St Kalamazoo, MI | 2.0 | 1.0 | 1025 | $1,295 | $1.26 | 15d | 1 | 1.44mi |
| 690 Dragonfly Rd Kalamazoo, MI | 1.0–3.0 | 1.0–2.0 | 969 | $1,192 | $1.23 | 15d | 32 | 1.46mi |
Listing history 13 events
-
2026-06-21days on market $78,000 Active 17 DOM
-
2026-06-18days on market $78,000 Active 14 DOM
-
2026-06-17days on market $78,000 Active 13 DOM
-
2026-06-16days on market $78,000 Active 12 DOM
-
2026-06-15days on market $78,000 Active 11 DOM
-
2026-06-14days on market $78,000 Active 9 DOM
-
2026-06-13days on market $78,000 Active 8 DOM
-
2026-06-10days on market $78,000 Active 6 DOM
-
2026-06-09days on market $78,000 Active 5 DOM
-
2026-06-08days on market $78,000 Active 4 DOM
-
2026-06-07days on market $78,000 Active 3 DOM
-
2026-06-05remarks 489-char remark
-
2026-06-05$78,000 Active 1 DOM
ⓘ Source: listings_history table (triggers on properties + properties_extension) + one-shot
backfill from property_details.listing_events for pre-trigger history.
Tax reassessment forecast MI · Partial reset (capped growth)
- Current annual tax
- $212 · $18/mo
- Projected year-2 tax
- $707 · $59/mo
- Expected delta
- +$495/yr (+$41/mo · 233.1%)
ⓘ Screening estimate from a state-policy table — verify with the county assessor before closing.
Nearby sold comps map
Loading sold comps map…
Walkable amenities ~0.75 mi
Loading nearby amenities…
Taxation est. · year 1
- Rental income
- $19,799
- − Mortgage interest
- −$4,369
- − Property taxes
- −$212
- − Insurance
- −$390
- − Repairs & maintenance
- −$1,584
- − Management
- −$1,584
- − Depreciation
- −$2,269
- Taxable income
- $9,390
- Est. tax owed @ 24.0%
- −$2,254
- After-tax cash flow
- $7,877/yr
For passive investors: Depreciation is non-cash, so a rental often shows a tax loss while cash-flowing — sheltering income. Rental losses are passive: they offset passive income freely, and up to $25,000/yr can offset ordinary (W-2) income if you actively participate and your MAGI is under $100k (phasing out to $0 by $150k); unused losses carry forward. On sale, claimed depreciation is recaptured at up to 25%, and gains may owe capital-gains tax (a 1031 exchange can defer both). Figures are a year-1 estimate at your 24.0% rate — not tax advice; consult a CPA.
Schools (NCES district)
- District
- Kalamazoo Public Schools
- NCES district ID
- 2619950
- Math proficiency
- 43% ▲ 13.00%
- Reading proficiency
- 72% ▲ 33.00%
- Median HH income
- $35,291
- Composite
- 47.48/100
- National rank
- #2275
- State rank
- #71 of 540 in MI
Livability — Kalamazoo
- Score
- 76/100
- State rank
- #141
- US rank
- #3492
Category grades
Schools grade is shown separately in the Schools card above.
Census & demographics
- County
- Kalamazoo County · 224,317 people
- City population
- 121,397
- Metro
- Kalamazoo-Portage, MI
- Population (ZIP)
- 47,971
- Household income
- $80,930
- Rent vs Own
- Severe rent burden
- 1579.0
Population outlook (Kalamazoo County) Hauer SSP2
- Today (2025)
- 280,982 people
- By 2030
- 292,068 · +3.9%
- By 2040
- 312,191 · +11.1%
- By 2050
- 331,196 · +17.9%
- By 2075
- 379,021 · +34.9%
- By 2100
- 396,579 · +41.1%
Race, ethnicity, and origin ACS 2023
- Neighborhood character
- Predominantly White (75%)
- Race & ethnicity
- White 75% Two or more races 9% Black 8% Asian 5% Hispanic / Latino 4%
- Common ancestry
- Iranian 9% Romanian 6% Lithuanian 2%
- Foreign-born
- 9% · Canada, China
- Languages at home
- 88% English-only · Other Indo-European 3% Arabic 2% Spanish 2%
Political lean MEDSL · Kalamazoo
- 2024 margin
- D (+17.7) · D 58.0% · R 40.3% · Other 1.7%
- 2008→2024 swing
- -1.8pp toward R · 2008: 19.5pp · 2024: 17.7pp
- All cycles
- 2024: D+17.7 2020: D+18.7 2016: D+12.8 2012: D+13.3 2008: D+19.5
Not yet ingested
- Civics
- —
Market trends
- HPI YoY
- ▼ -207.34%
- Current HPI
- 209.5649
- Rent YoY
- ▼ -4.96%
- Metro
- Kalamazoo-Portage, MI
- State GDP YoY
- ▲ 1.37%
- F500 in state
- 28
Industry mix (Fortune 500 HQ in MI)
| Industry | F500 HQs | Revenue |
|---|---|---|
| Automotive Parts | 3 | $48B |
|
||
| Automotive | 2 | $372B |
|
||
| Chemicals | 1 | $45B |
|
||
| Automotive Retail | 1 | $29B |
|
||
| Healthcare / Medical Devices | 1 | $23B |
|
||
| Automotive Technology | 1 | $20B |
|
||
Price history
1 event — show timeline
- 2026-06-04 Listed $78,000 ForSaleByOwner.com
Property tax history
+3.7%/yrLatest (2025): $212 · +2.9% YoY. Source: county tax records.
Cash-flow waterfall
monthlySold comps — $/sqft
last 12 mo · ≤1 miLoading sold comps…