 Fourplex
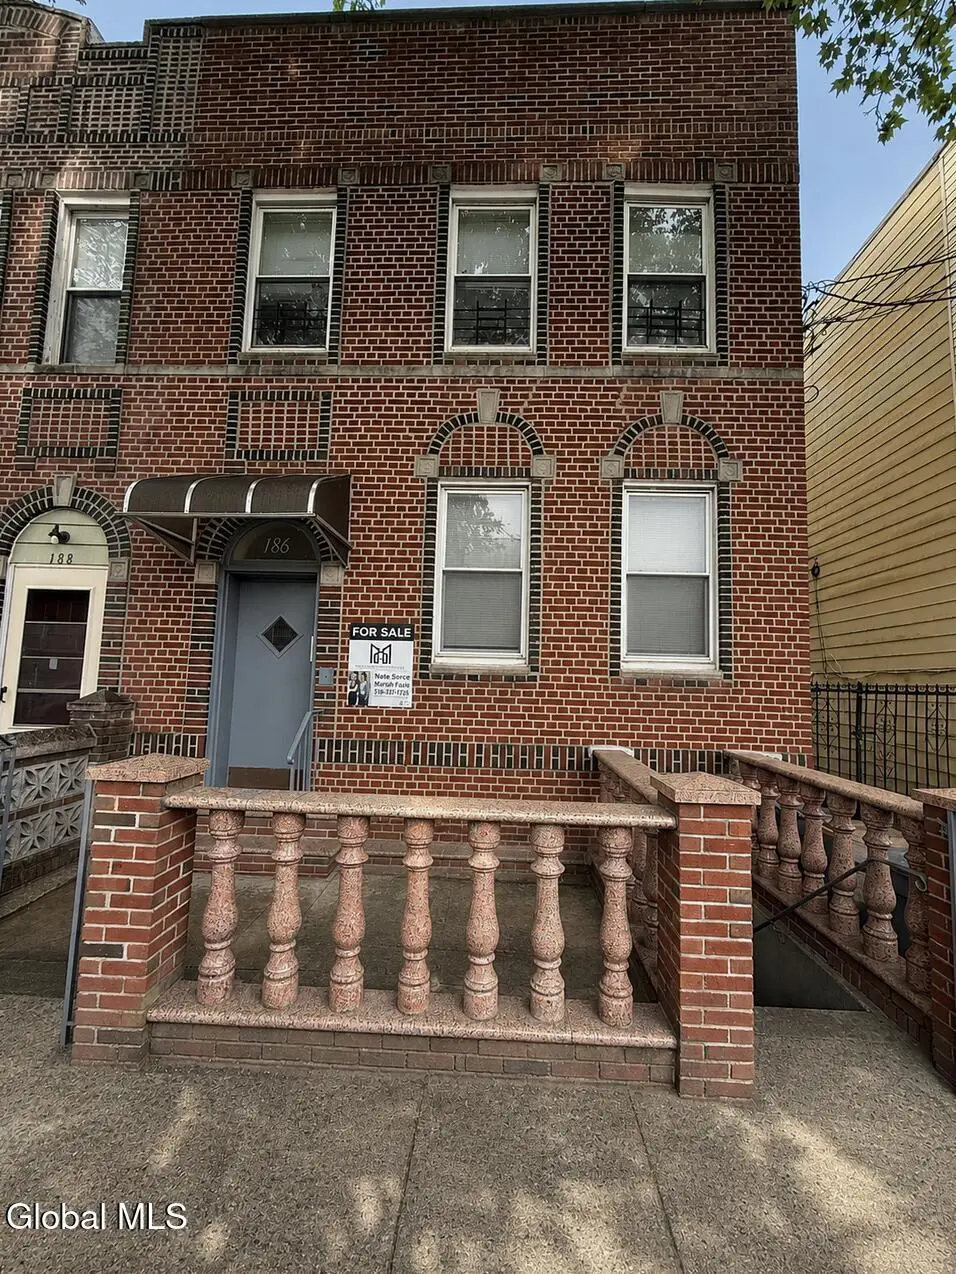
186 Bay 35th St · New York, NY
Flood risk 4/10 · Minor
- FEMA flood zone
- X (unshaded)
- Chance of flooding over 30 yrs
- 0.13%
- Est. flood insurance / yr
- $507 – $1,088
Fire risk 1/10 · Minimal
- Est. fire insurance / yr
- $691 – $1,283
Heat risk 7/10 · Major
- Hot days now (above 97°F)
- 7 days/yr
- Hot days in 30 yrs
- 16 days/yr
Wind risk 6/10 · Moderate
- Chance of severe wind over 30 yrs
- 68.0%
Air-quality risk 4/10 · Minor
- Unhealthy air days now
- 5 days/yr
- Unhealthy air days in 30 yrs
- 7 days/yr
Risk factors via First Street. Map © Google.
Why this score? — see what drove the C+ grade
The composite is a weighted blend of 9 inputs, each scored 0–100. Each bar is that input's sub-score; the figure is the points it added to the 100-point composite (weight × sub-score).
- Cash flow +19.0/30.0
- Appreciation +10.0/10.0
- ARV discount +7.5/15.0
- DSCR +6.0/10.0
- 1% rule +5.1/10.0
- Schools +5.0/10.0
- Rent growth +3.9/5.0
- Livability +3.8/5.0
- Condition / age +2.2/5.0
$1,899,000
🖨 Deal sheet (PDF) 📄 Offer letter ✓ Due diligence
Multi-family units
County records classify this as Multi-Family (2-4 Unit). Listing-text estimate: 4 units. confirmed
Listing remarks
Located in the heart of Brooklyn's desirable Bensonhurst/Bath Beach area, this well-maintained 4-family property offers a prime investment opportunity surrounded by local shops, restaurants, cafés, parks, and everyday conveniences. * * No leases * * This property offers spacious apartments with eat in kitchens. Shared driveway. Full finished basement. Easy access to public transportation. Downtown Manhattan is approximately 25 minutes away and Midtown about 40 minutes, making this an ideal location for both convenience and connectivity. A perfect blend of neighborhood charm, strong rental appeal, and classic Brooklyn living.
Key facts
- Parks
- Restaurants
- Local shops
Tags
Property features AI
Finance
- Other: Lot size approximately 0.04 acres
- Financial info: Tenants pay electricity and gas
Exterior
- Parking: Driveway with space for 2 vehicles
- Utilities: Public water; Public sewer
- Home design: Quadruplex (4-unit multi-family property); Living area approximately 3,040 total square feet
- Construction: Brick construction
- Exterior features: Rubber roof; Other exterior features
Interior
- Bedrooms: Unit mix includes one 1-bedroom unit and three 2-bedroom units
- Flooring: Tile flooring; Hardwood flooring
- Bathrooms: Four full bathrooms (located across first and second floors)
- Heating & cooling: Hot water heating; Radiant heating; Window air conditioning units
- Interior features: Finished full basement; Tile and hardwood flooring
Neighborhood map
What this means for you Summary
Snapshot
- This is a 4 × 7-bed/4.0-bath units multifamily listed at $1.90M. Condition is rated fair.
Deal economics
- At list price, monthly cash flow is $2k ($24k/yr) — positive. Per door: $496/mo.
- The deal already cash-flows at list — no discount required.
- Meets the 1% rule at list price ($19k rent vs $1.90M).
- Recommended offer: $1.87M (1.5% below list) — sets the bar for market timing.
- Cap rate 7.5% vs local median 2.6% in New York — top-decile yield for the area; either an underpriced asset or a hidden risk that comps aren't pricing in. Stress-test before assuming the spread holds.
Location & tenants
- Location reads 75/100 on livability (#268 in NY, #4,188 nationally) — a middle-class / working-renter tenant base. Strengths: amenities A+, commute A+, health & safety A; Watch: crime F, cost of living F.
- Zoned schools: Ps 101 Verrazano (The) (math 77% / reading 87%, grade A+, #138 of 2,108 statewide, top 8%, 1,057 students, 67% FRL); Is 98 Bay Academy (math 96% / reading 96%, grade A+, #2 of 729 statewide, top 0%, 1,488 students, 63% FRL); Midwood High School (math 94% / reading 96%, grade A+, #83 of 1,100 statewide, top 8%, 4,062 students, 73% FRL).
- Market conditions: Rents rising fast (+5.7%/yr); 250 active listings in the ZIP; high-income renter base; 10,063 units permitted in Kings County in 2024 (9,789 in 5+ unit buildings).
- At $19,125/mo this rent would consume 123% of the median local household income ($186k/yr) (locally 2372% of renters already pay >50% of income on rent) — very limited rent-growth headroom before tenants either downsize or default.
Forward outlook
- In year one you build about $203k of equity ($13k loan paydown + $190k appreciation (10.0% local appreciation)).
- Kings County population projected at +13% by 2050 — modest demand growth; plan on rents tracking national, not racing it.
- At projected returns (10.0% appreciation + 5.7% rent growth), your $532k cash investment doubles in ~3 years — after that, you're playing with house money.
- By year 2, paydown + projected appreciation supports a ~$326k cash-out refi (75% LTV) — recoverable capital for the next deal without selling this one.
Negotiation context
- It's been on market 15 days — a 2% lower offer ($1.87M) is reasonable based on typical stale-listing flexibility.
Risks & watch-outs
- Watch-outs: built in 1925 — expect roof / HVAC / electrical / plumbing capex.
- Climate carrying-cost: major wind risk, 68% chance of damaging wind over 30y; extreme-heat days projected 7→16/yr by 2055 (HVAC capex compounding) — expect insurance premiums to compound above CPI over the hold.
Questions for the listing agent
- Can we see the unit-by-unit rent roll, current vacancy, and any below-market leases? What's the average tenancy length?
- What capital expenditures (roof, boiler, parking lot, exteriors) have been made in the last 5 years, and what's planned in the next 2?
- Have any recent inspections been done? Can we get a copy of the seller's disclosures and any deferred-maintenance estimates?
- Built in 1925 — when were the roof, HVAC, electrical panel, plumbing, and water heater last replaced?
- Is there a deadline driving the sale (1031 exchange, divorce, estate, relocation)? That informs how much negotiation room exists.
- Schools are B-rated — typically a magnet for longer-tenancy family renters. What's the average tenant stay here, and is there a school-zone premium baked into asking?
- Crime grade is F in this area — have there been break-ins, vandalism, or insurance claims at this property in the last 3 years? What carrier currently insures it and at what premium?
- What's the average days-on-market for RENTAL listings here right now (not sales)? A rising rental-DOM trend means longer vacancies and softer asking-rent achievability than the comps imply.
- What's the recent tenant-quality profile in this submarket — average credit score on applications, eviction rate, late-payment / NSF rate, and stable-employment percentage? A property-management company in the area should have these aggregated.
- How much new apartment / multifamily construction is in the pipeline within 1–3 miles? Heavy new supply (>2% of stock underway) typically softens rents 12–24 months out; light construction supports rent growth.
Investment metrics
- 1% rule
- 1.01% ✓
- Cap rate
- 7.55%
- Cash-on-cash
- 4.48%
- DSCR
- 1.20
- GRM
- 8.3
CMA / ARV
No comps found within radius.
Projected returns pro-forma
10.0% appreciation · 5.67% rent growth · sell at horizon
- IRR
- 28.6%
- Equity multiple
- 3.28×
- Total profit
- $1,213,720
- Equity at exit
- $1,710,770
- IRR
- 25.7%
- Equity multiple
- 7.76×
- Total profit
- $3,594,587
- Equity at exit
- $3,689,339
Cash invested: $531,720 (down + closing). Projections, not guarantees.
Landlord ↔ Tenant lean methodology
- Overall (CITY)
- 0 Strongly Tenant-Friendly
- State New York
- 15 Strongly Tenant-Friendly · D+10
- County
- — inherits STATE
- City New York
- 0 Strongly Tenant-Friendly · D+34
ZIP-level market 11215
- Home prices YoY
- 2.7%
- Rents YoY
- 5.7%
- Active inventory
- 250
- Price-to-rent
- 33.1×
Monthly cashflow live
- Estimated rent
- $19,125 medium interval (Pro) →
- Mortgage (P&I)
- −$9,959
- Tax est. 1.5%
- −$2,374 /mo · $28,485/yr
- Insurance
- −$791
- HOA
- −$0
- Vacancy / Maint / Mgmt
- −$4,016
- Net cashflow
- $1,985
Break-even live
Sensitivity live
| Price | -10% $3,298 | -5% $2,641 | +0% $1,985 | +5% $1,329 | +10% $673 |
|---|---|---|---|---|---|
| Rent | -10% $474 | -5% $1,230 | +0% $1,985 | +5% $2,741 | +10% $3,496 |
| Rate | -1.0pp $2,942 | -0.5pp $2,468 | base $1,985 | +0.5pp $1,493 | +1.0pp $992 |
4-unit breakdown (identical units grouped — click to expand)
| Units | Beds | Baths | Est. rent |
|---|---|---|---|
| 4× units | 7 | 4 | $19,124 |
| #1 | 7 | 4 | $4,781 |
| #2 | 7 | 4 | $4,781 |
| #3 | 7 | 4 | $4,781 |
| #4 | 7 | 4 | $4,781 |
| Total (4 units) | $19,125 | ||
UW: 25.0% down · 7.5% · 30yr · 1.5% tax · 5.0% vac · 8.0% maint · 8.0% mgmt
Financing live
Cash to close
- Down payment
- $474,750
- Closing costs
- $56,970
- Reserves months
- —
- Total cash needed
- —
Loan-product check · same deal, 3 products live
Conventional
25% down · 7.5% · 30yr
- Down + closing
- —
- Monthly P&I
- —
- Monthly cashflow
- —
- DSCR
- —
- Eligible?
- —
Personal DTI + credit; lowest rate.
DSCR
20% down · 8.5% · 30yr
- Down + closing
- —
- Monthly P&I
- —
- Monthly cashflow
- —
- DSCR
- —
- Eligible?
- —
No personal income docs; deal must DSCR.
Hard money
10% down · 12.0% · 12mo
- Down + closing
- —
- Monthly P&I
- —
- Monthly cashflow
- —
- DSCR
- —
- Eligible?
- —
Short-term bridge; refi at stabilization.
Listing history 1 events
-
2026-05-11$1,899,000 Active
ⓘ Source: listings_history table (triggers on properties + properties_extension) + one-shot
backfill from property_details.listing_events for pre-trigger history.
Climate risk First Street
- Flood 4/10 Moderate FEMA zone X (unshaded) · 13% chance over 30 yrs
- Wildfire 1/10 Low
- Heat 7/10 Severe 7 d/yr ≥97°F today · 16 d/yr by 30 yrs out
- Wind 6/10 Major 68% chance of damaging wind over 30 yrs
- Air quality 4/10 Moderate 5 unhealthy d/yr today · 7 by 30 yrs out
Nearby sold comps map
Loading sold comps map…
Walkable amenities ~0.75 mi
Loading nearby amenities…
Taxation est. · year 1
- Rental income
- $229,500
- − Mortgage interest
- −$106,374
- − Property taxes
- −$28,485
- − Insurance
- −$9,495
- − Repairs & maintenance
- −$18,360
- − Management
- −$18,360
- − Depreciation
- −$55,244
- Taxable loss
- −$6,817
- Est. tax savings @ 24.0%
- +$1,636
- After-tax cash flow
- $25,458/yr
For passive investors: Depreciation is non-cash, so a rental often shows a tax loss while cash-flowing — sheltering income. Rental losses are passive: they offset passive income freely, and up to $25,000/yr can offset ordinary (W-2) income if you actively participate and your MAGI is under $100k (phasing out to $0 by $150k); unused losses carry forward. On sale, claimed depreciation is recaptured at up to 25%, and gains may owe capital-gains tax (a 1031 exchange can defer both). Figures are a year-1 estimate at your 24.0% rate — not tax advice; consult a CPA.
Condition & rehab AI · 9 photos
This 4-family property in Bensonhurst/Bath Beach requires moderate repairs and maintenance, particularly in the exterior and landscaping, to improve its condition and value.
Repairs flagged
- Moderate Exterior repainting — The brick facade shows signs of discoloration and needs repainting.
- Minor Landscaping — The minimal landscaping could be improved with some additional plants and shrubs.
Value-add opportunities
- Both Exterior repainting — Repainting the exterior will improve the curb appeal and potentially increase both resale and rental value.
- Both Landscaping — Enhancing the landscaping will improve the overall appearance and potentially increase both resale and rental value.
Renovation cost estimate screening
| Repair item | Severity | Est. cost |
|---|---|---|
| Exterior repainting · The brick facade shows signs of discoloration and needs repainting. | Moderate | $3,000–15,000 |
| Landscaping · The minimal landscaping could be improved with some additional plants and shrubs. | Minor | $500–3,000 |
| Total estimated repair cost · 2 items | $3,500–18,000 |
Value-add ROI direction
- Both Exterior repainting — Repainting the exterior will improve the curb appeal and potentially increase both resale and rental value. ↑
- Both Landscaping — Enhancing the landscaping will improve the overall appearance and potentially increase both resale and rental value. ↑
ⓘ Cost ranges are severity-bucket heuristics (US national rule-of-thumb). Get contractor quotes + a written scope before underwriting a rehab budget.
Schools (NCES district)
No district data.
Livability — New York
- Score
- 75/100
- State rank
- #268
- US rank
- #4188
Category grades
Schools grade is shown separately in the Schools card above.
Census & demographics
- Census place
- New York, NY
- County
- Kings County · 2,614,986 people
- City population
- 7,731,280
- Metro
- New York-Newark-Jersey City, NY-NJ-PA
- Population (ZIP)
- 70,441
- Household income
- $185,865
- Rent vs Own
- Severe rent burden
- 2372.0
Population outlook (Kings County) Hauer SSP2
- Today (2025)
- 2,847,441 people
- By 2030
- 2,937,006 · +3.1%
- By 2040
- 3,095,491 · +8.7%
- By 2050
- 3,228,968 · +13.4%
- By 2075
- 3,321,723 · +16.7%
- By 2100
- 3,111,387 · +9.3%
Race, ethnicity, and origin ACS 2023
- Neighborhood character
- Predominantly White (67%)
- Race & ethnicity
- White 67% Hispanic / Latino 15% Two or more races 11% Asian 9% Black 3%
- Hispanic origin (detail)
- Mexican 3% Puerto Rican 3%
- Common ancestry
- Romanian 5% Scotch-Irish 5% Italian 3%
- Foreign-born
- 18% · Canada, China, Jamaica
- Languages at home
- 76% English-only · Spanish 9% Other Indo-European 4% Chinese 2%
Political lean MEDSL · Kings
- 2024 margin
- Solid D (+44.0) · D 72.0% · R 28.0%
- 2008→2024 swing
- -15.5pp toward R · 2008: 59.4pp · 2024: 44.0pp
- All cycles
- 2024: D+44.0 2020: D+54.8 2016: D+61.8 2012: D+63.9 2008: D+59.4
Not yet ingested
- Civics
- —
Market trends
- HPI YoY
- ▲ 11.03%
- Current HPI
- 417.4151
- Rent YoY
- ▲ 5.67%
- Metro
- New York-Newark-Jersey City, NY-NJ-PA
- State GDP YoY
- ▲ 2.60%
- F500 in state
- 92
Industry mix (Fortune 500 HQ in NY)
| Industry | F500 HQs | Revenue |
|---|---|---|
| Financial Services | 10 | $950B |
|
||
| Consumer Goods | 9 | $162B |
|
||
| Insurance | 4 | $225B |
|
||
| Telecommunications | 2 | $144B |
|
||
| Pharmaceuticals | 2 | $112B |
|
||
| Media / Entertainment | 2 | $69B |
|
||
Price history
1 event — show timeline
- 2026-05-11 Listed $1,899,000 Global MLS
Cash-flow waterfall
monthlySold comps — $/sqft
last 12 mo · ≤1 miLoading sold comps…