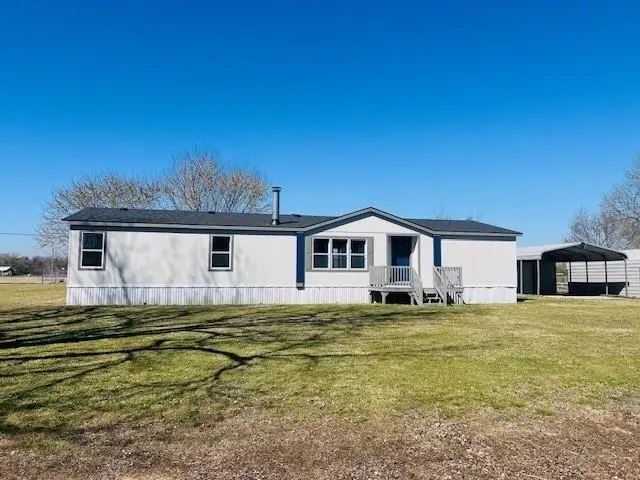
937 N Oak · Jennings, OK
Flood risk 1/10 · Minimal
- FEMA flood zone
- —
- Chance of flooding over 30 yrs
- 0.0%
- Est. flood insurance / yr
- —
Fire risk 7/10 · Major
- Est. fire insurance / yr
- $2,463 – $4,575
Heat risk 5/10 · Moderate
- Hot days now (above 110°F)
- 7 days/yr
- Hot days in 30 yrs
- 19 days/yr
Wind risk 2/10 · Minimal
- Chance of severe wind over 30 yrs
- 3.0%
Air-quality risk 2/10 · Minimal
- Unhealthy air days now
- 1 days/yr
- Unhealthy air days in 30 yrs
- 1 days/yr
Risk factors via First Street. Map © Google.
Why this score? — see what drove the C- grade
The composite is a weighted blend of 9 inputs, each scored 0–100. Each bar is that input's sub-score; the figure is the points it added to the 100-point composite (weight × sub-score).
- Cash flow +15.8/30.0
- ARV discount +10.0/15.0
- Appreciation +5.0/10.0
- DSCR +4.9/10.0
- 1% rule +4.3/10.0
- Livability +3.2/5.0
- Schools +2.6/10.0
- Rent growth +2.5/5.0
- Condition / age +2.5/5.0
$150,000
🖨 Deal sheet 📄 Offer letter ✓ Due diligence
Listing remarks
Gorgeous 4 bedroom, 2 ½ bath home located on corner lot in Jennings, OK. The home is 2007 Solitaire, that has been upscaled remodeled. This home has all the latest and greatest home trends that will sure to fit everyones taste and budget. It has all new AC, Flooring, only 1 year roof, new back porch, all new lighting, new paint inside and out. This is located on corner lot on North side of town. Lot consist of 2 ½ lots, and has 20x20 carport with storage in back, and big storm cellar in the backyard. The home has city utilities with OG & E Electric. Close to turnpike 412, so easy access for Tulsa, and Stillwater. The floor plan is split floor plan with primary on one side
Key facts
- 0.23 acre lot
- 2 garage spots
- Built 2007
Property features AI
Exterior
- Parking: Detached 2-car garage
- Utilities: Public water; Public sewer
- Home design: Single family residence; Residential property
- Exterior features: Composition roof; Gravel road access; Lot approximately 100 x 100
Interior
- Bathrooms: 2 full bathrooms; 1 half bathroom
- Heating & cooling: Central air conditioning; Forced air heating; Electric heating
- Interior features: Kitchen island; Living room fireplace
Neighborhood map
What this means for you Summary
Snapshot
- This is a 4-bed/2.5-bath single-family listed at $150k.
Deal economics
- At list price, monthly cash flow is $68 ($810/yr) — positive.
- The deal already cash-flows at list — no discount required.
- To meet the 1% rule (rent ≥ 1% of price), the offer needs to be $140k (6.8% below list).
- Recommended offer: $140k (6.8% below list) — sets the bar for 1% rule.
Location & tenants
- Location reads 64/100 on livability (#182 in OK) — a middle-class / working-renter tenant base. Strengths: crime A+, cost of living A+, housing A+; Watch: schools F, amenities F, commute F.
- Jennings (rural): math 20% / reading 35% proficiency, ranked #312 of 513 in OK (top 61%) — low school quality limits family demand, transient renter base, plan for 1-2y turnover; 74% free/reduced lunch — lower-income household profile, screen leases tightly.
- Market conditions: 25 active listings in the ZIP; 3 units permitted in Pawnee County in 2024 (0 in 5+ unit buildings).
Forward outlook
- In year one you build about $6k of equity ($1k loan paydown + $4k appreciation (3.0% local appreciation)).
- Pawnee County population projected to shrink 4% by 2050 — rents likely to lag national; underwrite the cash flow, not the appreciation.
- At projected returns (3.0% appreciation + 3.0% rent growth), your $42k cash investment doubles in ~6 years — after that, you're playing with house money.
- By year 7, paydown + projected appreciation supports a ~$35k cash-out refi (75% LTV) — recoverable capital for the next deal without selling this one.
Negotiation context
- It's been on market 84 days — a 6% lower offer ($141k) is reasonable based on typical stale-listing flexibility.
Risks & watch-outs
- Climate carrying-cost: major wildfire risk; extreme-heat days projected 7→19/yr by 2055 (HVAC capex compounding) — expect insurance premiums to compound above CPI over the hold.
Questions for the listing agent
- It's been on market 84 days. Have you received any prior offers? Is the seller open to a 7% concession, seller financing, or rate buy-down credit?
- Why hasn't it sold? Are there any deal-killer items the seller is aware of (foundation, flood, title, zoning, code violations)?
- Is there a deadline driving the sale (1031 exchange, divorce, estate, relocation)? That informs how much negotiation room exists.
- Schools are F-rated, which usually means shorter tenancies and higher turnover. Who's the typical renter profile here, and what's been the actual vacancy rate?
- What's the average days-on-market for RENTAL listings here right now (not sales)? A rising rental-DOM trend means longer vacancies and softer asking-rent achievability than the comps imply.
- What's the recent tenant-quality profile in this submarket — average credit score on applications, eviction rate, late-payment / NSF rate, and stable-employment percentage? A property-management company in the area should have these aggregated.
- How much new for-sale + rental construction is in the pipeline within 1–3 miles? Heavy new supply typically softens prices + rents 12–24 months out; constrained supply supports both.
Investment metrics
- 1% rule
- 0.93% ✗
- Cap rate
- 6.83%
- Cash-on-cash
- 1.93%
- DSCR
- 1.09
- GRM
- 8.9
CMA / ARV
- ARV (on-the-fly)
- $158,954
- Comps found
- 1
Show comp detail 1 sale within ~0.75 mi
| Address | Dist | Beds/Ba | Sqft | Sold | Price | $/sf | Match |
|---|---|---|---|---|---|---|---|
| 171 3rd St | 0.47mi | 3/2.5 (-1) | 1,830 (+2%) | 4mo | $162,500 | $89 | 65 |
Match score weights: distance 35% · size 25% · config 20% · recency 20%. Top-matched comps best support the ARV.
Projected returns pro-forma
3.0% appreciation · 3.0% rent growth · sell at horizon
- IRR
- 9.3%
- Equity multiple
- 1.53×
- Total profit
- $22,391
- Equity at exit
- $67,446
- IRR
- 11.8%
- Equity multiple
- 2.76×
- Total profit
- $73,735
- Equity at exit
- $103,943
Cash invested: $42,000 (down + closing). Projections, not guarantees.
Landlord ↔ Tenant lean methodology
- Overall (STATE)
- 83 Strongly Landlord-Friendly
- State Oklahoma
- 83 Strongly Landlord-Friendly · R+20
- County
- — inherits STATE
- City
- — inherits STATE
ZIP-level market 74038
- Active inventory
- 25
- Price-to-rent
- 8.9×
Monthly cashflow live
- Estimated rent
- $1,398 medium interval (Pro) →
- Mortgage (P&I)
- −$787
- Tax est. 1.5%
- −$188 /mo · $2,250/yr
- Insurance
- −$62
- HOA
- −$0
- Vacancy / Maint / Mgmt
- −$294
- Net cashflow
- $68
Break-even live
UW: 25.0% down · 7.5% · 30yr · 1.5% tax · 5.0% vac · 8.0% maint · 8.0% mgmt
Financing live
Cash to close
- Down payment
- $37,500
- Closing costs
- $4,500
- Reserves months
- —
- Total cash needed
- —
Loan-product check · same deal, 3 products live
Conventional
25% down · 7.5% · 30yr
- Down + closing
- —
- Monthly P&I
- —
- Monthly cashflow
- —
- DSCR
- —
- Eligible?
- —
Personal DTI + credit; lowest rate.
DSCR
20% down · 8.5% · 30yr
- Down + closing
- —
- Monthly P&I
- —
- Monthly cashflow
- —
- DSCR
- —
- Eligible?
- —
No personal income docs; deal must DSCR.
Hard money
10% down · 12.0% · 12mo
- Down + closing
- —
- Monthly P&I
- —
- Monthly cashflow
- —
- DSCR
- —
- Eligible?
- —
Short-term bridge; refi at stabilization.
Listing history 15 events
-
2026-06-18days on market $150,000 Active 84 DOM
-
2026-06-17days on market $150,000 Active 83 DOM
-
2026-06-16days on market $150,000 Active 82 DOM
-
2026-06-15days on market $150,000 Active 81 DOM
-
2026-06-13days on market $150,000 Active 79 DOM
-
2026-06-12days on market $150,000 Active 78 DOM
-
2026-06-09days on market $150,000 Active 75 DOM
-
2026-06-08days on market $150,000 Active 74 DOM
-
2026-06-08days on market $150,000 Active 73 DOM
-
2026-06-05pricedays on market $150,000 Active 71 DOM
-
2026-06-04days on market $155,000 Active 69 DOM
-
2026-06-02days on market $155,000 Active 68 DOM
-
2026-06-01days on market $155,000 Active 67 DOM
-
2026-05-31days on market $155,000 Active 66 DOM
-
2026-03-24$155,000 Active
ⓘ Source: listings_history table (triggers on properties + properties_extension) + one-shot
backfill from property_details.listing_events for pre-trigger history.
Climate risk First Street
- Flood 1/10 Low 0% chance over 30 yrs
- Wildfire 7/10 Severe
- Heat 5/10 Major 7 d/yr ≥110°F today · 19 d/yr by 30 yrs out
- Wind 2/10 Low 3% chance of damaging wind over 30 yrs
- Air quality 2/10 Low 1 unhealthy d/yr today · 1 by 30 yrs out
Nearby sold comps map
Loading sold comps map…
Walkable amenities ~0.75 mi
Loading nearby amenities…
Taxation est. · year 1
- Rental income
- $16,772
- − Mortgage interest
- −$8,402
- − Property taxes
- −$2,250
- − Insurance
- −$750
- − Repairs & maintenance
- −$1,342
- − Management
- −$1,342
- − Depreciation
- −$4,364
- Taxable loss
- −$1,678
- Est. tax savings @ 24.0%
- +$403
- After-tax cash flow
- $1,213/yr
For passive investors: Depreciation is non-cash, so a rental often shows a tax loss while cash-flowing — sheltering income. Rental losses are passive: they offset passive income freely, and up to $25,000/yr can offset ordinary (W-2) income if you actively participate and your MAGI is under $100k (phasing out to $0 by $150k); unused losses carry forward. On sale, claimed depreciation is recaptured at up to 25%, and gains may owe capital-gains tax (a 1031 exchange can defer both). Figures are a year-1 estimate at your 24.0% rate — not tax advice; consult a CPA.
Schools (NCES district)
- District
- Jennings
- NCES district ID
- 4015750
- Math proficiency
- 20% ▼ -5.00%
- Reading proficiency
- 35% ▲ 5.00%
- Median HH income
- $35,901
- Composite
- 25.69/100
- National rank
- #12812
- State rank
- #312 of 513 in OK
Livability — Jennings
- Score
- 64/100
- State rank
- #182
- US rank
- #14467
Category grades
Schools grade is shown separately in the Schools card above.
Census & demographics
- Census place
- Jennings, OK
- Population (ZIP)
- 2,204
Population outlook (Pawnee County) Hauer SSP2
- Today (2025)
- 16,219 people
- By 2030
- 16,028 · -1.2%
- By 2040
- 15,724 · -3.1%
- By 2050
- 15,563 · -4.0%
- By 2075
- 15,905 · -1.9%
- By 2100
- 16,058 · -1.0%
Race, ethnicity, and origin ACS 2023
- Neighborhood character
- Predominantly White (79%)
- Race & ethnicity
- White 79% Two or more races 10% Native American 8% Pacific Islander 2% Hispanic / Latino 1%
- Common ancestry
- Slovak 4% Romanian 3% Iranian 1%
- Foreign-born
- 2%
- Languages at home
- 98% English-only · Other Asian/Pacific 1% Spanish 0%
Political lean MEDSL · Pawnee
- 2024 margin
- Solid R (+58.9) · D 19.7% · R 78.6% · Other 1.7%
- 2008→2024 swing
- -21.4pp toward R · 2008: -37.4pp · 2024: -58.9pp
- All cycles
- 2024: R+58.9 2020: R+57.5 2016: R+53.2 2012: R+40.0 2008: R+37.4
Not yet ingested
- Civics
- —
Market trends
- HPI YoY
- —
- Current HPI
- —
- Rent YoY
- —
- Metro
- —
- State GDP YoY
- ▲ 1.55%
- F500 in state
- 6
Industry mix (Fortune 500 HQ in OK)
| Industry | F500 HQs | Revenue |
|---|---|---|
| Energy | 3 | $48B |
|
||
Price history
1 event — show timeline
- 2026-03-24 Listed $155,000 SBOR
Property tax history
+1.4%/yrLatest (2025): $14 · +7.7% YoY. Source: county tax records.
Cash-flow waterfall
monthlySold comps — $/sqft
last 12 mo · ≤1 miLoading sold comps…