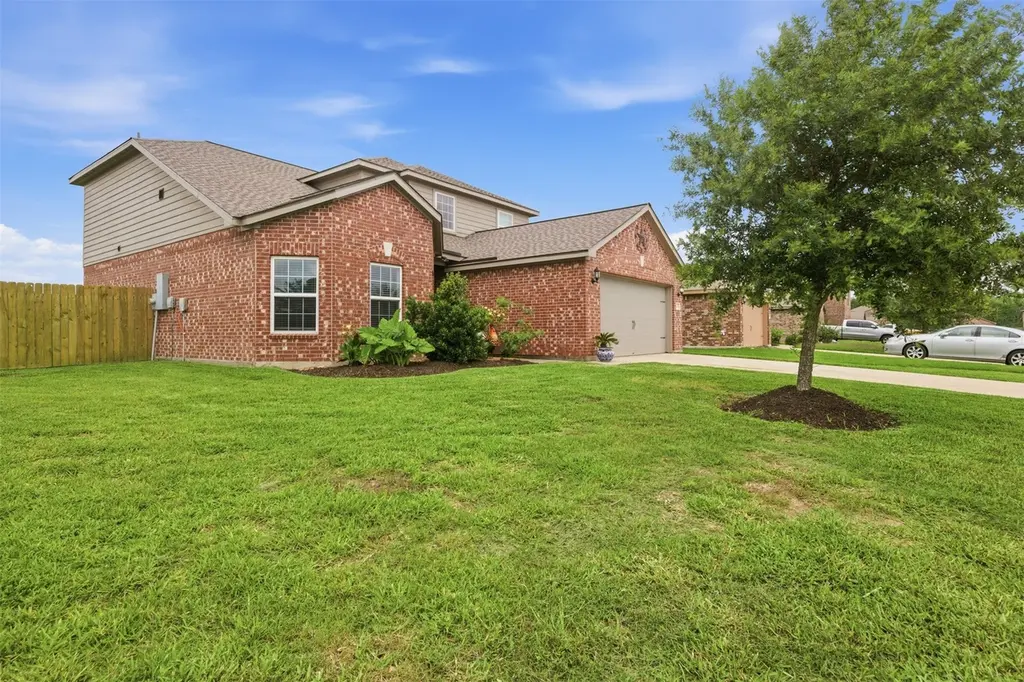
1130 Hinged Opal Dr · Iowa Colony, TX
Flood risk 1/10 · Minimal
- FEMA flood zone
- X (unshaded)
- Chance of flooding over 30 yrs
- 0.0%
- Est. flood insurance / yr
- $507 – $1,088
Fire risk 5/10 · Moderate
- Est. fire insurance / yr
- $1,222 – $2,270
Heat risk 9/10 · Severe
- Hot days now (above 110°F)
- 7 days/yr
- Hot days in 30 yrs
- 23 days/yr
Wind risk 9/10 · Severe
- Chance of severe wind over 30 yrs
- 99.0%
Air-quality risk 2/10 · Minimal
- Unhealthy air days now
- 1 days/yr
- Unhealthy air days in 30 yrs
- 2 days/yr
Risk factors via First Street. Map © Google.
Why this score? — see what drove the D grade
The composite is a weighted blend of 9 inputs, each scored 0–100. Each bar is that input's sub-score; the figure is the points it added to the 100-point composite (weight × sub-score).
- Cash flow +10.6/30.0
- ARV discount +8.4/15.0
- 1% rule +5.4/10.0
- Condition / age +4.0/5.0
- Schools +3.9/10.0
- Livability +3.2/5.0
- DSCR +3.1/10.0
- Rent growth +2.6/5.0
- Appreciation +0.0/10.0
$269,000
🖨 Deal sheet 📄 Offer letter ✓ Due diligence
Listing remarks
Spacious and inviting, this beautiful 2-story home offers 4 bedrooms, 2.5 baths sits on a huge corner lot and boasts an open-concept floor plan designed for comfortable everyday living and entertaining. The main living area flows seamlessly into the kitchen and dining space, creating the perfect gathering place for family and friends. Huge private primary suite featuring large primary bath and plenty of room to spread out. Upstairs, you’ll find generously sized bedrooms along with plenty of space to relax and unwind. With abundant natural light, functional living spaces, and a layout that balances openness with privacy, this home is ready to fit a variety of lifestyles. Enjoy the conv
Key facts
- 0.25 acre lot
- 2 garage spots
- Built 2020
Property features AI
Finance
- HOA & community: Sterling Lakes POA; Gated community amenity; Annual association fee of $1,200
Exterior
- Parking: Attached 2-car garage; Attached garage
- Security: Gated community
- Utilities: Public water; Public sewer
- Home design: Residential property; Entry level primary bedroom; Built in 2020
- Construction: Brick and cement siding exterior; Composition roof; Slab foundation
- Exterior features: Deck; Patio; Private yard; Fenced backyard (partial); Corner lot; Concrete road surface
Interior
- Kitchen: Dishwasher; Electric oven; Electric range; Free-standing range; Microwave; Garbage disposal
- Bedrooms: Primary bedroom on the first floor (19 x 14); Bedroom on the second floor (16 x 14); Bedroom on the second floor (16 x 13); Bedroom on the second floor (12 x 12)
- Flooring: Carpet; Plank; Vinyl
- Bathrooms: 2 full bathrooms; 1 half bathroom; Primary bathroom on the first floor (11 x 10); Upstairs bathroom (12 x 7)
- Heating & cooling: Central heating (electric); Central air conditioning (electric)
- Interior features: Breakfast bar; Granite counters; Pantry
- Laundry & utility: Washer hookup; Electric dryer hookup
Neighborhood map
What this means for you Summary
Snapshot
- This is a 4-bed/2.5-bath single-family listed at $269k. Condition is rated good.
Deal economics
- At list price, monthly cash flow is $-134 ($-2k/yr) — negative.
- To cash-flow at today's rent, offer at most $245k (8.8% below list).
- Meets the 1% rule at list price ($3k rent vs $269k).
- Recommended offer: $245k (8.8% below list) — sets the bar for cash-flow.
- Cap rate 5.7% vs local median 4.2% in Iowa Colony — top-decile yield for the area; either an underpriced asset or a hidden risk that comps aren't pricing in. Stress-test before assuming the spread holds.
Location & tenants
- Location reads 64/100 on livability (#757 in TX) — a middle-class / working-renter tenant base. Strengths: crime A+, employment A+, cost of living A+; Watch: amenities F, commute F, health & safety F.
- Alvin ISD (suburban): math 39% / reading 48% proficiency, ranked #255 of 826 in TX (top 31%) — families likely to look elsewhere, expect single-tenant / working-renter base with shorter leases.
- Zoned schools: Iowa Colony H S (792 students, 56% FRL).
- Market conditions: Rents flat; 1139 active listings in the ZIP; 22 comparable units currently listed for rent nearby; rentals at typical pace (median 22d on market — plan ~3-4 weeks tenant-placement turnaround); 45% of comp listings sitting > 30 days — soft ceiling on asking rent; high-income renter base; 3,960 units permitted in Brazoria County in 2024 (593 in 5+ unit buildings).
Forward outlook
- Local home prices are declining (-3.0%/yr); year-one equity from $2k of loan paydown is wiped out by about $8k of value loss. Plan a longer hold.
- Brazoria County population projected at +44% by 2050 — long-run rental-demand tailwind backs the buy-and-hold thesis.
Negotiation context
- It's been on market 36 days — a 3% lower offer ($261k) is reasonable based on typical stale-listing flexibility.
Risks & watch-outs
- Watch-outs: property tax is 3.2% of price.
- Climate carrying-cost: severe wind risk, 99% chance of damaging wind over 30y; moderate wildfire risk; extreme-heat days projected 7→23/yr by 2055 (HVAC capex compounding) — expect insurance premiums to compound above CPI over the hold.
Questions for the listing agent
- What do current leases actually rent for vs. the listed asking? Can we see a recent rent roll and the last 12 months of T-12 income?
- It's been on market 36 days. Have you received any prior offers? Is the seller open to a 9% concession, seller financing, or rate buy-down credit?
- Property tax is high relative to price — has the assessment been appealed recently, and will the sale trigger a re-assessment?
- What does the HOA fee cover, when was the last increase, and are there any pending special assessments or reserve-fund shortfalls?
- Is there a deadline driving the sale (1031 exchange, divorce, estate, relocation)? That informs how much negotiation room exists.
- Schools are F-rated, which usually means shorter tenancies and higher turnover. Who's the typical renter profile here, and what's been the actual vacancy rate?
- The area grade is low — what's the realistic commute time and amenity access for the typical tenant pool here? Any planned neighborhood developments (good or bad) we should know about?
- What's the average days-on-market for RENTAL listings here right now (not sales)? A rising rental-DOM trend means longer vacancies and softer asking-rent achievability than the comps imply.
- What's the recent tenant-quality profile in this submarket — average credit score on applications, eviction rate, late-payment / NSF rate, and stable-employment percentage? A property-management company in the area should have these aggregated.
- How much new for-sale + rental construction is in the pipeline within 1–3 miles? Heavy new supply typically softens prices + rents 12–24 months out; constrained supply supports both.
Investment metrics
- 1% rule
- 1.04% ✓
- Cap rate
- 5.70%
- Cash-on-cash
- -2.13%
- DSCR
- 0.91
- GRM
- 8.0
CMA / ARV
- ARV (median comp)
- $274,601
- List price
- $269,000
- Delta
- -2.04%
- Verdict
- FAIR
- Comps
- 20 within 1.0 mi
Show comp detail 12 sales within ~0.75 mi
| Address | Dist | Beds/Ba | Sqft | Sold | Price | $/sf | Match |
|---|---|---|---|---|---|---|---|
| 9715 Blue Sapphire Dr | 0.36mi | 4/2.5 | 2,121 (0%) | 0mo | $272,500 | $128 | 83 |
| 9114 Serene Hvn | 0.64mi | 4/3.0 | 2,042 (-4%) | 1mo | $352,865 | $173 | 61 |
| 9111 Serene Haven Dr | 0.67mi | 4/2.0 | 2,035 (-4%) | 1mo | $319,490 | $157 | 59 |
| 1419 Splashing Wave Dr | 0.68mi | 4/2.0 | 2,031 (-4%) | 1mo | $319,990 | $158 | 59 |
| 9007 Serene Hvn | 0.70mi | 4/3.0 | 2,042 (-4%) | 2mo | $356,865 | $175 | 58 |
| 1507 Shimmering Ocean Way | 0.73mi | 4/3.0 | 2,042 (-4%) | 1mo | $354,490 | $174 | 57 |
| 1522 Shimmering Ocean Way | 0.74mi | 4/3.0 | 2,042 (-4%) | 1mo | $331,000 | $162 | 56 |
| 1523 Splashing Wave Dr | 0.73mi | 4/2.0 | 2,031 (-4%) | 0mo | $349,490 | $172 | 56 |
| 10513 Mount Tallac Ct | 0.72mi | 4/2.5 | 2,003 (-6%) | 3mo | $339,900 | $170 | 55 |
| 1406 Angelfish Dr | 0.74mi | 4/2.0 | 2,031 (-4%) | 3mo | $344,490 | $170 | 54 |
| 9107 Serene Hvn | 0.68mi | 4/2.5 | 2,322 (+10%) | 2mo | $355,865 | $153 | 51 |
| 10430 Sherwin Pass Dr | 0.66mi | 4/3.0 | 1,924 (-9%) | 3mo | $279,900 | $145 | 49 |
Match score weights: distance 35% · size 25% · config 20% · recency 20%. Top-matched comps best support the ARV.
Projected returns pro-forma
-3.0% appreciation · 0.44% rent growth · sell at horizon
- IRR
- -23.4%
- Equity multiple
- 0.22×
- Total profit
- $-58,774
- Equity at exit
- $40,109
- IRR
- -30.2%
- Equity multiple
- -0.17×
- Total profit
- $-88,078
- Equity at exit
- $23,258
Cash invested: $75,320 (down + closing). Projections, not guarantees.
Landlord ↔ Tenant lean methodology
- Overall (STATE)
- 87 Strongly Landlord-Friendly
- State Texas
- 87 Strongly Landlord-Friendly · R+5
- County
- — inherits STATE
- City
- — inherits STATE
ZIP-level market 77583
- Rents YoY
- 0.4%
- Active inventory
- 1139
- Price-to-rent
- 8.0×
Monthly cashflow live
- Estimated rent
- $2,787 high interval (Pro) →
- Mortgage (P&I)
- −$1,411
- Tax from tax record
- −$713 /mo · $8,554/yr
- Insurance
- −$112
- HOA
- −$100
- Vacancy / Maint / Mgmt
- −$585
- Net cashflow
- $-134
Break-even live
UW: 25.0% down · 7.5% · 30yr · 1.5% tax · 5.0% vac · 8.0% maint · 8.0% mgmt
Financing live
Cash to close
- Down payment
- $67,250
- Closing costs
- $8,070
- Reserves months
- —
- Total cash needed
- —
Loan-product check · same deal, 3 products live
Conventional
25% down · 7.5% · 30yr
- Down + closing
- —
- Monthly P&I
- —
- Monthly cashflow
- —
- DSCR
- —
- Eligible?
- —
Personal DTI + credit; lowest rate.
DSCR
20% down · 8.5% · 30yr
- Down + closing
- —
- Monthly P&I
- —
- Monthly cashflow
- —
- DSCR
- —
- Eligible?
- —
No personal income docs; deal must DSCR.
Hard money
10% down · 12.0% · 12mo
- Down + closing
- —
- Monthly P&I
- —
- Monthly cashflow
- —
- DSCR
- —
- Eligible?
- —
Short-term bridge; refi at stabilization.
Rent comps 22 comps
| Address | Beds | Baths | Sqft | Rent | $/sqft | DOM | Units | Dist |
|---|---|---|---|---|---|---|---|---|
| 1123 Diamond Drape Dr Rosharon, TX | 4.0 | 2.0 | 1844 | $2,000 | $1.08 | 12d | 1 | 0.25mi |
| 9423 Grand Spark Dr Rosharon, TX | 3.0 | 3.0 | 1999 | $2,600 | $1.30 | 43d | 1 | 0.41mi |
| 9439 Ruby Mist Dr Rosharon, TX | 5.0 | 2.5 | 2605 | $2,456 | $0.94 | 7d | 1 | 0.61mi |
| 10502 Moon Valley Ln Rosharon, TX | 3.0 | 2.0 | 1615 | $2,725 | $1.69 | 1d | 1 | 0.78mi |
| 10507 Moon Valley Ln Rosharon, TX | 3.0 | 2.0 | 1548 | $2,650 | $1.71 | 1d | 1 | 0.79mi |
| 10610 Cascade Creek Dr Rosharon, TX | 3.0 | 2.0 | 1548 | $2,700 | $1.74 | 43d | 1 | 0.80mi |
| 10313 Malta Trace Dr Rosharon, TX | 4.0 | 2.0 | 1802 | $2,545 | $1.41 | 43d | 1 | 0.81mi |
| 10622 Cascade Creek Dr Rosharon, TX | 4.0 | 2.0 | 1780 | $2,775 | $1.56 | 43d | 1 | 0.83mi |
| 10630 Cascade Creek Dr Rosharon, TX | 3.0 | 2.5 | 1940 | $2,875 | $1.48 | 2d | 1 | 0.85mi |
| 10538 Wildflower View Dr Rosharon, TX | 3.0 | 2.0 | 1522 | $2,775 | $1.82 | 1d | 1 | 0.86mi |
| 10602 Wildflower View Dr Rosharon, TX | 4.0 | 2.0 | 1596 | $2,850 | $1.79 | 20d | 1 | 0.88mi |
| 1816 Corsica Creek Ln Rosharon, TX | 3.0–4.0 | 2.0–2.5 | 1653 | $2,719 | $1.64 | 1d | 21 | 0.91mi |
| 1234 Scarlet Creek Dr Rosharon, TX | 3.0 | 2.0 | 1548 | $2,650 | $1.71 | 1d | 1 | 0.91mi |
| 1014 Star Grass Ln Rosharon, TX | 4.0 | 2.0 | 2067 | $2,375 | $1.15 | 43d | 1 | 0.92mi |
| 10714 Cliffs View Dr Iowa Colony, TX | 4.0 | 3.5 | 2070 | $2,700 | $1.30 | 43d | 1 | 0.99mi |
| 1403 Cascade Hills Dr Rosharon, TX | 4.0 | 3.0 | 2067 | $3,450 | $1.67 | 7d | 1 | 1.02mi |
| 9518 Peridot Green Dr Rosharon, TX | 4.0 | 2.0 | 1593 | $1,886 | $1.18 | 22d | 1 | 1.08mi |
| 10211 Alpine Lake Ln Rosharon, TX | 3.0–4.0 | 2.0–2.5 | 1731 | $3,025 | $1.75 | 1d | 6 | 1.16mi |
| 10211 Alpine Lake Ln Rosharon, TX | 3.0–4.0 | 2.0–2.5 | 1731 | $2,875 | $1.66 | 43d | 7 | 1.16mi |
| 2314 Red Slate Dr Rosharon, TX | 4.0 | 4.0 | 2531 | $2,850 | $1.13 | 43d | 1 | 1.23mi |
| 1119 Toledo Bend Pass Rosharon, TX | 5.0 | 3.0 | 2200 | $2,500 | $1.14 | 43d | 1 | 1.38mi |
| 8414 Aster Glen Way Rosharon, TX | 4.0 | 2.5 | 2588 | $2,650 | $1.02 | 43d | 1 | 1.47mi |
HOA detail
- Monthly dues
- $100 · $1,200/yr
Listing history 15 events
-
2026-06-18days on market $269,000 Active 36 DOM
-
2026-06-17days on market $269,000 Active 35 DOM
-
2026-06-16days on market $269,000 Active 34 DOM
-
2026-06-15days on market $269,000 Active 33 DOM
-
2026-06-13days on market $269,000 Active 31 DOM
-
2026-06-13pricedays on market $269,000 Active 30 DOM
-
2026-06-09days on market $274,000 Active 27 DOM
-
2026-06-08days on market $274,000 Active 26 DOM
-
2026-06-07days on market $274,000 Active 25 DOM
-
2026-06-04days on market $274,000 Active 22 DOM
-
2026-06-03days on market $274,000 Active 21 DOM
-
2026-06-02days on market $274,000 Active 20 DOM
-
2026-06-01days on market $274,000 Active 19 DOM
-
2026-05-31days on market $274,000 Active 18 DOM
-
2026-05-13$274,000 Active 896-char remark
ⓘ Source: listings_history table (triggers on properties + properties_extension) + one-shot
backfill from property_details.listing_events for pre-trigger history.
Tax reassessment forecast TX · Resets to sale price
- Current annual tax
- $8,554 · $713/mo
- Projected year-2 tax
- $8,554 · $713/mo
- Expected delta
- $0/yr ($0/mo · 0.0%)
ⓘ Screening estimate from a state-policy table — verify with the county assessor before closing.
Climate risk First Street
- Flood 1/10 Low FEMA zone X (unshaded) · 0% chance over 30 yrs
- Wildfire 5/10 Major
- Heat 9/10 Extreme 7 d/yr ≥110°F today · 23 d/yr by 30 yrs out
- Wind 9/10 Extreme 99% chance of damaging wind over 30 yrs
- Air quality 2/10 Low 1 unhealthy d/yr today · 2 by 30 yrs out
Nearby sold comps map
Loading sold comps map…
Walkable amenities ~0.75 mi
Loading nearby amenities…
Taxation est. · year 1
- Rental income
- $33,446
- − Mortgage interest
- −$15,068
- − Property taxes
- −$8,554
- − Insurance
- −$1,345
- − Repairs & maintenance
- −$2,676
- − Management
- −$2,676
- − HOA
- −$1,200
- − Depreciation
- −$7,825
- Taxable loss
- −$5,898
- Est. tax savings @ 24.0%
- +$1,416
- After-tax cash flow
- $-189/yr
For passive investors: Depreciation is non-cash, so a rental often shows a tax loss while cash-flowing — sheltering income. Rental losses are passive: they offset passive income freely, and up to $25,000/yr can offset ordinary (W-2) income if you actively participate and your MAGI is under $100k (phasing out to $0 by $150k); unused losses carry forward. On sale, claimed depreciation is recaptured at up to 25%, and gains may owe capital-gains tax (a 1031 exchange can defer both). Figures are a year-1 estimate at your 24.0% rate — not tax advice; consult a CPA.
Condition & rehab AI · 12 photos
This well-maintained 2-story home with a spacious floor plan and corner lot is ready for a new owner. Minor exterior touch-ups and cleaning gutters would further enhance its curb appeal and rental value.
Value-add opportunities
- Resale Paint exterior trim — Fresh paint enhances curb appeal and home value
- Rental Clean gutters — Clean gutters improve drainage and reduce maintenance costs
Renovation cost estimate screening
Value-add ROI direction
- Resale Paint exterior trim — Fresh paint enhances curb appeal and home value ↑
- Rental Clean gutters — Clean gutters improve drainage and reduce maintenance costs ↑
ⓘ Cost ranges are severity-bucket heuristics (US national rule-of-thumb). Get contractor quotes + a written scope before underwriting a rehab budget.
Schools (NCES district)
- District
- Alvin ISD
- NCES district ID
- 4808090
- Math proficiency
- 39% ▼ -11.00%
- Reading proficiency
- 48% ▬ 0.00%
- Median HH income
- $66,740
- Composite
- 38.96/100
- National rank
- #4080
- State rank
- #255 of 826 in TX
Livability — Iowa Colony
- Score
- 64/100
- State rank
- #757
- US rank
- #13904
Category grades
Schools grade is shown separately in the Schools card above.
Census & demographics
- Census place
- Iowa Colony, TX
- County
- Brazoria County · 374,982 people
- Metro
- Houston-The Woodlands-Sugar Land, TX
- Population (ZIP)
- 52,747
- Household income
- $119,287
- Rent vs Own
- Severe rent burden
- 251.0
Population outlook (Brazoria County) Hauer SSP2
- Today (2025)
- 420,414 people
- By 2030
- 457,585 · +8.8%
- By 2040
- 532,232 · +26.6%
- By 2050
- 605,399 · +44.0%
- By 2075
- 779,358 · +85.4%
- By 2100
- 883,759 · +110.2%
Race, ethnicity, and origin ACS 2023
- Neighborhood character
- Highly diverse neighborhood (Simpson 0.70)
- Race & ethnicity
- Hispanic / Latino 38% Black 34% White 20% Two or more races 18% Asian 5%
- Hispanic origin (detail)
- Mexican 31% Puerto Rican 2%
- Common ancestry
- Lithuanian 1% Slovak 1% Romanian 1%
- Foreign-born
- 16% · Canada, Vietnam, China
- Languages at home
- 64% English-only · Spanish 28% Other Asian/Pacific 2% Vietnamese 1%
Political lean MEDSL · Brazoria
- 2024 margin
- R (+19.7) · D 39.5% · R 59.2% · Other 1.3%
- 2008→2024 swing
- +9.9pp toward D · 2008: -29.6pp · 2024: -19.7pp
- All cycles
- 2024: R+19.7 2020: R+18.2 2016: R+24.6 2012: R+34.2 2008: R+29.6
Not yet ingested
- Civics
- —
Market trends
- HPI YoY
- ▼ -120.19%
- Current HPI
- 198.6559
- Rent YoY
- ▲ 0.44%
- Metro
- Houston-The Woodlands-Sugar Land, TX
- State GDP YoY
- ▲ 3.95%
- F500 in state
- 110
Industry mix (Fortune 500 HQ in TX)
| Industry | F500 HQs | Revenue |
|---|---|---|
| Energy | 16 | $1,198B |
|
||
| Technology | 5 | $198B |
|
||
| Engineering / Construction | 4 | $72B |
|
||
| Energy Services | 3 | $60B |
|
||
| Utilities | 3 | $41B |
|
||
| Healthcare | 2 | $330B |
|
||
Price history
-1.8% since first listed2 events — show timeline
- 2026-06-10 Price Changed $269,000 HARMLS
- 2026-05-13 Listed $274,000 HARMLS
Property tax history
+87.4%/yrLatest (2025): $8,554 · -7.4% YoY. Source: county tax records.
Cash-flow waterfall
monthlySold comps — $/sqft
last 12 mo · ≤1 miLoading sold comps…