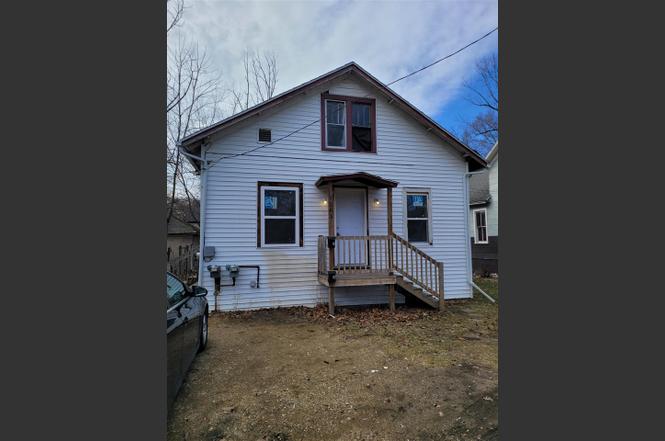
1503 N Westnedge Ave · Kalamazoo, MI
Flood risk 4/10 · Minor
- FEMA flood zone
- X (unshaded)
- Chance of flooding over 30 yrs
- 0.21%
- Est. flood insurance / yr
- $507 – $1,088
Fire risk 1/10 · Minimal
- Est. fire insurance / yr
- $784 – $1,456
Heat risk 2/10 · Minimal
- Hot days now (above 100°F)
- 7 days/yr
- Hot days in 30 yrs
- 15 days/yr
Wind risk 2/10 · Minimal
- Chance of severe wind over 30 yrs
- —
Air-quality risk 2/10 · Minimal
- Unhealthy air days now
- 1 days/yr
- Unhealthy air days in 30 yrs
- 2 days/yr
Risk factors via First Street. Map © Google.
Why this score? — see what drove the C grade
The composite is a weighted blend of 9 inputs, each scored 0–100. Each bar is that input's sub-score; the figure is the points it added to the 100-point composite (weight × sub-score).
- Cash flow +26.9/30.0
- DSCR +9.3/10.0
- 1% rule +7.2/10.0
- Schools +4.7/10.0
- Livability +3.8/5.0
- Condition / age +2.5/5.0
- Rent growth +2.3/5.0
- ARV discount +0.0/15.0
- Appreciation +0.0/10.0
$119,900
🖨 Deal sheet 📄 Offer letter ✓ Due diligence
Listing remarks MLS
Great opportunity with this updated upper/lower duplex! The lower unit offers 2 bedrooms and 1 full bath, while the upper unit features 1 bedroom and 1 bath--perfect for owner-occupants, investors, or multigenerational living. Both units have seen thoughtful upgrades including new vinyl flooring, updated windows, modern lighting, refreshed bathrooms, and stylish kitchen cabinets. Whether you're looking to live in one and rent the other or expand your rental portfolio, this turnkey property is ready to go! Be advised the property located at 1503 N Westnedge Ave, Kalamazoo MI may qualify for up to a $5,000 Chase Homebuyer Grant.
Key facts
- Thoughtful upgrades
- Updated duplex
- Updated windows
Tags
Neighborhood map
What this means for you Summary
Snapshot
- This is a 4-bed/2.0-bath single-family listed at $120k.
Deal economics
- At list price, monthly cash flow is $333 ($4k/yr) — positive.
- The deal already cash-flows at list — no discount required.
- Meets the 1% rule at list price ($1k rent vs $120k).
- Recommended offer: $109k (9.0% below list) — sets the bar for market timing.
- Cap rate 9.6% vs local median 4.1% in Kalamazoo — top-decile yield for the area; either an underpriced asset or a hidden risk that comps aren't pricing in. Stress-test before assuming the spread holds.
Location & tenants
- Location reads 76/100 on livability (#141 in MI, #3,492 nationally) — a middle-class / working-renter tenant base. Strengths: commute A+, cost of living A+, housing A+; Watch: crime F, employment D-.
- Kalamazoo Public Schools (urban): math 43% / reading 72% proficiency, ranked #71 of 540 in MI (top 13%) — acceptable for families but not a draw, mixed tenant base, ~2y average lease; 66% free/reduced lunch — lower-income household profile, screen leases tightly.
- Market conditions: Rents soft (-0.8%/yr); 77 active listings in the ZIP; 3 comparable units currently listed for rent nearby; rentals at typical pace (median 21d on market — plan ~3-4 weeks tenant-placement turnaround); lower-income renter base — watch delinquency; 339 units permitted in Kalamazoo County in 2024 (22 in 5+ unit buildings).
- This rent runs 45% of the median local income ($39k/yr) — at the standard rent-burdened threshold; future hikes will face affordability resistance.
Forward outlook
- Local home prices are declining (-3.0%/yr); year-one equity from $829 of loan paydown is wiped out by about $4k of value loss. Plan a longer hold.
- Kalamazoo County population projected at +18% by 2050 — long-run rental-demand tailwind backs the buy-and-hold thesis.
Negotiation context
- It's been on market 92 days — a 9% lower offer ($109k) is reasonable based on typical stale-listing flexibility.
- 9 sale attempts since 16y ago with the ask held roughly flat each time — persistent listings suggest the price (not the market) is what's stuck; bring a comps-based counter.
- Current owner paid $50k; list at $120k implies a 140% gain — meaningful room to come down on a strong offer.
Risks & watch-outs
- Watch-outs: built in 1927 — expect roof / HVAC / electrical / plumbing capex.
Questions for the listing agent
- It's been on market 92 days. Have you received any prior offers? Is the seller open to a 9% concession, seller financing, or rate buy-down credit?
- Built in 1927 — when were the roof, HVAC, electrical panel, plumbing, and water heater last replaced?
- Why hasn't it sold? Are there any deal-killer items the seller is aware of (foundation, flood, title, zoning, code violations)?
- Is there a deadline driving the sale (1031 exchange, divorce, estate, relocation)? That informs how much negotiation room exists.
- Crime grade is F in this area — have there been break-ins, vandalism, or insurance claims at this property in the last 3 years? What carrier currently insures it and at what premium?
- What's the average days-on-market for RENTAL listings here right now (not sales)? A rising rental-DOM trend means longer vacancies and softer asking-rent achievability than the comps imply.
- What's the recent tenant-quality profile in this submarket — average credit score on applications, eviction rate, late-payment / NSF rate, and stable-employment percentage? A property-management company in the area should have these aggregated.
- How much new for-sale + rental construction is in the pipeline within 1–3 miles? Heavy new supply typically softens prices + rents 12–24 months out; constrained supply supports both.
Investment metrics
- 1% rule
- 1.22% ✓
- Cap rate
- 9.62%
- Cash-on-cash
- 11.90%
- DSCR
- 1.53
- GRM
- 6.8
CMA / ARV
- ARV (on-the-fly)
- $98,070
- Comps found
- 6
Show comp detail 6 sales within ~0.75 mi
| Address | Dist | Beds/Ba | Sqft | Sold | Price | $/sf | Match |
|---|---|---|---|---|---|---|---|
| 1530 N Park St | 0.15mi | 3/1.0 (-1) | 1,018 (+9%) | 0mo | $110,500 | $109 | 69 |
| 311 Bessie St | 0.20mi | 3/1.0 (-1) | 900 (-4%) | 10mo | $70,000 | $78 | 67 |
| 925 N Church St | 0.41mi | 3/1.0 (-1) | 958 (+3%) | 3mo | $53,000 | $55 | 65 |
| 636 Mabel St | 0.39mi | 3/1.5 (-1) | 958 (+3%) | 9mo | $118,900 | $124 | 63 |
| 1520 N Park St | 0.15mi | 3/1.0 (-1) | 1,000 (+7%) | 12mo | $105,000 | $105 | 62 |
| 1334 N Rose St | 0.30mi | 4/1.0 | 855 (-8%) | 21mo | $11,741 | $14 | 50 |
Match score weights: distance 35% · size 25% · config 20% · recency 20%. Top-matched comps best support the ARV.
Projected returns pro-forma
-3.0% appreciation · 0.0% rent growth · sell at horizon
- IRR
- -2.0%
- Equity multiple
- 0.93×
- Total profit
- $-2,499
- Equity at exit
- $17,877
- IRR
- 4.1%
- Equity multiple
- 1.26×
- Total profit
- $8,623
- Equity at exit
- $10,367
Cash invested: $33,572 (down + closing). Projections, not guarantees.
Landlord ↔ Tenant lean methodology
- Overall (STATE)
- 62 Landlord-Friendly
- State Michigan
- 62 Landlord-Friendly · EVEN
- County
- — inherits STATE
- City
- — inherits STATE
ZIP-level market 49007
- Rents YoY
- -0.8%
- Active inventory
- 77
- Price-to-rent
- 6.8×
Monthly cashflow live
- Estimated rent
- $1,464 medium interval (Pro) →
- Mortgage (P&I)
- −$629
- Tax from tax record
- −$145 /mo · $1,736/yr
- Insurance
- −$50
- HOA
- −$0
- Vacancy / Maint / Mgmt
- −$307
- Net cashflow
- $333
Break-even live
UW: 25.0% down · 7.5% · 30yr · 1.5% tax · 5.0% vac · 8.0% maint · 8.0% mgmt
Financing live
Cash to close
- Down payment
- $29,975
- Closing costs
- $3,597
- Reserves months
- —
- Total cash needed
- —
Loan-product check · same deal, 3 products live
Conventional
25% down · 7.5% · 30yr
- Down + closing
- —
- Monthly P&I
- —
- Monthly cashflow
- —
- DSCR
- —
- Eligible?
- —
Personal DTI + credit; lowest rate.
DSCR
20% down · 8.5% · 30yr
- Down + closing
- —
- Monthly P&I
- —
- Monthly cashflow
- —
- DSCR
- —
- Eligible?
- —
No personal income docs; deal must DSCR.
Hard money
10% down · 12.0% · 12mo
- Down + closing
- —
- Monthly P&I
- —
- Monthly cashflow
- —
- DSCR
- —
- Eligible?
- —
Short-term bridge; refi at stabilization.
Rent comps 3 comps
| Address | Beds | Baths | Sqft | Rent | $/sqft | DOM | Units | Dist |
|---|---|---|---|---|---|---|---|---|
| 816 W Main St Kalamazoo, MI | 3.0 | 1.0 | 1005 | $1,100 | $1.09 | 20d | 1 | 1.01mi |
| 2420 Upper Riverview Dr Kalamazoo, MI | 3.0 | 1.0 | 925 | $1,300 | $1.41 | 20d | 1 | 1.22mi |
| 3205 Douglas Ave Kalamazoo, MI | 2.0–3.0 | 1.0–2.0 | 912 | $1,379 | $1.51 | 13d | 1 | 1.37mi |
Listing history 21 events
-
2025-11-06status Pending
Show marketing remark (634 chars)
Great opportunity with this updated upper/lower duplex! The lower unit offers 2 bedrooms and 1 full bath, while the upper unit features 1 bedroom and 1 bath--perfect for owner-occupants, investors, or multigenerational living. Both units have seen thoughtful upgrades including new vinyl flooring, updated windows, modern lighting, refreshed bathrooms, and stylish kitchen cabinets. Whether you're looking to live in one and rent the other or expand your rental portfolio, this turnkey property is ready to go! Be advised the property located at 1503 N Westnedge Ave, Kalamazoo MI may qualify for up to a $5,000 Chase Homebuyer Grant.
-
2025-11-06status Pending 634-char remark
Show marketing remark (634 chars)
Great opportunity with this updated upper/lower duplex! The lower unit offers 2 bedrooms and 1 full bath, while the upper unit features 1 bedroom and 1 bath--perfect for owner-occupants, investors, or multigenerational living. Both units have seen thoughtful upgrades including new vinyl flooring, updated windows, modern lighting, refreshed bathrooms, and stylish kitchen cabinets. Whether you're looking to live in one and rent the other or expand your rental portfolio, this turnkey property is ready to go! Be advised the property located at 1503 N Westnedge Ave, Kalamazoo MI may qualify for up to a $5,000 Chase Homebuyer Grant.
-
2025-08-06$119,900 Active
Show marketing remark (634 chars)
Great opportunity with this updated upper/lower duplex! The lower unit offers 2 bedrooms and 1 full bath, while the upper unit features 1 bedroom and 1 bath--perfect for owner-occupants, investors, or multigenerational living. Both units have seen thoughtful upgrades including new vinyl flooring, updated windows, modern lighting, refreshed bathrooms, and stylish kitchen cabinets. Whether you're looking to live in one and rent the other or expand your rental portfolio, this turnkey property is ready to go! Be advised the property located at 1503 N Westnedge Ave, Kalamazoo MI may qualify for up to a $5,000 Chase Homebuyer Grant.
-
2025-08-06$119,900 Active 634-char remark
Show marketing remark (634 chars)
Great opportunity with this updated upper/lower duplex! The lower unit offers 2 bedrooms and 1 full bath, while the upper unit features 1 bedroom and 1 bath--perfect for owner-occupants, investors, or multigenerational living. Both units have seen thoughtful upgrades including new vinyl flooring, updated windows, modern lighting, refreshed bathrooms, and stylish kitchen cabinets. Whether you're looking to live in one and rent the other or expand your rental portfolio, this turnkey property is ready to go! Be advised the property located at 1503 N Westnedge Ave, Kalamazoo MI may qualify for up to a $5,000 Chase Homebuyer Grant.
-
2024-04-28historical $1,300
-
2023-09-03$1,300
-
2023-08-30historical $1,300
-
2023-08-08price $1,300
-
2023-07-29$1,200
-
2022-02-25soldstatus $50,000
-
2014-09-18historical
-
2013-11-07soldstatus $20,000
-
2013-10-14soldstatus $10,000
-
2013-10-14soldstatus $10,000
-
2013-07-25$12,500
-
2013-07-25$12,500
-
2013-07-23historical
-
2013-05-02$15,900
-
2011-06-21$20,000
-
2010-12-17soldstatus $4,500
-
2010-10-21$7,000
ⓘ Source: listings_history table (triggers on properties + properties_extension) + one-shot
backfill from property_details.listing_events for pre-trigger history.
Tax reassessment forecast MI · Partial reset (capped growth)
- Current annual tax
- $1,736 · $145/mo
- Projected year-2 tax
- $1,791 · $149/mo
- Expected delta
- +$55/yr (+$5/mo · 3.2%)
ⓘ Screening estimate from a state-policy table — verify with the county assessor before closing.
Climate risk First Street
- Flood 4/10 Moderate FEMA zone X (unshaded) · 21% chance over 30 yrs
- Wildfire 1/10 Low
- Heat 2/10 Low 7 d/yr ≥100°F today · 15 d/yr by 30 yrs out
- Wind 2/10 Low
- Air quality 2/10 Low 1 unhealthy d/yr today · 2 by 30 yrs out
Nearby sold comps map
Loading sold comps map…
Walkable amenities ~0.75 mi
Loading nearby amenities…
Taxation est. · year 1
- Rental income
- $17,564
- − Mortgage interest
- −$6,716
- − Property taxes
- −$1,736
- − Insurance
- −$600
- − Repairs & maintenance
- −$1,405
- − Management
- −$1,405
- − Depreciation
- −$3,488
- Taxable income
- $2,214
- Est. tax owed @ 24.0%
- −$531
- After-tax cash flow
- $3,463/yr
For passive investors: Depreciation is non-cash, so a rental often shows a tax loss while cash-flowing — sheltering income. Rental losses are passive: they offset passive income freely, and up to $25,000/yr can offset ordinary (W-2) income if you actively participate and your MAGI is under $100k (phasing out to $0 by $150k); unused losses carry forward. On sale, claimed depreciation is recaptured at up to 25%, and gains may owe capital-gains tax (a 1031 exchange can defer both). Figures are a year-1 estimate at your 24.0% rate — not tax advice; consult a CPA.
Schools (NCES district)
- District
- Kalamazoo Public Schools
- NCES district ID
- 2619950
- Math proficiency
- 43% ▲ 13.00%
- Reading proficiency
- 72% ▲ 33.00%
- Median HH income
- $35,291
- Composite
- 47.48/100
- National rank
- #2275
- State rank
- #71 of 540 in MI
Livability — Kalamazoo
- Score
- 76/100
- State rank
- #141
- US rank
- #3492
Category grades
Schools grade is shown separately in the Schools card above.
Census & demographics
- Census place
- Kalamazoo, MI
- County
- Kalamazoo County · 224,317 people
- City population
- 121,397
- Metro
- Kalamazoo-Portage, MI
- Population (ZIP)
- 9,836
- Household income
- $39,344
- Rent vs Own
- Severe rent burden
- 816.0
Population outlook (Kalamazoo County) Hauer SSP2
- Today (2025)
- 280,982 people
- By 2030
- 292,068 · +3.9%
- By 2040
- 312,191 · +11.1%
- By 2050
- 331,196 · +17.9%
- By 2075
- 379,021 · +34.9%
- By 2100
- 396,579 · +41.1%
Race, ethnicity, and origin ACS 2023
- Neighborhood character
- Diverse neighborhood (Simpson 0.61)
- Race & ethnicity
- White 44% Black 44% Two or more races 7% Hispanic / Latino 3%
- Common ancestry
- Iranian 3% Romanian 2% Lithuanian 1%
- Foreign-born
- 3% · Canada
- Languages at home
- 94% English-only · Spanish 4% French/Haitian/Cajun 1% Arabic 1%
Political lean MEDSL · Kalamazoo
- 2024 margin
- D (+17.7) · D 58.0% · R 40.3% · Other 1.7%
- 2008→2024 swing
- -1.8pp toward R · 2008: 19.5pp · 2024: 17.7pp
- All cycles
- 2024: D+17.7 2020: D+18.7 2016: D+12.8 2012: D+13.3 2008: D+19.5
Not yet ingested
- Civics
- —
Market trends
- HPI YoY
- ▼ -68.80%
- Current HPI
- 112.4973
- Rent YoY
- ▼ -0.85%
- Metro
- Kalamazoo-Portage, MI
- State GDP YoY
- ▲ 1.37%
- F500 in state
- 28
Industry mix (Fortune 500 HQ in MI)
| Industry | F500 HQs | Revenue |
|---|---|---|
| Automotive Parts | 3 | $48B |
|
||
| Automotive | 2 | $372B |
|
||
| Chemicals | 1 | $45B |
|
||
| Automotive Retail | 1 | $29B |
|
||
| Healthcare / Medical Devices | 1 | $23B |
|
||
| Automotive Technology | 1 | $20B |
|
||
Price history
+1612.9% since first listed21 events — show timeline
- 2025-11-06 Pending — REALCOMP
- 2025-11-06 Pending — MiRealSource-MiMLS
- 2025-08-06 Listed $119,900 MiRealSource-MiMLS
- 2025-08-06 Listed $119,900 REALCOMP
- 2024-04-28 Rental Removed $1,300 BUILDIUM
- 2023-09-03 Listed for Rent $1,300 BUILDIUM
- 2023-08-30 Rental Removed $1,300 BUILDIUM
- 2023-08-08 Price Changed $1,300 BUILDIUM
- 2023-07-29 Listed for Rent $1,200 BUILDIUM
- 2022-02-25 Sold (Public Records) $50,000 Public Records
- 2014-09-18 Listing Removed — SW Michigan MLS
- 2013-11-07 Sold (Public Records) $20,000 Public Records
- 2013-10-14 Sold (MLS) $10,000 REALCOMP
- 2013-10-14 Sold (MLS) $10,000 SW Michigan MLS
- 2013-07-25 Listed $12,500 REALCOMP
- 2013-07-25 Listed $12,500 SW Michigan MLS
- 2013-07-23 Listing Removed — SW Michigan MLS
- 2013-05-02 Listed $15,900 SW Michigan MLS
- 2011-06-21 Listed $20,000 SW Michigan MLS
- 2010-12-17 Sold (MLS) $4,500 SW Michigan MLS
- 2010-10-21 Listed $7,000 SW Michigan MLS
Property tax history
+6.3%/yrLatest (2025): $1,736 · +3.0% YoY. Source: county tax records.
Cash-flow waterfall
monthlySold comps — $/sqft
last 12 mo · ≤1 miLoading sold comps…