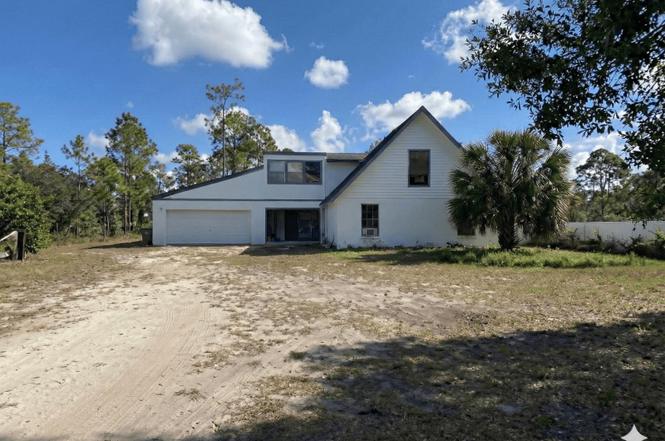
618 Monroe Ave · Lehigh Acres, FL
Flood risk 1/10 · Minimal
- FEMA flood zone
- AE
- Chance of flooding over 30 yrs
- 0.0%
- Est. flood insurance / yr
- $1,737 – $8,500
Fire risk 4/10 · Minor
- Est. fire insurance / yr
- $947 – $1,759
Heat risk 9/10 · Severe
- Hot days now (above 108°F)
- 7 days/yr
- Hot days in 30 yrs
- 26 days/yr
Wind risk 10/10 · Severe
- Chance of severe wind over 30 yrs
- 99.0%
Air-quality risk 2/10 · Minimal
- Unhealthy air days now
- 1 days/yr
- Unhealthy air days in 30 yrs
- 2 days/yr
Risk factors via First Street. Map © Google.
Why this score? — see what drove the C+ grade
The composite is a weighted blend of 9 inputs, each scored 0–100. Each bar is that input's sub-score; the figure is the points it added to the 100-point composite (weight × sub-score).
- Cash flow +26.8/30.0
- DSCR +9.2/10.0
- ARV discount +7.5/15.0
- 1% rule +7.4/10.0
- Schools +4.1/10.0
- Rent growth +3.8/5.0
- Livability +3.0/5.0
- Condition / age +2.5/5.0
- Appreciation +0.0/10.0
$199,599
🖨 Deal sheet (PDF) 📄 Offer letter ✓ Due diligence
Listing remarks MLS
Home is in need of significant repairs, roof, drywall and flooring, unique 2 story home with oversized double garage on half acre, over 2200 sq ft of living area, good job for a general contractor.
Key facts
- Open-concept kitchen
- Energy efficiency
- Private fenced lot
Tags
Property features AI
Finance
- Other: Lot approximately 0.5 acre (1/2 to less than 1)
- HOA & community: No HOA/association
Exterior
- Parking: Attached garage; 2-car garage
- Utilities: Well water; Septic tank; Electricity connected
- Home design: Single family residence; Residential property; Two levels; Faces east
- Construction: Stucco construction; Shingle roof; Other roof material
- Exterior features: Exterior storage; Wire fencing; Wood fencing; Dirt/unimproved road access
Interior
- Kitchen: Dishwasher; Microwave; Range; Refrigerator
- Bedrooms: 3 bedrooms
- Flooring: Ceramic tile; Slab foundation
- Bathrooms: 2 full bathrooms
- Heating & cooling: Electric heating; Central air conditioning
- Interior features: Cathedral ceilings; Ceiling fans
- Laundry & utility: Laundry inside; Laundry in garage
Neighborhood map
What this means for you Summary
Snapshot
- This is a 3-bed/2.0-bath single-family listed at $200k.
Deal economics
- At list price, monthly cash flow is $118 ($1k/yr) — positive.
- The deal already cash-flows at list — no discount required.
- Meets the 1% rule at list price ($2k rent vs $200k).
- Recommended offer: $176k (12.0% below list) — sets the bar for market timing.
- Cap rate 9.6% vs local median 4.7% in Lehigh Acres — top-decile yield for the area; either an underpriced asset or a hidden risk that comps aren't pricing in. Stress-test before assuming the spread holds.
Location & tenants
- Location reads 59/100 on livability (#826 in FL) — a working-class tenant base; expect higher turnover. Strengths: cost of living A+, housing A+; Watch: crime C-, employment D+, amenities F.
- Lee (suburban): math 47% / reading 50% proficiency, ranked #42 of 73 in FL (top 58%) — families likely to look elsewhere, expect single-tenant / working-renter base with shorter leases.
- Zoned schools: Veterans Park Academy For The Arts (math 41% / reading 45%, grade F, #1,366 of 2,144 statewide, top 64%, 2,133 students, 36% FRL); Oak Hammock Middle School (math 43% / reading 41%, grade D-, #340 of 571 statewide, top 61%, 1,563 students, 56% FRL); Lehigh Senior High School (math 23% / reading 45%, grade F, #394 of 667 statewide, top 60%, 2,476 students, 57% FRL).
- Market conditions: Rents rising fast (+5.3%/yr); 1620 active listings in the ZIP; 10 comparable units currently listed for rent nearby; rentals leasing fast (median 13d on market — plan ~1-2 weeks tenant-placement turnaround); 15,411 units permitted in Lee County in 2024 (4,686 in 5+ unit buildings).
- This rent runs 40% of the median local income ($74k/yr) — at the standard rent-burdened threshold; future hikes will face affordability resistance.
Forward outlook
- Local home prices are declining (-3.0%/yr); year-one equity from $1k of loan paydown is wiped out by about $6k of value loss. Plan a longer hold.
- Lee County population projected at +44% by 2050 — long-run rental-demand tailwind backs the buy-and-hold thesis.
Negotiation context
- It's been on market 157 days — a 12% lower offer ($176k) is reasonable based on typical stale-listing flexibility.
- 3 sale attempts since 11y ago; this cycle's ask has dropped $151k (43%) from the opening price — seller is motivated, your offer sets the floor, not the list.
- Current owner paid $40k; list at $200k implies a 399% gain — meaningful room to come down on a strong offer.
Risks & watch-outs
- Watch-outs: flood insurance adds $427/mo.
- Climate carrying-cost: in FEMA flood zone AE (mandatory federal flood insurance); severe wind risk, 99% chance of damaging wind over 30y; extreme-heat days projected 7→26/yr by 2055 (HVAC capex compounding) — expect insurance premiums to compound above CPI over the hold.
Questions for the listing agent
- It's been on market 157 days. Have you received any prior offers? Is the seller open to a 12% concession, seller financing, or rate buy-down credit?
- What's the actual annual flood-insurance premium (NFIP or private), and is the property in a SFHA with mandatory coverage?
- Why hasn't it sold? Are there any deal-killer items the seller is aware of (foundation, flood, title, zoning, code violations)?
- Is there a deadline driving the sale (1031 exchange, divorce, estate, relocation)? That informs how much negotiation room exists.
- Schools are D-rated, which usually means shorter tenancies and higher turnover. Who's the typical renter profile here, and what's been the actual vacancy rate?
- What's the average days-on-market for RENTAL listings here right now (not sales)? A rising rental-DOM trend means longer vacancies and softer asking-rent achievability than the comps imply.
- What's the recent tenant-quality profile in this submarket — average credit score on applications, eviction rate, late-payment / NSF rate, and stable-employment percentage? A property-management company in the area should have these aggregated.
- How much new for-sale + rental construction is in the pipeline within 1–3 miles? Heavy new supply typically softens prices + rents 12–24 months out; constrained supply supports both.
Investment metrics
- 1% rule
- 1.24% ✓
- Cap rate
- 9.57%
- Cash-on-cash
- 11.69%
- DSCR
- 1.52
- GRM
- 6.7
CMA / ARV
- ARV (on-the-fly)
- $430,416
- Comps found
- 3
Show comp detail 3 sales within ~0.75 mi
| Address | Dist | Beds/Ba | Sqft | Sold | Price | $/sf | Match |
|---|---|---|---|---|---|---|---|
| 521 Johns Ave | 0.32mi | 4/2.0 (+1) | 1,882 (+7%) | 11mo | $399,900 | $212 | 60 |
| 325 Scott Ave | 0.71mi | 3/2.0 | 1,806 (+2%) | 18mo | $440,000 | $244 | 48 |
| 507 Scott Ave | 0.37mi | 3/2.0 | 1,503 (-15%) | 17mo | $370,000 | $246 | 44 |
Match score weights: distance 35% · size 25% · config 20% · recency 20%. Top-matched comps best support the ARV.
Projected returns pro-forma
-3.0% appreciation · 5.33% rent growth · sell at horizon
- IRR
- -8.8%
- Equity multiple
- 0.67×
- Total profit
- $-18,568
- Equity at exit
- $29,761
- IRR
- 4.4%
- Equity multiple
- 1.37×
- Total profit
- $20,426
- Equity at exit
- $17,258
Cash invested: $55,888 (down + closing). Projections, not guarantees.
Landlord ↔ Tenant lean methodology
- Overall (STATE)
- 87 Strongly Landlord-Friendly
- State Florida
- 87 Strongly Landlord-Friendly · R+3
- County
- — inherits STATE
- City
- — inherits STATE
ZIP-level market 33972
- Home prices YoY
- -13.6%
- Rents YoY
- 5.3%
- Active inventory
- 1620
- Price-to-rent
- 6.7×
Monthly cashflow live
- Estimated rent
- $2,482 high interval (Pro) →
- Mortgage (P&I)
- −$1,047
- Tax from tax record
- −$287 /mo · $3,442/yr
- Insurance
- −$83
- Flood insurance flood zone
- −$427 /mo · $5,118/yr
- HOA
- −$0
- Vacancy / Maint / Mgmt
- −$521
- Net cashflow
- $118
Break-even live
Sensitivity live
| Price | -10% $231 | -5% $174 | +0% $118 | +5% $61 | +10% $5 |
|---|---|---|---|---|---|
| Rent | -10% $-78 | -5% $20 | +0% $118 | +5% $216 | +10% $314 |
| Rate | -1.0pp $218 | -0.5pp $169 | base $118 | +0.5pp $66 | +1.0pp $13 |
UW: 25.0% down · 7.5% · 30yr · 1.5% tax · 5.0% vac · 8.0% maint · 8.0% mgmt
Financing live
Cash to close
- Down payment
- $49,900
- Closing costs
- $5,988
- Reserves months
- —
- Total cash needed
- —
Loan-product check · same deal, 3 products live
Conventional
25% down · 7.5% · 30yr
- Down + closing
- —
- Monthly P&I
- —
- Monthly cashflow
- —
- DSCR
- —
- Eligible?
- —
Personal DTI + credit; lowest rate.
DSCR
20% down · 8.5% · 30yr
- Down + closing
- —
- Monthly P&I
- —
- Monthly cashflow
- —
- DSCR
- —
- Eligible?
- —
No personal income docs; deal must DSCR.
Hard money
10% down · 12.0% · 12mo
- Down + closing
- —
- Monthly P&I
- —
- Monthly cashflow
- —
- DSCR
- —
- Eligible?
- —
Short-term bridge; refi at stabilization.
Rent comps 10 comps
| Address | Beds | Baths | Sqft | Rent | $/sqft | DOM | Units | Dist |
|---|---|---|---|---|---|---|---|---|
| 703 Grant Ave Lehigh Acres, FL | 4.0 | 3.0 | 2363 | $2,000 | $0.85 | 25d | 1 | 0.40mi |
| 819 Moore Ave Lehigh Acres, FL | 4.0 | 3.0 | 1822 | $3,200 | $1.76 | 3d | 1 | 0.49mi |
| 821 Moore Ave Lehigh Acres, FL | 4.0 | 3.0 | 1822 | $3,200 | $1.76 | 12d | 1 | 0.51mi |
| 426 Hamilton Ave Lehigh Acres, FL | 3.0 | 2.0 | 1354 | $1,800 | $1.33 | 16d | 1 | 0.85mi |
| 503 Jackson Ave Lehigh Acres, FL | 3.0 | 2.5 | 1620 | $2,700 | $1.67 | 16d | 1 | 0.93mi |
| 1108 Truman Ave Lehigh Acres, FL | 2.0 | 1.0 | 1512 | $1,650 | $1.09 | 5d | 1 | 1.21mi |
| 525 Glendale Ave Unit 529 Lehigh Acres, FL | 3.0 | 2.0 | 1459 | $1,695 | $1.16 | 25d | 1 | 1.30mi |
| 119 Wellington Ave Lehigh Acres, FL | 4.0 | 3.0 | 1822 | $3,200 | $1.76 | 4d | 1 | 1.33mi |
| 814 Gerald Ave Lehigh Acres, FL | 4.0 | 2.0 | 1933 | $1,950 | $1.01 | 5d | 1 | 1.44mi |
| 322 Edward Ave Lehigh Acres, FL | 2.0 | 2.0 | 1347 | $1,400 | $1.04 | 5d | 1 | 1.45mi |
Listing history 23 events
-
2026-06-17days on market $199,599 Active 157 DOM
-
2026-06-16days on market $199,599 Active 156 DOM
-
2026-06-15days on market $199,599 Active 155 DOM
-
2026-06-13days on market $199,599 Active 153 DOM
-
2026-06-10days on market $199,599 Active 150 DOM
-
2026-06-09days on market $199,599 Active 149 DOM
-
2026-06-07pricedays on market $199,599 Active 147 DOM
-
2026-06-02days on market $199,899 Active 142 DOM
-
2026-06-01days on market $199,899 Active 141 DOM
-
2026-06-01days on market $199,899 Active 140 DOM
-
2026-04-11price $199,899
-
2026-04-02status Active
-
2026-04-02price $204,990
-
2026-03-31historical
-
2026-03-06price $220,998
-
2026-02-24price $240,998
-
2026-02-18price $290,990
-
2026-01-09$350,990 Active
-
2015-12-15price $40,000 197-char remark
Show marketing remark (197 chars)
Home is in need of significant repairs, roof, drywall and flooring, unique 2 story home with oversized double garage on half acre, over 2200 sq ft of living area, good job for a general contractor.
-
2015-12-15price $50,000 197-char remark
Show marketing remark (197 chars)
Home is in need of significant repairs, roof, drywall and flooring, unique 2 story home with oversized double garage on half acre, over 2200 sq ft of living area, good job for a general contractor.
-
2015-12-15soldstatus $40,000 Sold 197-char remark
Show marketing remark (197 chars)
Home is in need of significant repairs, roof, drywall and flooring, unique 2 story home with oversized double garage on half acre, over 2200 sq ft of living area, good job for a general contractor.
-
2015-11-19status Pending 197-char remark
Show marketing remark (197 chars)
Home is in need of significant repairs, roof, drywall and flooring, unique 2 story home with oversized double garage on half acre, over 2200 sq ft of living area, good job for a general contractor.
-
2015-11-16$50,000 Active 197-char remark
Show marketing remark (197 chars)
Home is in need of significant repairs, roof, drywall and flooring, unique 2 story home with oversized double garage on half acre, over 2200 sq ft of living area, good job for a general contractor.
ⓘ Source: listings_history table (triggers on properties + properties_extension) + one-shot
backfill from property_details.listing_events for pre-trigger history.
Tax reassessment forecast FL · Resets to sale price
- Current annual tax
- $3,442 · $287/mo
- Projected year-2 tax
- $3,442 · $287/mo
- Expected delta
- $0/yr ($0/mo · 0.0%)
ⓘ Screening estimate from a state-policy table — verify with the county assessor before closing.
Climate risk First Street
- Flood 1/10 Low FEMA zone AE · 0% chance over 30 yrs
- Wildfire 4/10 Moderate
- Heat 9/10 Extreme 7 d/yr ≥108°F today · 26 d/yr by 30 yrs out
- Wind 10/10 Extreme 99% chance of damaging wind over 30 yrs
- Air quality 2/10 Low 1 unhealthy d/yr today · 2 by 30 yrs out
Nearby sold comps map
Loading sold comps map…
Walkable amenities ~0.75 mi
Loading nearby amenities…
Taxation est. · year 1
- Rental income
- $29,787
- − Mortgage interest
- −$11,181
- − Property taxes
- −$3,442
- − Insurance
- −$6,116
- − Repairs & maintenance
- −$2,383
- − Management
- −$2,383
- − Depreciation
- −$5,807
- Taxable loss
- −$1,524
- Est. tax savings @ 24.0%
- +$366
- After-tax cash flow
- $1,779/yr
For passive investors: Depreciation is non-cash, so a rental often shows a tax loss while cash-flowing — sheltering income. Rental losses are passive: they offset passive income freely, and up to $25,000/yr can offset ordinary (W-2) income if you actively participate and your MAGI is under $100k (phasing out to $0 by $150k); unused losses carry forward. On sale, claimed depreciation is recaptured at up to 25%, and gains may owe capital-gains tax (a 1031 exchange can defer both). Figures are a year-1 estimate at your 24.0% rate — not tax advice; consult a CPA.
Schools (NCES district)
- District
- Lee
- NCES district ID
- 1201080
- Math proficiency
- 47% ▼ -11.00%
- Reading proficiency
- 50% ▼ -4.00%
- Median HH income
- $49,518
- Composite
- 41.49/100
- National rank
- #3458
- State rank
- #42 of 73 in FL
Livability — Lehigh Acres
- Score
- 59/100
- State rank
- #826
- US rank
- #20055
Category grades
Schools grade is shown separately in the Schools card above.
Census & demographics
- Census place
- Lehigh Acres, FL
- County
- Lee County · 788,662 people
- City population
- 130,638
- Metro
- Cape Coral-Fort Myers, FL
- Population (ZIP)
- 17,285
- Household income
- $73,819
- Rent vs Own
- Severe rent burden
- 190.0
Population outlook (Lee County) Hauer SSP2
- Today (2025)
- 871,946 people
- By 2030
- 955,468 · +9.6%
- By 2040
- 1,113,587 · +27.7%
- By 2050
- 1,256,891 · +44.1%
- By 2075
- 1,560,270 · +78.9%
- By 2100
- 1,726,848 · +98.0%
Race, ethnicity, and origin ACS 2023
- Neighborhood character
- Diverse neighborhood (Simpson 0.65)
- Race & ethnicity
- White 44% Hispanic / Latino 38% Two or more races 21% Black 13%
- Hispanic origin (detail)
- Mexican 8% Puerto Rican 7% Cuban 18%
- Common ancestry
- Hispanic 6% Italian 2% Romanian 2%
- Foreign-born
- 27% · Canada, Guatemala
- Languages at home
- 61% English-only · Spanish 32% French/Haitian/Cajun 4% Other Indo-European 1%
Political lean MEDSL · Lee
- 2024 margin
- Strong R (+28.4) · D 35.5% · R 63.9%
- 2008→2024 swing
- -18.0pp toward R · 2008: -10.4pp · 2024: -28.4pp
- All cycles
- 2024: R+28.4 2020: R+19.2 2016: R+20.4 2012: R+16.6 2008: R+10.4
Not yet ingested
- Civics
- —
Market trends
- HPI YoY
- ▼ -53.97%
- Current HPI
- 343.484
- Rent YoY
- ▲ 5.33%
- Metro
- Cape Coral-Fort Myers, FL
- State GDP YoY
- ▲ 3.28%
- F500 in state
- 36
Industry mix (Fortune 500 HQ in FL)
| Industry | F500 HQs | Revenue |
|---|---|---|
| Industrial Technology | 2 | $29B |
|
||
| Insurance | 2 | $17B |
|
||
| Retail | 1 | $60B |
|
||
| Technology Distribution | 1 | $58B |
|
||
| Homebuilding | 1 | $35B |
|
||
| Technology Manufacturing | 1 | $35B |
|
||
Price history
+299.8% since first listed13 events — show timeline
- 2026-04-11 Price Changed $199,899 Stellar MLS as Distributed by MLS Grid
- 2026-04-02 Relisted — Stellar MLS as Distributed by MLS Grid
- 2026-04-02 Price Changed $204,990 Stellar MLS as Distributed by MLS Grid
- 2026-03-31 Listing Removed — Stellar MLS as Distributed by MLS Grid
- 2026-03-06 Price Changed $220,998 Stellar MLS as Distributed by MLS Grid
- 2026-02-24 Price Changed $240,998 Stellar MLS as Distributed by MLS Grid
- 2026-02-18 Price Changed $290,990 Stellar MLS as Distributed by MLS Grid
- 2026-01-09 Listed $350,990 Stellar MLS as Distributed by MLS Grid
- 2015-12-15 Price Changed $40,000 FORTMLS
- 2015-12-15 Sold (MLS) $40,000 FORTMLS
- 2015-12-15 Price Changed $50,000 FORTMLS
- 2015-11-19 Pending — FORTMLS
- 2015-11-16 Listed $50,000 FORTMLS
Property tax history
+17.5%/yrLatest (2025): $3,442 · -17.2% YoY. Source: county tax records.
Cash-flow waterfall
monthlySold comps — $/sqft
last 12 mo · ≤1 miLoading sold comps…