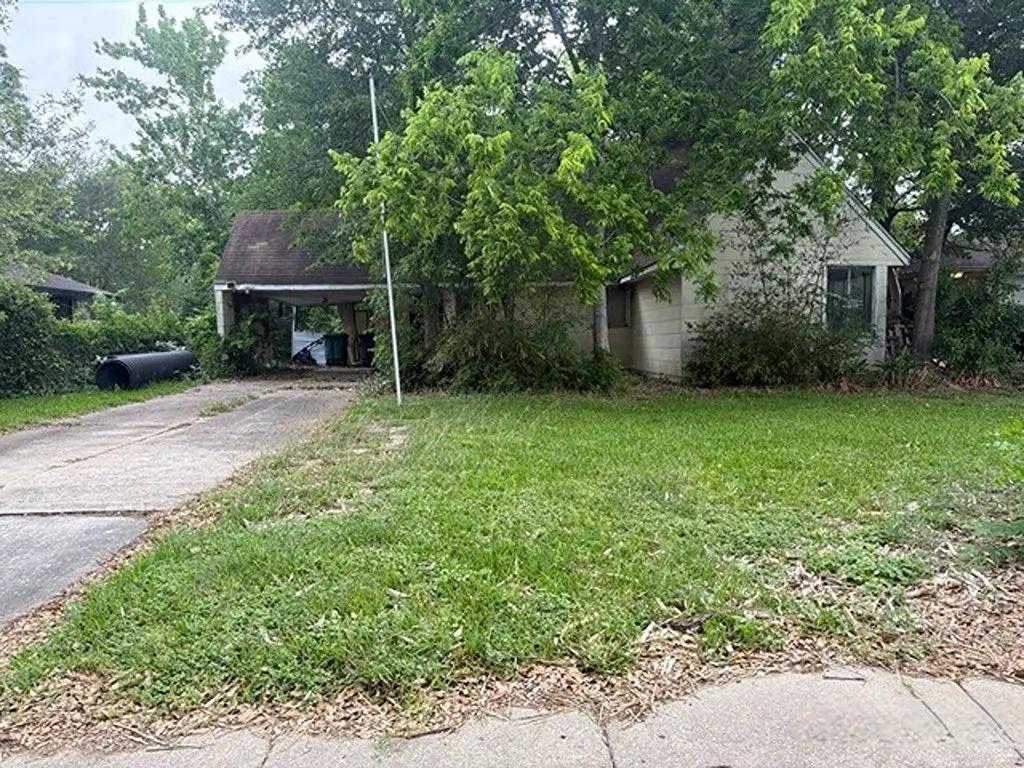
4010 Woodhaven St · Houston, TX
Flood risk 1/10 · Minimal
- FEMA flood zone
- X (unshaded)
- Chance of flooding over 30 yrs
- 0.0%
- Est. flood insurance / yr
- $507 – $1,088
Fire risk 3/10 · Minor
- Est. fire insurance / yr
- $1,222 – $2,270
Heat risk 9/10 · Severe
- Hot days now (above 110°F)
- 7 days/yr
- Hot days in 30 yrs
- 24 days/yr
Wind risk 9/10 · Severe
- Chance of severe wind over 30 yrs
- 99.0%
Air-quality risk 2/10 · Minimal
- Unhealthy air days now
- 2 days/yr
- Unhealthy air days in 30 yrs
- 2 days/yr
Risk factors via First Street. Map © Google.
Why this score? — see what drove the C- grade
The composite is a weighted blend of 9 inputs, each scored 0–100. Each bar is that input's sub-score; the figure is the points it added to the 100-point composite (weight × sub-score).
- Cash flow +16.8/30.0
- ARV discount +15.0/15.0
- 1% rule +6.4/10.0
- DSCR +5.2/10.0
- Livability +3.7/5.0
- Schools +2.7/10.0
- Condition / age +2.5/5.0
- Rent growth +1.5/5.0
- Appreciation +0.0/10.0
$169,000
🖨 Deal sheet (PDF) 📄 Offer letter ✓ Due diligence
Listing remarks
Great opportunity for the investor. This property is located in the Westwood subdivision. This property features 3 bedrooms, 2 full bathrooms, 1 half bathroom, Dining room, Family room. This property is close to major thoroughfares, Employment centers, retail centers, The Medical Center, and entertainment venues. Don't miss out on this one.
Key facts
- 7,200 sq ft lot
- 2 garage spots
- Built 1952
Property features AI
Finance
- Financial info: Lease not considered
Exterior
- Parking: Attached garage; 2-car garage
- Utilities: Public water; Public sewer
- Home design: Residential property; Single-story entry (First level rooms listed)
- Construction: Built in 1952; Wood siding exterior; Composition roof; Slab foundation
- Exterior features: Subdivision lot; Lot approximately 0.165 acres
Interior
- Kitchen: Kitchen (First level), 8x10
- Bedrooms: Primary bedroom (First level), 12x15; Bedroom (First level), 11x12; Bedroom (First level), 10x12
- Bathrooms: 2 full bathrooms; 1 half bathroom
- Heating & cooling: Central heating (Electric and Gas); Central air conditioning (Electric)
- Interior features: Dining room; Den; Total of 6 rooms
- Laundry & utility: No specific laundry details listed
Neighborhood map
What this means for you Summary
Snapshot
- This is a 3-bed/2.5-bath single-family listed at $169k.
Deal economics
- At list price, monthly cash flow is $108 ($1k/yr) — positive.
- The deal already cash-flows at list — no discount required.
- Meets the 1% rule at list price ($2k rent vs $169k).
- Cap rate 7.1% vs local median 3.1% in Houston — top-decile yield for the area; either an underpriced asset or a hidden risk that comps aren't pricing in. Stress-test before assuming the spread holds.
Location & tenants
- Location reads 74/100 on livability (#184 in TX, #4,771 nationally) — a middle-class / working-renter tenant base. Strengths: amenities A+, cost of living A+, housing A+; Watch: crime F.
- Houston ISD (urban): math 27% / reading 35% proficiency, ranked #593 of 826 in TX (top 72%) — families likely to look elsewhere, expect single-tenant / working-renter base with shorter leases; 71% free/reduced lunch — lower-income household profile, screen leases tightly.
- Zoned schools: Pershing Middle (math 36% / reading 49%, grade D-, #553 of 1,662 statewide, top 34%, 1,390 students, 60% FRL); Westbury H S (math 19% / reading 31%, grade F, #1,250 of 1,632 statewide, top 77%, 2,243 students, 92% FRL) — zoned schools at 76% FRL track the district average.
- Market conditions: Rents falling (-3.9%/yr); 230 active listings in the ZIP; 40 comparable units currently listed for rent nearby; rentals leasing fast (median 12d on market — plan ~1-2 weeks tenant-placement turnaround); solid renter incomes; 29,883 units permitted in Harris County in 2024 (8,621 in 5+ unit buildings).
Forward outlook
- Local home prices are declining (-3.0%/yr); year-one equity from $1k of loan paydown is wiped out by about $5k of value loss. Plan a longer hold.
- Harris County population projected at +47% by 2050 — long-run rental-demand tailwind backs the buy-and-hold thesis.
Negotiation context
- Only 12 days on market — expect competitive offers; lowballing is unlikely to land.
Risks & watch-outs
- Watch-outs: property tax is 3.2% of price; built in 1952 — expect roof / HVAC / electrical / plumbing capex.
- Climate carrying-cost: severe wind risk, 99% chance of damaging wind over 30y; extreme-heat days projected 7→24/yr by 2055 (HVAC capex compounding) — expect insurance premiums to compound above CPI over the hold.
Questions for the listing agent
- Built in 1952 — when were the roof, HVAC, electrical panel, plumbing, and water heater last replaced?
- Property tax is high relative to price — has the assessment been appealed recently, and will the sale trigger a re-assessment?
- Is there a deadline driving the sale (1031 exchange, divorce, estate, relocation)? That informs how much negotiation room exists.
- Schools are D-rated, which usually means shorter tenancies and higher turnover. Who's the typical renter profile here, and what's been the actual vacancy rate?
- Crime grade is F in this area — have there been break-ins, vandalism, or insurance claims at this property in the last 3 years? What carrier currently insures it and at what premium?
- What's the average days-on-market for RENTAL listings here right now (not sales)? A rising rental-DOM trend means longer vacancies and softer asking-rent achievability than the comps imply.
- What's the recent tenant-quality profile in this submarket — average credit score on applications, eviction rate, late-payment / NSF rate, and stable-employment percentage? A property-management company in the area should have these aggregated.
- How much new for-sale + rental construction is in the pipeline within 1–3 miles? Heavy new supply typically softens prices + rents 12–24 months out; constrained supply supports both.
Investment metrics
- 1% rule
- 1.14% ✓
- Cap rate
- 7.06%
- Cash-on-cash
- 2.74%
- DSCR
- 1.12
- GRM
- 7.3
CMA / ARV
- ARV (median comp)
- $275,187
- List price
- $169,000
- Delta
- -38.59%
- Verdict
- UNDERPRICED
- Comps
- 20 within 1.0 mi
Show comp detail 12 sales within ~0.75 mi
| Address | Dist | Beds/Ba | Sqft | Sold | Price | $/sf | Match |
|---|---|---|---|---|---|---|---|
| 4010 Woodhaven St | 0.00mi | 3/2.5 | 1,531 (0%) | 0mo | $169,000 | $110 | 100 |
| 3913 Willowbend Point Dr | 0.09mi | 3/2.5 | 1,511 (-1%) | 2mo | $339,900 | $225 | 92 |
| 3911 Willowbend Point Dr | 0.09mi | 3/2.5 | 1,588 (+4%) | 1mo | $349,900 | $220 | 89 |
| 4030 Woodshire St St | 0.13mi | 3/2.0 | 1,411 (-8%) | 6mo | $385,000 | $273 | 74 |
| 3719 Main Aspen Dr | 0.28mi | 3/2.5 | 1,716 (+12%) | 2mo | $270,000 | $157 | 65 |
| 4106 Woodfin St | 0.20mi | 3/2.0 | 1,309 (-14%) | 2mo | $265,000 | $202 | 62 |
| 4021 Osby | 0.69mi | 3/1.5 | 1,553 (+1%) | 5mo | $299,000 | $193 | 57 |
| 3208 Clearview Cir | 0.44mi | 2/2.5 (-1) | 1,704 (+11%) | 0mo | $279,900 | $164 | 55 |
| 3008 Clearview Cir | 0.43mi | 3/3.5 | 1,734 (+13%) | 5mo | $299,850 | $173 | 49 |
| 4125 Lymbar Dr | 0.66mi | 3/3.0 | 1,729 (+13%) | 1mo | $389,000 | $225 | 45 |
| 4325 Willowbend Blvd | 0.62mi | 3/2.0 | 1,757 (+15%) | 0mo | $449,000 | $256 | 44 |
| 4302 Hummingbird St | 0.64mi | 3/2.0 | 1,737 (+14%) | 5mo | $429,500 | $247 | 42 |
Match score weights: distance 35% · size 25% · config 20% · recency 20%. Top-matched comps best support the ARV.
Projected returns pro-forma
-3.0% appreciation · 0.0% rent growth · sell at horizon
- IRR
- -16.0%
- Equity multiple
- 0.45×
- Total profit
- $-25,966
- Equity at exit
- $25,198
- IRR
- -15.5%
- Equity multiple
- 0.26×
- Total profit
- $-34,798
- Equity at exit
- $14,612
Cash invested: $47,320 (down + closing). Projections, not guarantees.
Landlord ↔ Tenant lean methodology
- Overall (STATE)
- 87 Strongly Landlord-Friendly
- State Texas
- 87 Strongly Landlord-Friendly · R+5
- County
- — inherits STATE
- City
- — inherits STATE
ZIP-level market 77025
- Rents YoY
- -3.9%
- Active inventory
- 230
- Price-to-rent
- 7.3×
Monthly cashflow live
- Estimated rent
- $1,921 high interval (Pro) →
- Mortgage (P&I)
- −$886
- Tax from tax record
- −$453 /mo · $5,438/yr
- Insurance
- −$70
- HOA
- −$0
- Vacancy / Maint / Mgmt
- −$403
- Net cashflow
- $108
Break-even live
Sensitivity live
| Price | -10% $204 | -5% $156 | +0% $108 | +5% $60 | +10% $12 |
|---|---|---|---|---|---|
| Rent | -10% $-44 | -5% $32 | +0% $108 | +5% $184 | +10% $260 |
| Rate | -1.0pp $193 | -0.5pp $151 | base $108 | +0.5pp $64 | +1.0pp $20 |
UW: 25.0% down · 7.5% · 30yr · 1.5% tax · 5.0% vac · 8.0% maint · 8.0% mgmt
Financing live
Cash to close
- Down payment
- $42,250
- Closing costs
- $5,070
- Reserves months
- —
- Total cash needed
- —
Loan-product check · same deal, 3 products live
Conventional
25% down · 7.5% · 30yr
- Down + closing
- —
- Monthly P&I
- —
- Monthly cashflow
- —
- DSCR
- —
- Eligible?
- —
Personal DTI + credit; lowest rate.
DSCR
20% down · 8.5% · 30yr
- Down + closing
- —
- Monthly P&I
- —
- Monthly cashflow
- —
- DSCR
- —
- Eligible?
- —
No personal income docs; deal must DSCR.
Hard money
10% down · 12.0% · 12mo
- Down + closing
- —
- Monthly P&I
- —
- Monthly cashflow
- —
- DSCR
- —
- Eligible?
- —
Short-term bridge; refi at stabilization.
Rent comps 40 comps
| Address | Beds | Baths | Sqft | Rent | $/sqft | DOM | Units | Dist |
|---|---|---|---|---|---|---|---|---|
| 16 Charleston Park Dr Houston, TX | 1.0–3.0 | 1.0–2.0 | 1100 | $1,800 | $1.64 | 44d | 1 | 0.28mi |
| 3707 Main Poplar Dr Houston, TX | 3.0 | 2.5 | 1714 | $1,999 | $1.17 | 44d | 1 | 0.34mi |
| 3627 Main Plaza Dr Houston, TX | 3.0 | 2.5 | 2014 | $2,200 | $1.09 | 8d | 1 | 0.39mi |
| 11504 Main Elm Dr Houston, TX | 3.0 | 2.5 | 2042 | $2,450 | $1.20 | 6d | 1 | 0.41mi |
| 11504 Main Elm Dr Houston, TX | 3.0 | 2.5 | 2042 | $2,450 | $1.20 | 8d | 1 | 0.41mi |
| 22 Charleston Park Dr Houston, TX | 2.0 | 2.0 | 1095 | $1,109 | $1.01 | 44d | 1 | 0.42mi |
| 4010 W Bellfort Ave Houston, TX | 1.0–3.0 | 1.0–2.0 | 867 | $1,549 | $1.79 | 4d | 14 | 0.53mi |
| 10408 Marston Vineyard Dr Houston, TX | 3.0 | 2.5 | 1671 | $2,599 | $1.56 | 25d | 1 | 0.63mi |
| 3131 W Bellfort Ave Unit 2174 Houston, TX | 2.0 | 2.0 | 1164 | $1,938 | $1.66 | 11d | 1 | 0.74mi |
| 3131 W Bellfort Ave Unit 3168 Houston, TX | 2.0 | 2.0 | 1164 | $1,914 | $1.64 | 16d | 1 | 0.74mi |
| 3131 W Bellfort Ave Unit 425 Houston, TX | 2.0 | 2.0 | 1164 | $1,944 | $1.67 | 0d | 1 | 0.74mi |
| 3131 W Bellfort Ave Apt 422 Houston, TX | 2.0 | 2.0 | 1164 | $1,914 | $1.64 | 8d | 1 | 0.74mi |
| 3131 W Bellfort Ave Unit 424 Houston, TX | 2.0 | 2.0 | 1164 | $1,914 | $1.64 | 6d | 1 | 0.77mi |
| 10191 S Main St Houston, TX | 1.0–2.0 | 1.0–2.0 | 961 | $2,110 | $2.20 | 0d | 136 | 0.89mi |
| 9707 Timberside Dr Houston, TX | 1.0–3.0 | 1.0–2.0 | 968 | $1,740 | $1.80 | 8d | 7 | 0.91mi |
| 9707 Timberside Dr Houston, TX | 1.0–3.0 | 1.0–2.0 | 967 | $1,700 | $1.76 | 12d | 11 | 0.91mi |
| 10301 Buffalo Speedway Houston, TX | 1.0–3.0 | 1.0–2.0 | 1027 | $2,103 | $2.05 | 0d | 19 | 0.92mi |
| 10201 Buffalo Speedway Unit 2165 Houston, TX | 2.0 | 2.0 | 1110 | $1,744 | $1.57 | 0d | 1 | 1.00mi |
| 10201 Buffalo Speedway Unit 3165 Houston, TX | 3.0 | 2.0 | 1523 | $2,080 | $1.37 | 0d | 1 | 1.00mi |
| 10201 Buffalo Speedway Unit 3047 Houston, TX | 3.0 | 2.0 | 1523 | $1,917 | $1.26 | 19d | 1 | 1.02mi |
| 10301 Buffalo Speedway Unit 3112 Houston, TX | 3.0 | 2.0 | 1420 | $1,967 | $1.39 | 0d | 1 | 1.07mi |
| 10301 Buffalo Speedway Unit 3174 Houston, TX | 3.0 | 2.0 | 1420 | $1,961 | $1.38 | 11d | 1 | 1.07mi |
| 10301 Buffalo Speedway Unit 10334 Houston, TX | 3.0 | 2.0 | 1420 | $1,975 | $1.39 | 44d | 1 | 1.07mi |
| 10201 Buffalo Speedway Unit 10224 Houston, TX | 2.0 | 2.0 | 1110 | $1,738 | $1.57 | 11d | 1 | 1.13mi |
| 10201 Buffalo Speedway Unit 425 Houston, TX | 2.0 | 2.0 | 1110 | $1,714 | $1.54 | 8d | 1 | 1.13mi |
| 10201 Buffalo Speedway Unit 2162 Houston, TX | 2.0 | 2.0 | 1110 | $1,714 | $1.54 | 6d | 1 | 1.13mi |
| 10201 Buffalo Speedway Unit 10234 Houston, TX | 3.0 | 2.0 | 1523 | $2,074 | $1.36 | 11d | 1 | 1.13mi |
| 9306 Bassoon Dr Houston, TX | 4.0 | 2.0 | 1824 | $9,750 | $5.35 | 44d | 1 | 1.13mi |
| 9306 Bassoon Dr Unit 1024979P Houston, TX | 4.0 | 2.0 | 1819 | $13,361 | $7.35 | 44d | 1 | 1.13mi |
| 9016 Bayview Cove Dr Houston, TX | 3.0 | 3.0 | 2245 | $4,200 | $1.87 | 19d | 1 | 1.18mi |
| 9955 Buffalo Speedway Houston, TX | 1.0–3.0 | 1.0–2.0 | 874 | $1,949 | $2.23 | 0d | 16 | 1.20mi |
| 4833 Hazelton St Houston, TX | 3.0 | 2.0 | 1525 | $1,200 | $0.79 | 44d | 1 | 1.26mi |
| 9550 Meyer Forest Dr Houston, TX | 1.0–3.0 | 1.0–3.5 | 1597 | $2,691 | $1.69 | 0d | 21 | 1.28mi |
| 9111 Lakes at 610 Dr Unit 3112 Houston, TX | 3.0 | 2.0 | 1157 | $1,989 | $1.72 | 0d | 1 | 1.29mi |
| 9111 Lakes at 610 Dr Unit 3174 Houston, TX | 3.0 | 2.0 | 1157 | $1,983 | $1.71 | 11d | 1 | 1.29mi |
| 9111 Lakes at 610 Dr Unit 9144 Houston, TX | 3.0 | 2.0 | 1157 | $1,660 | $1.43 | 44d | 1 | 1.29mi |
| 12115 S Main St Unit 422 Houston, TX | 2.0 | 2.0 | 1174 | $1,590 | $1.35 | 8d | 1 | 1.37mi |
| 12115 S Main St Unit 12138 Houston, TX | 2.0 | 2.0 | 1174 | $1,664 | $1.42 | 13d | 1 | 1.37mi |
| 12115 S Main St Unit 2187 Houston, TX | 2.0 | 2.0 | 1174 | $1,620 | $1.38 | 0d | 1 | 1.37mi |
| 12115 S Main St Unit 2174 Houston, TX | 2.0 | 2.0 | 1174 | $1,625 | $1.38 | 11d | 1 | 1.37mi |
Listing history 3 events
-
2026-05-08$169,000 Active 342-char remark
-
2026-04-27soldstatus $189,900
-
1993-08-13soldstatus
ⓘ Source: listings_history table (triggers on properties + properties_extension) + one-shot
backfill from property_details.listing_events for pre-trigger history.
Tax reassessment forecast TX · Resets to sale price
- Current annual tax
- $5,438 · $453/mo
- Projected year-2 tax
- $5,438 · $453/mo
- Expected delta
- $0/yr ($0/mo · 0.0%)
ⓘ Screening estimate from a state-policy table — verify with the county assessor before closing.
Climate risk First Street
- Flood 1/10 Low FEMA zone X (unshaded) · 0% chance over 30 yrs
- Wildfire 3/10 Moderate
- Heat 9/10 Extreme 7 d/yr ≥110°F today · 24 d/yr by 30 yrs out
- Wind 9/10 Extreme 99% chance of damaging wind over 30 yrs
- Air quality 2/10 Low 2 unhealthy d/yr today · 2 by 30 yrs out
Nearby sold comps map
Loading sold comps map…
Walkable amenities ~0.75 mi
Loading nearby amenities…
Taxation est. · year 1
- Rental income
- $23,054
- − Mortgage interest
- −$9,467
- − Property taxes
- −$5,438
- − Insurance
- −$845
- − Repairs & maintenance
- −$1,844
- − Management
- −$1,844
- − Depreciation
- −$4,916
- Taxable loss
- −$1,300
- Est. tax savings @ 24.0%
- +$312
- After-tax cash flow
- $1,607/yr
For passive investors: Depreciation is non-cash, so a rental often shows a tax loss while cash-flowing — sheltering income. Rental losses are passive: they offset passive income freely, and up to $25,000/yr can offset ordinary (W-2) income if you actively participate and your MAGI is under $100k (phasing out to $0 by $150k); unused losses carry forward. On sale, claimed depreciation is recaptured at up to 25%, and gains may owe capital-gains tax (a 1031 exchange can defer both). Figures are a year-1 estimate at your 24.0% rate — not tax advice; consult a CPA.
Schools (NCES district)
- District
- Houston ISD
- NCES district ID
- 4823640
- Math proficiency
- 27% ▼ -18.00%
- Reading proficiency
- 35% ▼ -6.00%
- Median HH income
- $46,054
- Composite
- 26.63/100
- National rank
- #7173
- State rank
- #593 of 826 in TX
Livability — Houston
- Score
- 74/100
- State rank
- #184
- US rank
- #4771
Category grades
Schools grade is shown separately in the Schools card above.
Census & demographics
- Census place
- Houston, TX
- County
- Harris County · 4,702,590 people
- City population
- 3,226,434
- Metro
- Houston-The Woodlands-Sugar Land, TX
- Population (ZIP)
- 29,715
- Household income
- $81,008
- Rent vs Own
- Severe rent burden
- 2502.0
Population outlook (Harris County) Hauer SSP2
- Today (2025)
- 5,571,493 people
- By 2030
- 6,089,821 · +9.3%
- By 2040
- 7,142,806 · +28.2%
- By 2050
- 8,185,864 · +46.9%
- By 2075
- 10,574,329 · +89.8%
- By 2100
- 12,109,958 · +117.4%
Race, ethnicity, and origin ACS 2023
- Neighborhood character
- Highly diverse neighborhood (Simpson 0.74)
- Race & ethnicity
- White 42% Hispanic / Latino 20% Asian 17% Black 15% Two or more races 13% Native American 1%
- Hispanic origin (detail)
- Mexican 11%
- Common ancestry
- Slovak 3% Lithuanian 2% Romanian 2%
- Foreign-born
- 29% · Canada, China, Vietnam
- Languages at home
- 60% English-only · Spanish 16% Other Indo-European 7% Chinese 6%
Political lean MEDSL · Harris
- 2024 margin
- Lean D (+5.5) · D 52.0% · R 46.4% · Other 1.6%
- 2008→2024 swing
- +3.9pp toward D · 2008: 1.6pp · 2024: 5.5pp
- All cycles
- 2024: D+5.5 2020: D+13.3 2016: D+12.4 2012: D+0.1 2008: D+1.6
Not yet ingested
- Civics
- —
Market trends
- HPI YoY
- ▼ -363.31%
- Current HPI
- 187.5872
- Rent YoY
- ▼ -3.93%
- Metro
- Houston-The Woodlands-Sugar Land, TX
- State GDP YoY
- ▲ 3.95%
- F500 in state
- 110
Industry mix (Fortune 500 HQ in TX)
| Industry | F500 HQs | Revenue |
|---|---|---|
| Energy | 16 | $1,198B |
|
||
| Technology | 5 | $198B |
|
||
| Engineering / Construction | 4 | $72B |
|
||
| Energy Services | 3 | $60B |
|
||
| Utilities | 3 | $41B |
|
||
| Healthcare | 2 | $330B |
|
||
Price history
-11.0% since first listed5 events — show timeline
- 2026-06-09 Sold (MLS) — HARMLS
- 2026-05-20 Pending — HARMLS
- 2026-05-08 Listed $169,000 HARMLS
- 2026-04-27 Sold (Public Records) $189,900 Public Records
- 1993-08-13 Sold (Public Records) — Public Records
Property tax history
+6.3%/yrLatest (2025): $5,438 · -2.6% YoY. Source: county tax records.
Cash-flow waterfall
monthlySold comps — $/sqft
last 12 mo · ≤1 miLoading sold comps…