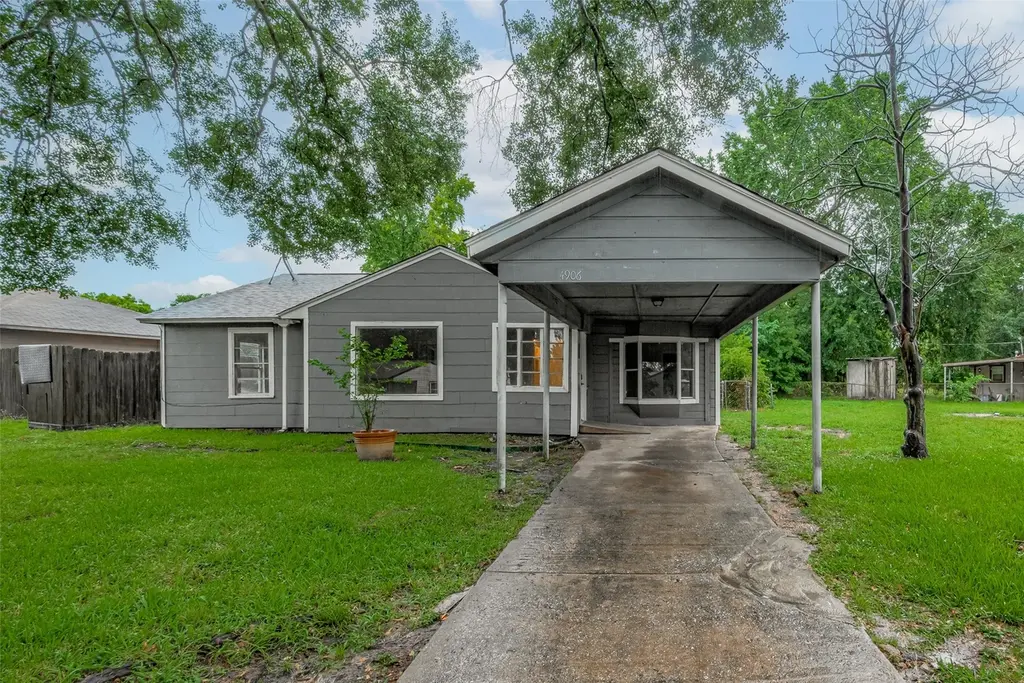
4906 Larkspur St · Houston, TX
Flood risk 1/10 · Minimal
- FEMA flood zone
- X (unshaded)
- Chance of flooding over 30 yrs
- 0.0%
- Est. flood insurance / yr
- $507 – $1,088
Fire risk 1/10 · Minimal
- Est. fire insurance / yr
- $1,222 – $2,270
Heat risk 9/10 · Severe
- Hot days now (above 109°F)
- 7 days/yr
- Hot days in 30 yrs
- 21 days/yr
Wind risk 9/10 · Severe
- Chance of severe wind over 30 yrs
- 99.0%
Air-quality risk 2/10 · Minimal
- Unhealthy air days now
- 2 days/yr
- Unhealthy air days in 30 yrs
- 2 days/yr
Risk factors via First Street. Map © Google.
Why this score? — see what drove the F grade
The composite is a weighted blend of 9 inputs, each scored 0–100. Each bar is that input's sub-score; the figure is the points it added to the 100-point composite (weight × sub-score).
- ARV discount +11.7/15.0
- Cash flow +7.1/30.0
- Rent growth +3.9/5.0
- Livability +3.7/5.0
- Schools +2.7/10.0
- Condition / age +2.5/5.0
- 1% rule +1.8/10.0
- DSCR +1.3/10.0
- Appreciation +0.0/10.0
$180,000
🖨 Deal sheet 📄 Offer letter ✓ Due diligence
Listing remarks MLS
The home is tenant occupied and perfect for an investor looking for tenant-occupied properties. Located in central Houston, 4906 Larkspur St offers excellent access to major destinations across the city. The property is just minutes from Downtown Houston, the Texas Medical Center, and the University of Houston, making it a strong option for both homeowners and investors. With convenient access to Highway 288, I-45, and Loop 610, commuting throughout Houston is simple and efficient. The surrounding area continues to see growth and redevelopment, adding long-term potential to this centrally located property.
Key facts
- Central houston
- I-45
- Texas medical center
Tags
Neighborhood map
What this means for you Summary
Snapshot
- This is a 2-bed/1.0-bath single-family listed at $180k.
Deal economics
- At list price, monthly cash flow is $-254 ($-3k/yr) — negative.
- To cash-flow at today's rent, offer at most $135k (25.0% below list).
- To meet the 1% rule (rent ≥ 1% of price), the offer needs to be $122k (32.3% below list).
- Recommended offer: $122k (32.3% below list) — sets the bar for 1% rule.
- Cap rate 4.6% vs local median 3.2% in Houston — top-decile yield for the area; either an underpriced asset or a hidden risk that comps aren't pricing in. Stress-test before assuming the spread holds.
Location & tenants
- Location reads 74/100 on livability (#184 in TX, #4,771 nationally) — a middle-class / working-renter tenant base. Strengths: amenities A+, cost of living A+, housing A+; Watch: schools D, crime F.
- Houston ISD (urban): math 27% / reading 35% proficiency, ranked #593 of 826 in TX (top 72%) — families likely to look elsewhere, expect single-tenant / working-renter base with shorter leases; 71% free/reduced lunch — lower-income household profile, screen leases tightly.
- Market conditions: Rents rising fast (+5.5%/yr); 338 active listings in the ZIP; 20 comparable units currently listed for rent nearby; rentals at typical pace (median 24d on market — plan ~3-4 weeks tenant-placement turnaround); lower-income renter base — watch delinquency; 29,883 units permitted in Harris County in 2024 (8,621 in 5+ unit buildings).
- This rent runs 38% of the median local income ($38k/yr) — at the standard rent-burdened threshold; future hikes will face affordability resistance.
Forward outlook
- Local home prices are declining (-3.0%/yr); year-one equity from $1k of loan paydown is wiped out by about $5k of value loss. Plan a longer hold.
- Harris County population projected at +47% by 2050 — long-run rental-demand tailwind backs the buy-and-hold thesis.
Negotiation context
- It's been on market 107 days — a 9% lower offer ($164k) is reasonable based on typical stale-listing flexibility.
- 10 sale attempts with the ask held roughly flat each time — persistent listings suggest the price (not the market) is what's stuck; bring a comps-based counter.
Risks & watch-outs
- Watch-outs: built in 1950 — expect roof / HVAC / electrical / plumbing capex.
- Climate carrying-cost: severe wind risk, 99% chance of damaging wind over 30y; extreme-heat days projected 7→21/yr by 2055 (HVAC capex compounding) — expect insurance premiums to compound above CPI over the hold.
Questions for the listing agent
- What do current leases actually rent for vs. the listed asking? Can we see a recent rent roll and the last 12 months of T-12 income?
- It's been on market 107 days. Have you received any prior offers? Is the seller open to a 32% concession, seller financing, or rate buy-down credit?
- Built in 1950 — when were the roof, HVAC, electrical panel, plumbing, and water heater last replaced?
- Why hasn't it sold? Are there any deal-killer items the seller is aware of (foundation, flood, title, zoning, code violations)?
- Is there a deadline driving the sale (1031 exchange, divorce, estate, relocation)? That informs how much negotiation room exists.
- Schools are D-rated, which usually means shorter tenancies and higher turnover. Who's the typical renter profile here, and what's been the actual vacancy rate?
- Crime grade is F in this area — have there been break-ins, vandalism, or insurance claims at this property in the last 3 years? What carrier currently insures it and at what premium?
- The area grade is low — what's the realistic commute time and amenity access for the typical tenant pool here? Any planned neighborhood developments (good or bad) we should know about?
- What's the average days-on-market for RENTAL listings here right now (not sales)? A rising rental-DOM trend means longer vacancies and softer asking-rent achievability than the comps imply.
- What's the recent tenant-quality profile in this submarket — average credit score on applications, eviction rate, late-payment / NSF rate, and stable-employment percentage? A property-management company in the area should have these aggregated.
- How much new for-sale + rental construction is in the pipeline within 1–3 miles? Heavy new supply typically softens prices + rents 12–24 months out; constrained supply supports both.
Investment metrics
- 1% rule
- 0.68% ✗
- Cap rate
- 4.60%
- Cash-on-cash
- -6.05%
- DSCR
- 0.73
- GRM
- 12.3
CMA / ARV
- ARV (median comp)
- $198,351
- List price
- $180,000
- Delta
- -9.25%
- Verdict
- FAIR
- Comps
- 20 within 1.0 mi
Show comp detail 12 sales within ~0.75 mi
| Address | Dist | Beds/Ba | Sqft | Sold | Price | $/sf | Match |
|---|---|---|---|---|---|---|---|
| 8130 Rockford Dr | 0.46mi | 3/1.0 (+1) | 945 (-0%) | 9mo | $169,999 | $180 | 65 |
| 4917 Higgins St | 0.51mi | 2/1.0 | 900 (-5%) | 3mo | $75,000 | $83 | 65 |
| 4629 Larkspur St | 0.46mi | 3/1.0 (+1) | 892 (-6%) | 1mo | $75,000 | $84 | 63 |
| 5622 Beldart St | 0.62mi | 2/1.0 | 1,002 (+6%) | 1mo | $120,000 | $120 | 60 |
| 8426 Rockford Dr | 0.42mi | 3/1.5 (+1) | 875 (-8%) | 1mo | $100,000 | $114 | 60 |
| 4929 Paula St | 0.45mi | 3/1.0 (+1) | 989 (+4%) | 13mo | $175,000 | $177 | 56 |
| 4637 Carmen St | 0.52mi | 2/1.0 | 1,084 (+14%) | 1mo | $135,000 | $125 | 51 |
| 4429 Galesburg St | 0.72mi | 2/1.0 | 983 (+4%) | 13mo | $175,000 | $178 | 50 |
| 5218 Higgins St | 0.66mi | 2/1.0 | 852 (-10%) | 9mo | $99,000 | $116 | 45 |
| 4522 Larkspur St | 0.59mi | 3/2.0 (+1) | 1,040 (+10%) | 7mo | $155,000 | $149 | 42 |
| 5007 Northridge Dr | 0.67mi | 3/1.0 (+1) | 1,069 (+13%) | 2mo | $163,900 | $153 | 41 |
| 8525 Dosia St | 0.68mi | 3/2.0 (+1) | 842 (-11%) | 0mo | $129,900 | $154 | 40 |
Match score weights: distance 35% · size 25% · config 20% · recency 20%. Top-matched comps best support the ARV.
Projected returns pro-forma
-3.0% appreciation · 5.45% rent growth · sell at horizon
- IRR
- -24.1%
- Equity multiple
- 0.16×
- Total profit
- $-42,282
- Equity at exit
- $26,839
- IRR
- -13.8%
- Equity multiple
- 0.12×
- Total profit
- $-44,385
- Equity at exit
- $15,563
Cash invested: $50,400 (down + closing). Projections, not guarantees.
Landlord ↔ Tenant lean methodology
- Overall (STATE)
- 87 Strongly Landlord-Friendly
- State Texas
- 87 Strongly Landlord-Friendly · R+5
- County
- — inherits STATE
- City
- — inherits STATE
ZIP-level market 77033
- Home prices YoY
- -16.3%
- Rents YoY
- 5.5%
- Active inventory
- 338
- Price-to-rent
- 12.3×
Monthly cashflow live
- Estimated rent
- $1,219 high interval (Pro) →
- Mortgage (P&I)
- −$944
- Tax from tax record
- −$198 /mo · $2,376/yr
- Insurance
- −$75
- HOA
- −$0
- Vacancy / Maint / Mgmt
- −$256
- Net cashflow
- $-254
Break-even live
UW: 25.0% down · 7.5% · 30yr · 1.5% tax · 5.0% vac · 8.0% maint · 8.0% mgmt
Financing live
Cash to close
- Down payment
- $45,000
- Closing costs
- $5,400
- Reserves months
- —
- Total cash needed
- —
Loan-product check · same deal, 3 products live
Conventional
25% down · 7.5% · 30yr
- Down + closing
- —
- Monthly P&I
- —
- Monthly cashflow
- —
- DSCR
- —
- Eligible?
- —
Personal DTI + credit; lowest rate.
DSCR
20% down · 8.5% · 30yr
- Down + closing
- —
- Monthly P&I
- —
- Monthly cashflow
- —
- DSCR
- —
- Eligible?
- —
No personal income docs; deal must DSCR.
Hard money
10% down · 12.0% · 12mo
- Down + closing
- —
- Monthly P&I
- —
- Monthly cashflow
- —
- DSCR
- —
- Eligible?
- —
Short-term bridge; refi at stabilization.
Rent comps 20 comps
| Address | Beds | Baths | Sqft | Rent | $/sqft | DOM | Units | Dist |
|---|---|---|---|---|---|---|---|---|
| 5042 Mallow St Houston, TX | 2.0 | 1.0 | 672 | $995 | $1.48 | 5d | 1 | 0.26mi |
| 5010 Carmen St Houston, TX | 2.0 | 1.0 | 672 | $1,095 | $1.63 | 43d | 1 | 0.37mi |
| 5038 Carmen St Apt 1 Houston, TX | 2.0 | 1.0 | 672 | $1,095 | $1.63 | 3d | 1 | 0.40mi |
| 4923 Paula St Apt 2 Houston, TX | 2.0 | 1.0 | 672 | $1,095 | $1.63 | 3d | 1 | 0.46mi |
| 7918 Jutland Rd Houston, TX | 3.0 | 1.0 | 996 | $1,295 | $1.30 | 43d | 1 | 0.58mi |
| 5314 Northridge Dr Unit A Houston, TX | 3.0 | 2.0 | 872 | $1,185 | $1.36 | 43d | 1 | 0.67mi |
| 8521 Dosia St Houston, TX | 3.0 | 2.0 | 1028 | $1,665 | $1.62 | 12d | 1 | 0.67mi |
| 4326 Larkspur St Unit 3 Houston, TX | 2.0 | 1.0 | 800 | $1,200 | $1.50 | 16d | 1 | 0.81mi |
| 7818 Calhoun Rd Unit 8 Houston, TX | 2.0 | 1.0 | 800 | $1,200 | $1.50 | 43d | 1 | 0.84mi |
| 4609 Bricker St Unit C Houston, TX | 2.0 | 1.5 | 1100 | $3,200 | $2.91 | 12d | 1 | 0.85mi |
| 4410 Bellfort Ave Unit 4404 8 Houston, TX | 2.0 | 1.0 | 812 | $999 | $1.23 | 7d | 1 | 0.85mi |
| 4615 Redbud St Unit b Houston, TX | 3.0 | 2.0 | 872 | $1,149 | $1.32 | 24d | 1 | 0.89mi |
| 4207 Phlox St Unit 1 BEDROOM 4 Houston, TX | 1.0 | 1.0 | 650 | $660 | $1.02 | 43d | 1 | 0.90mi |
| 4207 Phlox St Houston, TX | 2.0 | 1.0 | 736 | $962 | $1.31 | 1d | 1 | 0.90mi |
| 4205 Phlox St Unit 2 BEDROOM 6 Houston, TX | 2.0 | 1.0 | 736 | $860 | $1.17 | 18d | 1 | 0.93mi |
| 4205 Grassmere St Houston, TX | 1.0 | 1.0 | 680 | $800 | $1.18 | 43d | 1 | 1.13mi |
| 4205 Grassmere St Houston, TX | 2.0 | 1.0 | 824 | $900 | $1.09 | 24d | 1 | 1.13mi |
| 9414 Heno St Unit 13 Houston, TX | 2.0 | 1.0 | 824 | $900 | $1.09 | 24d | 1 | 1.19mi |
| 4112 Grassmere St Houston, TX | 2.0 | 1.0 | 711 | $700 | $0.98 | 10d | 1 | 1.19mi |
| 7823 Gladstone St Houston, TX | 2.0 | 2.0 | 850 | $1,600 | $1.88 | 43d | 1 | 1.50mi |
Listing history 35 events
-
2026-06-18days on market $180,000 Active 107 DOM
-
2026-06-17days on market $180,000 Active 106 DOM
-
2026-06-16days on market $180,000 Active 105 DOM
-
2026-06-15days on market $180,000 Active 104 DOM
-
2026-06-13days on market $180,000 Active 102 DOM
-
2026-06-10days on market $180,000 Active 98 DOM
-
2026-06-08days on market $180,000 Active 97 DOM
-
2026-06-07days on market $180,000 Active 96 DOM
-
2026-06-04days on market $180,000 Active 93 DOM
-
2026-06-01days on market $180,000 Active 90 DOM
-
2026-05-31days on market $180,000 Active 89 DOM
-
2026-05-09price $180,000 613-char remark
Show marketing remark (613 chars)
The home is tenant occupied and perfect for an investor looking for tenant-occupied properties. Located in central Houston, 4906 Larkspur St offers excellent access to major destinations across the city. The property is just minutes from Downtown Houston, the Texas Medical Center, and the University of Houston, making it a strong option for both homeowners and investors. With convenient access to Highway 288, I-45, and Loop 610, commuting throughout Houston is simple and efficient. The surrounding area continues to see growth and redevelopment, adding long-term potential to this centrally located property.
-
2026-03-03$179,500 Active 613-char remark
Show marketing remark (613 chars)
The home is tenant occupied and perfect for an investor looking for tenant-occupied properties. Located in central Houston, 4906 Larkspur St offers excellent access to major destinations across the city. The property is just minutes from Downtown Houston, the Texas Medical Center, and the University of Houston, making it a strong option for both homeowners and investors. With convenient access to Highway 288, I-45, and Loop 610, commuting throughout Houston is simple and efficient. The surrounding area continues to see growth and redevelopment, adding long-term potential to this centrally located property.
-
2026-03-03historical
Show marketing remark (613 chars)
The home is tenant occupied and perfect for an investor looking for tenant-occupied properties. Located in central Houston, 4906 Larkspur St offers excellent access to major destinations across the city. The property is just minutes from Downtown Houston, the Texas Medical Center, and the University of Houston, making it a strong option for both homeowners and investors. With convenient access to Highway 288, I-45, and Loop 610, commuting throughout Houston is simple and efficient. The surrounding area continues to see growth and redevelopment, adding long-term potential to this centrally located property.
-
2026-01-15$185,000 Active
-
2026-01-14historical
-
2025-11-20price $180,000
-
2025-08-29historical $1,650
-
2025-08-15$1,650
-
2025-08-15historical $1,650
-
2025-07-18$1,650
-
2025-07-17historical $1,700
-
2025-07-08$1,700
-
2025-07-08historical $1,700
-
2025-07-01$1,700
-
2025-06-30historical $1,700
-
2025-06-26$1,700
-
2025-06-25historical $1,700
-
2025-06-09$190,000 Active
-
2025-05-22$1,700
-
2025-05-22historical $1,700
-
2025-05-21$1,700
-
2020-02-17soldstatus
-
2003-01-02soldstatus
-
1997-06-24soldstatus
ⓘ Source: listings_history table (triggers on properties + properties_extension) + one-shot
backfill from property_details.listing_events for pre-trigger history.
Tax reassessment forecast TX · Resets to sale price
- Current annual tax
- $2,376 · $198/mo
- Projected year-2 tax
- $3,294 · $274/mo
- Expected delta
- +$918/yr (+$76/mo · 38.6%)
ⓘ Screening estimate from a state-policy table — verify with the county assessor before closing.
Climate risk First Street
- Flood 1/10 Low FEMA zone X (unshaded) · 0% chance over 30 yrs
- Wildfire 1/10 Low
- Heat 9/10 Extreme 7 d/yr ≥109°F today · 21 d/yr by 30 yrs out
- Wind 9/10 Extreme 99% chance of damaging wind over 30 yrs
- Air quality 2/10 Low 2 unhealthy d/yr today · 2 by 30 yrs out
Nearby sold comps map
Loading sold comps map…
Walkable amenities ~0.75 mi
Loading nearby amenities…
Taxation est. · year 1
- Rental income
- $14,623
- − Mortgage interest
- −$10,083
- − Property taxes
- −$2,376
- − Insurance
- −$900
- − Repairs & maintenance
- −$1,170
- − Management
- −$1,170
- − Depreciation
- −$5,236
- Taxable loss
- −$6,312
- Est. tax savings @ 24.0%
- +$1,515
- After-tax cash flow
- $-1,536/yr
For passive investors: Depreciation is non-cash, so a rental often shows a tax loss while cash-flowing — sheltering income. Rental losses are passive: they offset passive income freely, and up to $25,000/yr can offset ordinary (W-2) income if you actively participate and your MAGI is under $100k (phasing out to $0 by $150k); unused losses carry forward. On sale, claimed depreciation is recaptured at up to 25%, and gains may owe capital-gains tax (a 1031 exchange can defer both). Figures are a year-1 estimate at your 24.0% rate — not tax advice; consult a CPA.
Schools (NCES district)
- District
- Houston ISD
- NCES district ID
- 4823640
- Math proficiency
- 27% ▼ -18.00%
- Reading proficiency
- 35% ▼ -6.00%
- Median HH income
- $46,054
- Composite
- 26.63/100
- National rank
- #7173
- State rank
- #593 of 826 in TX
Livability — Houston
- Score
- 74/100
- State rank
- #184
- US rank
- #4771
Category grades
Schools grade is shown separately in the Schools card above.
Census & demographics
- Census place
- Houston, TX
- County
- Harris County · 4,702,590 people
- City population
- 3,226,434
- Metro
- Houston-The Woodlands-Sugar Land, TX
- Population (ZIP)
- 29,154
- Household income
- $38,071
- Rent vs Own
- Severe rent burden
- 1728.0
Population outlook (Harris County) Hauer SSP2
- Today (2025)
- 5,571,493 people
- By 2030
- 6,089,821 · +9.3%
- By 2040
- 7,142,806 · +28.2%
- By 2050
- 8,185,864 · +46.9%
- By 2075
- 10,574,329 · +89.8%
- By 2100
- 12,109,958 · +117.4%
Race, ethnicity, and origin ACS 2023
- Neighborhood character
- Majority Black (55%)
- Race & ethnicity
- Black 55% Hispanic / Latino 43% Two or more races 17% Native American 1%
- Hispanic origin (detail)
- Mexican 35%
- Common ancestry
- Lithuanian 1%
- Foreign-born
- 18% · Canada
- Languages at home
- 61% English-only · Spanish 39%
Political lean MEDSL · Harris
- 2024 margin
- Lean D (+5.5) · D 52.0% · R 46.4% · Other 1.6%
- 2008→2024 swing
- +3.9pp toward D · 2008: 1.6pp · 2024: 5.5pp
- All cycles
- 2024: D+5.5 2020: D+13.3 2016: D+12.4 2012: D+0.1 2008: D+1.6
Not yet ingested
- Civics
- —
Market trends
- HPI YoY
- ▼ -41.49%
- Current HPI
- 212.6472
- Rent YoY
- ▲ 5.45%
- Metro
- Houston-The Woodlands-Sugar Land, TX
- State GDP YoY
- ▲ 3.95%
- F500 in state
- 110
Industry mix (Fortune 500 HQ in TX)
| Industry | F500 HQs | Revenue |
|---|---|---|
| Energy | 16 | $1,198B |
|
||
| Technology | 5 | $198B |
|
||
| Engineering / Construction | 4 | $72B |
|
||
| Energy Services | 3 | $60B |
|
||
| Utilities | 3 | $41B |
|
||
| Healthcare | 2 | $330B |
|
||
Price history
+10488.2% since first listed24 events — show timeline
- 2026-05-09 Price Changed $180,000 HARMLS
- 2026-03-03 Listing Removed — HARMLS
- 2026-03-03 Listed $179,500 HARMLS
- 2026-01-15 Listed $185,000 HARMLS
- 2026-01-14 Listing Removed — HARMLS
- 2025-11-20 Price Changed $180,000 HARMLS
- 2025-08-29 Rental Removed $1,650 HARMLS
- 2025-08-15 Listed for Rent $1,650 HARMLS
- 2025-08-15 Rental Removed $1,650 HARMLS
- 2025-07-18 Listed for Rent $1,650 HARMLS
- 2025-07-17 Rental Removed $1,700 HARMLS
- 2025-07-08 Listed for Rent $1,700 HARMLS
- 2025-07-08 Rental Removed $1,700 APPFOLIO
- 2025-07-01 Listed for Rent $1,700 APPFOLIO
- 2025-06-30 Rental Removed $1,700 HARMLS
- 2025-06-26 Listed for Rent $1,700 HARMLS
- 2025-06-25 Rental Removed $1,700 HARMLS
- 2025-06-09 Listed $190,000 HARMLS
- 2025-05-22 Listed for Rent $1,700 HARMLS
- 2025-05-22 Rental Removed $1,700 APPFOLIO
- 2025-05-21 Listed for Rent $1,700 APPFOLIO
- 2020-02-17 Sold (Public Records) — Public Records
- 2003-01-02 Sold (Public Records) — Public Records
- 1997-06-24 Sold (Public Records) — Public Records
Property tax history
+6.4%/yrLatest (2025): $2,376 · +1.6% YoY. Source: county tax records.
Cash-flow waterfall
monthlySold comps — $/sqft
last 12 mo · ≤1 miLoading sold comps…