 🏗️ New Construction
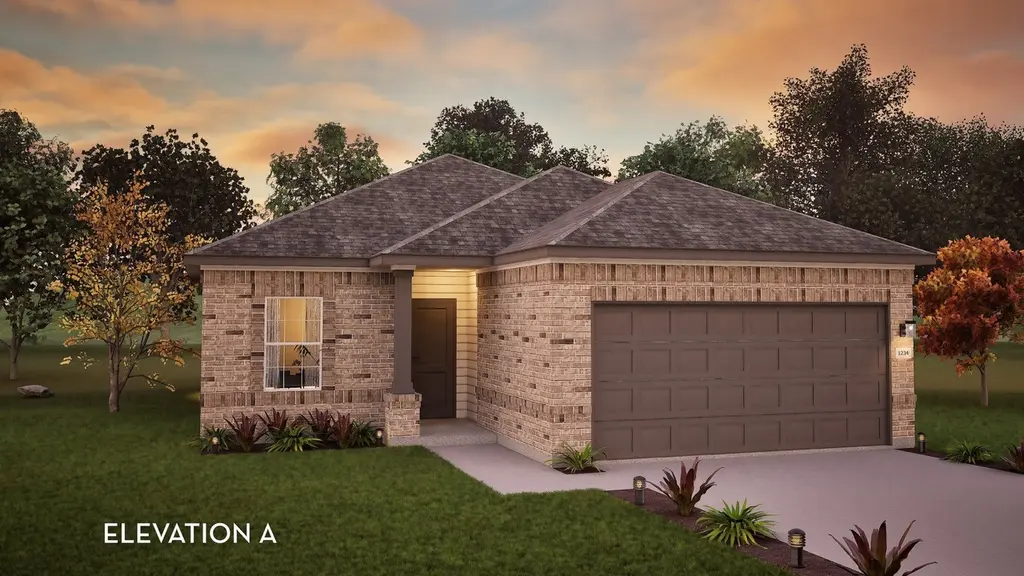
Comal Plan · Iowa Colony, TX
Flood risk 1/10 · Minimal
- FEMA flood zone
- X (unshaded)
- Chance of flooding over 30 yrs
- 0.0%
- Est. flood insurance / yr
- $507 – $1,088
Fire risk 6/10 · Moderate
- Est. fire insurance / yr
- $1,222 – $2,270
Heat risk 9/10 · Severe
- Hot days now (above 110°F)
- 7 days/yr
- Hot days in 30 yrs
- 23 days/yr
Wind risk 9/10 · Severe
- Chance of severe wind over 30 yrs
- 99.0%
Air-quality risk 3/10 · Minor
- Unhealthy air days now
- 2 days/yr
- Unhealthy air days in 30 yrs
- 3 days/yr
Risk factors via First Street. Map © Google.
Why this score? — see what drove the F grade
The composite is a weighted blend of 9 inputs, each scored 0–100. Each bar is that input's sub-score; the figure is the points it added to the 100-point composite (weight × sub-score).
- Cash flow +8.3/30.0
- ARV discount +7.5/15.0
- Condition / age +4.0/5.0
- Schools +3.9/10.0
- Livability +3.2/5.0
- 1% rule +2.6/10.0
- Rent growth +2.6/5.0
- DSCR +2.3/10.0
- Appreciation +0.0/10.0
$299,990
🖨 Deal sheet 📄 Offer letter ✓ Due diligence
Listing remarks MLS
The Comal floor plan is a well-designed, three-bedroom and two-bathroom home that has a ton of character. The exterior of the home is a beautiful brick structure, with the option to swap the brick for stone. Upon entry, you are greeted by the combined flex space and family room. The flex space allows for either a fourth bedroom, a private study, a formal dining area, a quaint game room, or anything your heart desires. The spacious kitchen/breakfast area and massive family room are perfect for entertaining gatherings of any size! On the right side of the home, you are met with the walk-in utility room with access to your two-car garage, along with the second and third bedrooms. Residing in the middle of the two bedrooms is the full secondary bathroom complete with a shower/bathtub enclosure, single vanity, and a linen closet. Facing the large family room is the extensive kitchen and breakfast area boasting sleek granite countertops, flat-panel birch cabinets, industry-leading appliances, and an undermount stainless steel sink with a ceramic tile backsplash. Do you wish to be able to relax in your backyard while being protected from the weather? Opt to include an exclusive covered patio! Next to the breakfast/kitchen combination area are two more linen closets, and the entry to your Master bedroom and bathroom with a huge walk-in closet. Retreat to your master bathroom that includes the option of double vanities, a shower/bathtub enclosure, and an additional linen closet. If. ..
Key facts
- Flex space
- Covered patio
- Walk-in utility room
Tags
Neighborhood map
What this means for you Summary
Snapshot
- This is a 3-bed/2.0-bath single-family listed at $300k. Condition is rated good.
Deal economics
- At list price, monthly cash flow is $-301 ($-4k/yr) — negative.
- To cash-flow at today's rent, offer at most $284k (5.2% below list).
- To meet the 1% rule (rent ≥ 1% of price), the offer needs to be $249k (17.0% below list).
- Recommended offer: $249k (17.0% below list) — sets the bar for 1% rule.
- Cap rate 5.2% vs local median 4.2% in Iowa Colony — meaningfully above typical; check what's discounted (condition, days-on-market, listing class) to confirm the premium yield is real.
Location & tenants
- Location reads 64/100 on livability (#757 in TX) — a middle-class / working-renter tenant base. Strengths: crime A+, employment A+, cost of living A+; Watch: schools F, amenities F, commute F.
- Alvin ISD (suburban): math 39% / reading 48% proficiency, ranked #255 of 826 in TX (top 31%) — families likely to look elsewhere, expect single-tenant / working-renter base with shorter leases.
- Market conditions: Rents flat; 1139 active listings in the ZIP; 13 comparable units currently listed for rent nearby; rentals at typical pace (median 22d on market — plan ~3-4 weeks tenant-placement turnaround); 46% of comp listings sitting > 30 days — soft ceiling on asking rent; high-income renter base; 3,960 units permitted in Brazoria County in 2024 (593 in 5+ unit buildings).
Forward outlook
- Local home prices are declining (-3.0%/yr); year-one equity from $2k of loan paydown is wiped out by about $10k of value loss. Plan a longer hold.
- Brazoria County population projected at +44% by 2050 — long-run rental-demand tailwind backs the buy-and-hold thesis.
Negotiation context
- It's been on market 82 days — a 6% lower offer ($282k) is reasonable based on typical stale-listing flexibility.
Risks & watch-outs
- Climate carrying-cost: severe wind risk, 99% chance of damaging wind over 30y; major wildfire risk; extreme-heat days projected 7→23/yr by 2055 (HVAC capex compounding) — expect insurance premiums to compound above CPI over the hold.
Questions for the listing agent
- What do current leases actually rent for vs. the listed asking? Can we see a recent rent roll and the last 12 months of T-12 income?
- It's been on market 82 days. Have you received any prior offers? Is the seller open to a 17% concession, seller financing, or rate buy-down credit?
- Why hasn't it sold? Are there any deal-killer items the seller is aware of (foundation, flood, title, zoning, code violations)?
- Is there a deadline driving the sale (1031 exchange, divorce, estate, relocation)? That informs how much negotiation room exists.
- Schools are F-rated, which usually means shorter tenancies and higher turnover. Who's the typical renter profile here, and what's been the actual vacancy rate?
- The area grade is low — what's the realistic commute time and amenity access for the typical tenant pool here? Any planned neighborhood developments (good or bad) we should know about?
- What's the average days-on-market for RENTAL listings here right now (not sales)? A rising rental-DOM trend means longer vacancies and softer asking-rent achievability than the comps imply.
- What's the recent tenant-quality profile in this submarket — average credit score on applications, eviction rate, late-payment / NSF rate, and stable-employment percentage? A property-management company in the area should have these aggregated.
- How much new for-sale + rental construction is in the pipeline within 1–3 miles? Heavy new supply typically softens prices + rents 12–24 months out; constrained supply supports both.
Investment metrics
- 1% rule
- 0.76% ✗
- Cap rate
- 5.19%
- Cash-on-cash
- -3.93%
- DSCR
- 0.83
- GRM
- 11.0
CMA / ARV
- ARV (median comp)
- $328,003
- List price
- $299,990
- Delta
- -8.54%
- Verdict
- FAIR
- Comps
- 20 within 1.0 mi
Show comp detail 12 sales within ~0.75 mi
| Address | Dist | Beds/Ba | Sqft | Sold | Price | $/sf | Match |
|---|---|---|---|---|---|---|---|
| 2807 Nickel Canyon Dr | 0.56mi | 3/2.0 | 1,591 (-1%) | 3mo | $226,500 | $142 | 70 |
| 2429 Abbot Brook Dr | 0.66mi | 3/2.0 | 1,641 (+2%) | 2mo | $210,000 | $128 | 64 |
| 9930 Opal Rock Dr | 0.64mi | 3/2.5 | 1,659 (+3%) | 1mo | $235,000 | $142 | 62 |
| 9810 Garnet Falls Dr | 0.42mi | 3/2.0 | 1,466 (-9%) | 7mo | $237,000 | $162 | 60 |
| 2449 Abbot Brook Dr | 0.64mi | 3/2.0 | 1,616 (+1%) | 11mo | $324,900 | $201 | 59 |
| 2238 Sterling Oaks Dr | 0.46mi | 3/2.0 | 1,427 (-11%) | 7mo | $239,900 | $168 | 54 |
| 2405 Abbot Brook Dr | 0.68mi | 3/2.5 | 1,616 (+1%) | 15mo | $319,900 | $198 | 53 |
| 2442 Goddard Green Dr | 0.63mi | 3/2.0 | 1,809 (+13%) | 0mo | $279,000 | $154 | 49 |
| 9919 Opal Rock Dr | 0.62mi | 3/2.0 | 1,393 (-13%) | 2mo | $239,999 | $172 | 48 |
| 2122 Platinum Mist Dr | 0.65mi | 3/2.0 | 1,373 (-14%) | 8mo | $230,000 | $168 | 39 |
| 2203 Golden Topaz Dr | 0.71mi | 3/2.0 | 1,393 (-13%) | 11mo | $235,000 | $169 | 36 |
| 2211 Golden Topaz Dr | 0.69mi | 3/2.0 | 1,373 (-14%) | 10mo | $237,000 | $173 | 35 |
Match score weights: distance 35% · size 25% · config 20% · recency 20%. Top-matched comps best support the ARV.
Projected returns pro-forma
-3.0% appreciation · 0.44% rent growth · sell at horizon
- IRR
- -25.8%
- Equity multiple
- 0.15×
- Total profit
- $-78,521
- Equity at exit
- $48,906
- IRR
- -33.2%
- Equity multiple
- -0.28×
- Total profit
- $-117,257
- Equity at exit
- $28,360
Cash invested: $91,841 (down + closing). Projections, not guarantees.
Landlord ↔ Tenant lean methodology
- Overall (STATE)
- 87 Strongly Landlord-Friendly
- State Texas
- 87 Strongly Landlord-Friendly · R+5
- County
- — inherits STATE
- City
- — inherits STATE
ZIP-level market 77583
- Rents YoY
- 0.4%
- Active inventory
- 1139
- Price-to-rent
- 10.0×
Monthly cashflow live
- Estimated rent
- $2,489 high interval (Pro) →
- Mortgage (P&I)
- −$1,720
- Tax est. 1.5%
- −$410 /mo · $4,920/yr
- Insurance
- −$137
- HOA
- −$0
- Vacancy / Maint / Mgmt
- −$523
- Net cashflow
- $-301
Break-even live
UW: 25.0% down · 7.5% · 30yr · 1.5% tax · 5.0% vac · 8.0% maint · 8.0% mgmt
Financing live
Cash to close
- Down payment
- $82,001
- Closing costs
- $9,840
- Reserves months
- —
- Total cash needed
- —
Loan-product check · same deal, 3 products live
Conventional
25% down · 7.5% · 30yr
- Down + closing
- —
- Monthly P&I
- —
- Monthly cashflow
- —
- DSCR
- —
- Eligible?
- —
Personal DTI + credit; lowest rate.
DSCR
20% down · 8.5% · 30yr
- Down + closing
- —
- Monthly P&I
- —
- Monthly cashflow
- —
- DSCR
- —
- Eligible?
- —
No personal income docs; deal must DSCR.
Hard money
10% down · 12.0% · 12mo
- Down + closing
- —
- Monthly P&I
- —
- Monthly cashflow
- —
- DSCR
- —
- Eligible?
- —
Short-term bridge; refi at stabilization.
Rent comps 13 comps
| Address | Beds | Baths | Sqft | Rent | $/sqft | DOM | Units | Dist |
|---|---|---|---|---|---|---|---|---|
| 10203 Karsten Blvd Rosharon, TX | 1.0–2.0 | 1.0–2.0 | 935 | $2,061 | $2.20 | 1d | 138 | 0.13mi |
| 10211 Alpine Lake Ln Rosharon, TX | 3.0–4.0 | 2.0–2.5 | 1731 | $2,700 | $1.56 | 1d | 6 | 0.41mi |
| 10211 Alpine Lake Ln Rosharon, TX | 3.0–4.0 | 2.0–2.5 | 1731 | $2,469 | $1.43 | 43d | 7 | 0.41mi |
| 9518 Peridot Green Dr Rosharon, TX | 4.0 | 2.0 | 1593 | $1,886 | $1.18 | 21d | 1 | 0.62mi |
| 9901 Kilkenny St Iowa Colony, TX | 3.0–4.0 | 2.5 | 1735 | $2,275 | $1.31 | 4d | 1 | 0.72mi |
| 1816 Corsica Creek Ln Rosharon, TX | 3.0–4.0 | 2.0–2.5 | 1653 | $2,306 | $1.40 | 1d | 21 | 0.77mi |
| 10313 Malta Trace Dr Rosharon, TX | 4.0 | 2.0 | 1802 | $2,545 | $1.41 | 43d | 1 | 0.87mi |
| 2510 Green Jasper Dr Rosharon, TX | 3.0 | 2.0 | 1561 | $2,375 | $1.52 | 43d | 1 | 1.17mi |
| 9423 Grand Spark Dr Rosharon, TX | 3.0 | 3.0 | 1999 | $2,600 | $1.30 | 43d | 1 | 1.20mi |
| 2523 Topaz Hill Ln Rosharon, TX | 3.0–4.0 | 2.0–2.5 | 1857 | $2,425 | $1.31 | 16d | 1 | 1.41mi |
| 10327 Armstrong Dr Rosharon, TX | 3.0 | 2.0 | 1956 | $2,291 | $1.17 | 43d | 1 | 1.43mi |
| 10610 Cascade Creek Dr Rosharon, TX | 3.0 | 2.0 | 1548 | $2,700 | $1.74 | 43d | 1 | 1.49mi |
| 1403 Cascade Hills Dr Rosharon, TX | 4.0 | 3.0 | 2067 | $3,450 | $1.67 | 7d | 1 | 1.49mi |
Listing history 15 events
-
2026-06-18days on market $299,990 Active 82 DOM
-
2026-06-17days on market $299,990 Active 81 DOM
-
2026-06-16days on market $299,990 Active 80 DOM
-
2026-06-15days on market $299,990 Active 79 DOM
-
2026-06-13days on market $299,990 Active 77 DOM
-
2026-06-13days on market $299,990 Active 76 DOM
-
2026-06-09days on market $299,990 Active 73 DOM
-
2026-06-08days on market $299,990 Active 72 DOM
-
2026-06-07days on market $299,990 Active 71 DOM
-
2026-06-04days on market $299,990 Active 68 DOM
-
2026-06-03days on market $299,990 Active 67 DOM
-
2026-06-02days on market $299,990 Active 66 DOM
-
2026-06-01days on market $299,990 Active 65 DOM
-
2026-05-31days on market $299,990 Active 64 DOM
-
2026-03-28$299,990 Active 1501-char remark
Show marketing remark (1501 chars)
The Comal floor plan is a well-designed, three-bedroom and two-bathroom home that has a ton of character. The exterior of the home is a beautiful brick structure, with the option to swap the brick for stone. Upon entry, you are greeted by the combined flex space and family room. The flex space allows for either a fourth bedroom, a private study, a formal dining area, a quaint game room, or anything your heart desires. The spacious kitchen/breakfast area and massive family room are perfect for entertaining gatherings of any size! On the right side of the home, you are met with the walk-in utility room with access to your two-car garage, along with the second and third bedrooms. Residing in the middle of the two bedrooms is the full secondary bathroom complete with a shower/bathtub enclosure, single vanity, and a linen closet. Facing the large family room is the extensive kitchen and breakfast area boasting sleek granite countertops, flat-panel birch cabinets, industry-leading appliances, and an undermount stainless steel sink with a ceramic tile backsplash. Do you wish to be able to relax in your backyard while being protected from the weather? Opt to include an exclusive covered patio! Next to the breakfast/kitchen combination area are two more linen closets, and the entry to your Master bedroom and bathroom with a huge walk-in closet. Retreat to your master bathroom that includes the option of double vanities, a shower/bathtub enclosure, and an additional linen closet. If. ..
ⓘ Source: listings_history table (triggers on properties + properties_extension) + one-shot
backfill from property_details.listing_events for pre-trigger history.
Climate risk First Street
- Flood 1/10 Low FEMA zone X (unshaded) · 0% chance over 30 yrs
- Wildfire 6/10 Major
- Heat 9/10 Extreme 7 d/yr ≥110°F today · 23 d/yr by 30 yrs out
- Wind 9/10 Extreme 99% chance of damaging wind over 30 yrs
- Air quality 3/10 Moderate 2 unhealthy d/yr today · 3 by 30 yrs out
Nearby sold comps map
Loading sold comps map…
Walkable amenities ~0.75 mi
Loading nearby amenities…
Taxation est. · year 1
- Rental income
- $29,863
- − Mortgage interest
- −$18,373
- − Property taxes
- −$4,920
- − Insurance
- −$1,640
- − Repairs & maintenance
- −$2,389
- − Management
- −$2,389
- − Depreciation
- −$9,542
- Taxable loss
- −$9,391
- Est. tax savings @ 24.0%
- +$2,254
- After-tax cash flow
- $-1,356/yr
For passive investors: Depreciation is non-cash, so a rental often shows a tax loss while cash-flowing — sheltering income. Rental losses are passive: they offset passive income freely, and up to $25,000/yr can offset ordinary (W-2) income if you actively participate and your MAGI is under $100k (phasing out to $0 by $150k); unused losses carry forward. On sale, claimed depreciation is recaptured at up to 25%, and gains may owe capital-gains tax (a 1031 exchange can defer both). Figures are a year-1 estimate at your 24.0% rate — not tax advice; consult a CPA.
Condition & rehab AI · 12 photos
This Comal floor plan home is in excellent condition with a good condition score of 80. It is move-in ready with minimal repairs and maintenance needed. The highest-ROI updates would be painting the exterior to stone, updating the flooring in the flex space, and adding a smart home system.
Value-add opportunities
- Both Painting the exterior brick to stone (if opting for stone) — Enhances curb appeal and can increase both resale and rental value.
- Both Updating the flooring in the flex space to match the kitchen and living areas — Improves flow and aesthetics, making the space more inviting and functional.
- Both Adding a smart home system for energy efficiency and convenience — Improves energy efficiency and adds a modern touch, enhancing both resale and rental appeal.
Renovation cost estimate screening
Value-add ROI direction
- Both Painting the exterior brick to stone (if opting for stone) — Enhances curb appeal and can increase both resale and rental value. ↑
- Both Updating the flooring in the flex space to match the kitchen and living areas — Improves flow and aesthetics, making the space more inviting and functional. ↑
- Both Adding a smart home system for energy efficiency and convenience — Improves energy efficiency and adds a modern touch, enhancing both resale and rental appeal. ↑
ⓘ Cost ranges are severity-bucket heuristics (US national rule-of-thumb). Get contractor quotes + a written scope before underwriting a rehab budget.
Schools (NCES district)
- District
- Alvin ISD
- NCES district ID
- 4808090
- Math proficiency
- 39% ▼ -11.00%
- Reading proficiency
- 48% ▬ 0.00%
- Median HH income
- $66,740
- Composite
- 38.96/100
- National rank
- #4080
- State rank
- #255 of 826 in TX
Livability — Iowa Colony
- Score
- 64/100
- State rank
- #757
- US rank
- #13904
Category grades
Schools grade is shown separately in the Schools card above.
Census & demographics
- County
- Brazoria County · 374,982 people
- Metro
- Houston-The Woodlands-Sugar Land, TX
- Population (ZIP)
- 52,747
- Household income
- $119,287
- Rent vs Own
- Severe rent burden
- 251.0
Population outlook (Brazoria County) Hauer SSP2
- Today (2025)
- 420,414 people
- By 2030
- 457,585 · +8.8%
- By 2040
- 532,232 · +26.6%
- By 2050
- 605,399 · +44.0%
- By 2075
- 779,358 · +85.4%
- By 2100
- 883,759 · +110.2%
Race, ethnicity, and origin ACS 2023
- Neighborhood character
- Highly diverse neighborhood (Simpson 0.70)
- Race & ethnicity
- Hispanic / Latino 38% Black 34% White 20% Two or more races 18% Asian 5%
- Hispanic origin (detail)
- Mexican 31% Puerto Rican 2%
- Common ancestry
- Lithuanian 1% Slovak 1% Romanian 1%
- Foreign-born
- 16% · Canada, Vietnam, China
- Languages at home
- 64% English-only · Spanish 28% Other Asian/Pacific 2% Vietnamese 1%
Political lean MEDSL · Brazoria
- 2024 margin
- R (+19.7) · D 39.5% · R 59.2% · Other 1.3%
- 2008→2024 swing
- +9.9pp toward D · 2008: -29.6pp · 2024: -19.7pp
- All cycles
- 2024: R+19.7 2020: R+18.2 2016: R+24.6 2012: R+34.2 2008: R+29.6
Not yet ingested
- Civics
- —
Market trends
- HPI YoY
- ▼ -120.19%
- Current HPI
- 198.6559
- Rent YoY
- ▲ 0.44%
- Metro
- Houston-The Woodlands-Sugar Land, TX
- State GDP YoY
- ▲ 3.95%
- F500 in state
- 110
Industry mix (Fortune 500 HQ in TX)
| Industry | F500 HQs | Revenue |
|---|---|---|
| Energy | 16 | $1,198B |
|
||
| Technology | 5 | $198B |
|
||
| Engineering / Construction | 4 | $72B |
|
||
| Energy Services | 3 | $60B |
|
||
| Utilities | 3 | $41B |
|
||
| Healthcare | 2 | $330B |
|
||
Price history
1 event — show timeline
- 2026-03-28 Listed $299,990 Zillow
Cash-flow waterfall
monthlySold comps — $/sqft
last 12 mo · ≤1 miLoading sold comps…