395 Peru Rd · Sneads Ferry, NC
Flood risk 1/10 · Minimal
- FEMA flood zone
- X (unshaded)
- Chance of flooding over 30 yrs
- 0.0%
- Est. flood insurance / yr
- $507 – $1,088
Fire risk 3/10 · Minor
- Est. fire insurance / yr
- $906 – $1,684
Heat risk 9/10 · Severe
- Hot days now (above 103°F)
- 7 days/yr
- Hot days in 30 yrs
- 19 days/yr
Wind risk 9/10 · Severe
- Chance of severe wind over 30 yrs
- 99.0%
Air-quality risk 3/10 · Minor
- Unhealthy air days now
- 1 days/yr
- Unhealthy air days in 30 yrs
- 4 days/yr
Risk factors via First Street. Map © Google.
Why this score? — see what drove the C- grade
The composite is a weighted blend of 9 inputs, each scored 0–100. Each bar is that input's sub-score; the figure is the points it added to the 100-point composite (weight × sub-score).
- Cash flow +19.5/30.0
- ARV discount +10.8/15.0
- DSCR +6.2/10.0
- 1% rule +4.0/10.0
- Rent growth +3.9/5.0
- Schools +3.9/10.0
- Livability +3.2/5.0
- Condition / age +2.5/5.0
- Appreciation +0.0/10.0
$228,000
🖨 Deal sheet 📄 Offer letter ✓ Due diligence
Listing remarks MLS
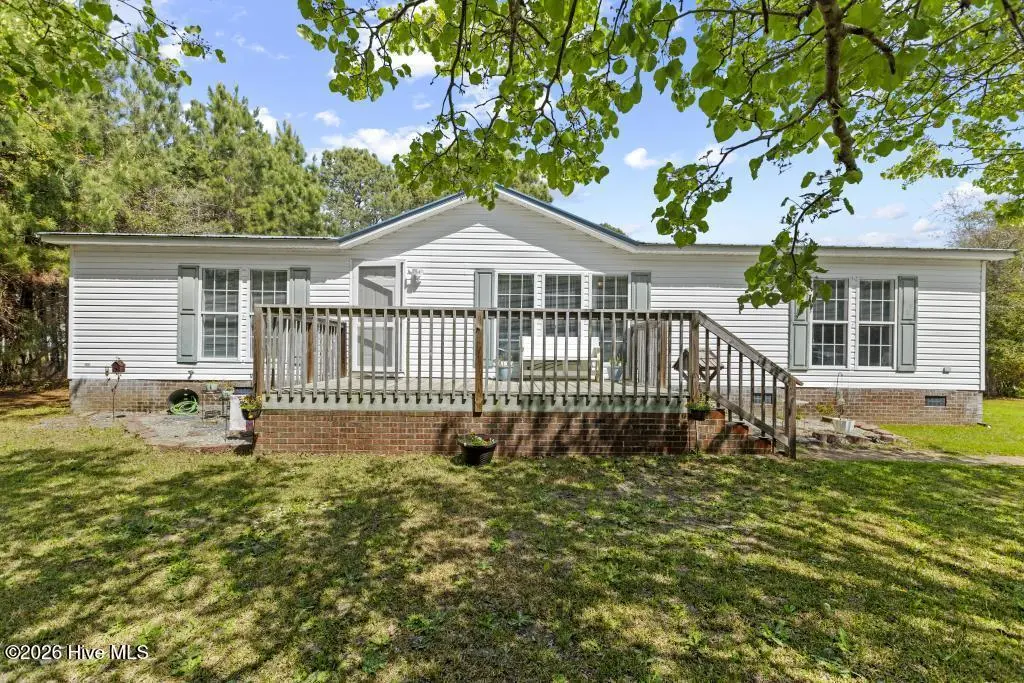
* * * * * Back on the Market Buyer got cold feet * * * * This gem is located minutes from Top Sail and Surf City. This home offers 3 bedrooms/2 bathrooms at 1568sq ft and sit on a 0.41 acre lot. New flooring was installed in the kitchen, and both bathrooms. Repairs have been done to master bathroom ceiling above tub. Living room and bedrooms are carpeted and recently steamed cleaned.
Key facts
- 0.41 acre lot
- Built 1997
- Listed 23 days
Property features AI
Finance
- Other: Subdivision: Justice Farm; Zoning: R-8M; Lot roughly 0.41 acres (90 x 190 x 90); Directions: From HWY 172, turn right onto Sneads Ferry Rd. On your left is 395 Peru Rd.
- HOA & community: No association amenities
Exterior
- Parking: Shared driveway; Unpaved parking
- Utilities: Public water; Water available; Septic tank
- Home design: Manufactured home; Single-story (Entry level 1)
- Construction: Vinyl siding and frame construction; Metal roof; Permanent foundation; Built as a manufactured home
- Exterior features: Deck; Storm door(s); Chain link fencing; Has a view; City street and state road frontage; Frontage details: see remarks
Interior
- Bathrooms: 2 full bathrooms
- Heating & cooling: Central air conditioning; Electric heat with heat pump
- Interior features: Window coverings; Electric water heater; 5 total rooms
Neighborhood map
What this means for you Summary
Snapshot
- This is a 3-bed/2.0-bath manufactured listed at $228k.
Deal economics
- At list price, monthly cash flow is $257 ($3k/yr) — positive.
- The deal already cash-flows at list — no discount required.
- To meet the 1% rule (rent ≥ 1% of price), the offer needs to be $205k (10.3% below list).
- Recommended offer: $205k (10.3% below list) — sets the bar for 1% rule.
- Cap rate 7.6% vs local median 4.0% in Sneads Ferry — top-decile yield for the area; either an underpriced asset or a hidden risk that comps aren't pricing in. Stress-test before assuming the spread holds.
Location & tenants
- Location reads 63/100 on livability (#398 in NC) — a middle-class / working-renter tenant base. Strengths: crime A+, cost of living A+; Watch: health & safety D, amenities F, commute F.
- Onslow County Schools (other): math 42% / reading 49% proficiency, ranked #84 of 178 in NC (top 47%) — families likely to look elsewhere, expect single-tenant / working-renter base with shorter leases.
- Zoned schools: Dixon Elementary (math 63% / reading 66%, grade B, #147 of 1,410 statewide, top 11%, 736 students, 30% FRL); Dixon Middle (math 49% / reading 53%, grade C, #106 of 475 statewide, top 22%, 948 students, 39% FRL); Dixon High (math 62% / reading 72%, grade B, #142 of 535 statewide, top 28%, 1,149 students, 33% FRL) — zoned schools at 34% FRL track the district average.
- Zoned-school proficiency averages 61% at this address vs 46% district-wide (+15 pts) — the actual schools serving this property are materially stronger than the Onslow County Schools average implies; a family-tenant draw the district grade alone would hide.
- Market conditions: Rents rising fast (+5.7%/yr); 560 active listings in the ZIP; 1 comparable units currently listed for rent nearby; solid renter incomes; 1,246 units permitted in Onslow County in 2024 (0 in 5+ unit buildings).
Forward outlook
- Local home prices are declining (-3.0%/yr); year-one equity from $2k of loan paydown is wiped out by about $7k of value loss. Plan a longer hold.
Negotiation context
- It's been on market 23 days — a 2% lower offer ($225k) is reasonable based on typical stale-listing flexibility.
- 3 sale attempts since 4y ago with the ask held roughly flat each time — persistent listings suggest the price (not the market) is what's stuck; bring a comps-based counter.
- Current owner paid $170k; 34% above their basis — modest negotiation headroom, anchor on the comps not their cost.
Risks & watch-outs
- Climate carrying-cost: severe wind risk, 99% chance of damaging wind over 30y; extreme-heat days projected 7→19/yr by 2055 (HVAC capex compounding) — expect insurance premiums to compound above CPI over the hold.
Questions for the listing agent
- Is there a deadline driving the sale (1031 exchange, divorce, estate, relocation)? That informs how much negotiation room exists.
- Schools are D-rated, which usually means shorter tenancies and higher turnover. Who's the typical renter profile here, and what's been the actual vacancy rate?
- What's the average days-on-market for RENTAL listings here right now (not sales)? A rising rental-DOM trend means longer vacancies and softer asking-rent achievability than the comps imply.
- What's the recent tenant-quality profile in this submarket — average credit score on applications, eviction rate, late-payment / NSF rate, and stable-employment percentage? A property-management company in the area should have these aggregated.
- How much new for-sale + rental construction is in the pipeline within 1–3 miles? Heavy new supply typically softens prices + rents 12–24 months out; constrained supply supports both.
Investment metrics
- 1% rule
- 0.90% ✗
- Cap rate
- 7.65%
- Cash-on-cash
- 4.84%
- DSCR
- 1.22
- GRM
- 9.3
CMA / ARV
- ARV (on-the-fly)
- $246,176
- Comps found
- 3
Show comp detail 3 sales within ~0.75 mi
| Address | Dist | Beds/Ba | Sqft | Sold | Price | $/sf | Match |
|---|---|---|---|---|---|---|---|
| 220 Cedar Hollow Ct | 0.50mi | 3/2.0 | 1,485 (-5%) | 20mo | $232,595 | $157 | 51 |
| 221 Cedar Hollow Ct | 0.44mi | 3/2.0 | 1,340 (-14%) | 11mo | $242,000 | $181 | 46 |
| 184 Tillett Ln | 0.47mi | 3/2.0 | 1,797 (+15%) | 16mo | $225,000 | $125 | 40 |
Match score weights: distance 35% · size 25% · config 20% · recency 20%. Top-matched comps best support the ARV.
Projected returns pro-forma
-3.0% appreciation · 5.68% rent growth · sell at horizon
- IRR
- -6.2%
- Equity multiple
- 0.77×
- Total profit
- $-14,993
- Equity at exit
- $33,996
- IRR
- 6.1%
- Equity multiple
- 1.50×
- Total profit
- $32,186
- Equity at exit
- $19,713
Cash invested: $63,840 (down + closing). Projections, not guarantees.
Landlord ↔ Tenant lean methodology
- Overall (STATE)
- 85 Strongly Landlord-Friendly
- State North Carolina
- 85 Strongly Landlord-Friendly · R+3
- County
- — inherits STATE
- City
- — inherits STATE
ZIP-level market 28460
- Rents YoY
- 5.7%
- Active inventory
- 560
- Price-to-rent
- 9.3×
Monthly cashflow live
- Estimated rent
- $2,045 medium interval (Pro) →
- Mortgage (P&I)
- −$1,196
- Tax from tax record
- −$68 /mo · $813/yr
- Insurance
- −$95
- HOA
- −$0
- Vacancy / Maint / Mgmt
- −$430
- Net cashflow
- $257
Break-even live
UW: 25.0% down · 7.5% · 30yr · 1.5% tax · 5.0% vac · 8.0% maint · 8.0% mgmt
Financing live
Cash to close
- Down payment
- $57,000
- Closing costs
- $6,840
- Reserves months
- —
- Total cash needed
- —
Loan-product check · same deal, 3 products live
Conventional
25% down · 7.5% · 30yr
- Down + closing
- —
- Monthly P&I
- —
- Monthly cashflow
- —
- DSCR
- —
- Eligible?
- —
Personal DTI + credit; lowest rate.
DSCR
20% down · 8.5% · 30yr
- Down + closing
- —
- Monthly P&I
- —
- Monthly cashflow
- —
- DSCR
- —
- Eligible?
- —
No personal income docs; deal must DSCR.
Hard money
10% down · 12.0% · 12mo
- Down + closing
- —
- Monthly P&I
- —
- Monthly cashflow
- —
- DSCR
- —
- Eligible?
- —
Short-term bridge; refi at stabilization.
Rent comps 1 comps
| Address | Beds | Baths | Sqft | Rent | $/sqft | DOM | Units | Dist |
|---|---|---|---|---|---|---|---|---|
| 133 Lawndale Ln Sneads Ferry, NC | 3.0 | 2.0 | 1125 | $1,800 | $1.60 | 21d | 1 | 0.33mi |
Listing history 12 events
-
2026-05-31status $228,000 Pending 23 DOM
-
2026-05-30days on market $228,000 Active 23 DOM
-
2026-05-14status Active
-
2026-05-07status Pending
-
2026-04-27$228,000 Active
-
2022-04-11soldstatus $170,000 Closed 397-char remark
Show marketing remark (397 chars)
* * * * * Back on the Market Buyer got cold feet * * * * This gem is located minutes from Top Sail and Surf City. This home offers 3 bedrooms/2 bathrooms at 1568sq ft and sit on a 0.41 acre lot. New flooring was installed in the kitchen, and both bathrooms. Repairs have been done to master bathroom ceiling above tub. Living room and bedrooms are carpeted and recently steamed cleaned.
-
2022-04-11soldstatus $170,000
Show marketing remark (397 chars)
* * * * * Back on the Market Buyer got cold feet * * * * This gem is located minutes from Top Sail and Surf City. This home offers 3 bedrooms/2 bathrooms at 1568sq ft and sit on a 0.41 acre lot. New flooring was installed in the kitchen, and both bathrooms. Repairs have been done to master bathroom ceiling above tub. Living room and bedrooms are carpeted and recently steamed cleaned.
-
2022-03-06historical 397-char remark
Show marketing remark (397 chars)
* * * * * Back on the Market Buyer got cold feet * * * * This gem is located minutes from Top Sail and Surf City. This home offers 3 bedrooms/2 bathrooms at 1568sq ft and sit on a 0.41 acre lot. New flooring was installed in the kitchen, and both bathrooms. Repairs have been done to master bathroom ceiling above tub. Living room and bedrooms are carpeted and recently steamed cleaned.
-
2022-02-15$164,999 397-char remark
Show marketing remark (397 chars)
* * * * * Back on the Market Buyer got cold feet * * * * This gem is located minutes from Top Sail and Surf City. This home offers 3 bedrooms/2 bathrooms at 1568sq ft and sit on a 0.41 acre lot. New flooring was installed in the kitchen, and both bathrooms. Repairs have been done to master bathroom ceiling above tub. Living room and bedrooms are carpeted and recently steamed cleaned.
-
2008-06-20soldstatus $119,000
-
2005-11-07soldstatus $125,000
-
1998-07-10soldstatus $13,500
ⓘ Source: listings_history table (triggers on properties + properties_extension) + one-shot
backfill from property_details.listing_events for pre-trigger history.
Tax reassessment forecast NC · Resets to sale price
- Current annual tax
- $813 · $68/mo
- Projected year-2 tax
- $1,870 · $156/mo
- Expected delta
- +$1,057/yr (+$88/mo · 130.0%)
ⓘ Screening estimate from a state-policy table — verify with the county assessor before closing.
Climate risk First Street
- Flood 1/10 Low FEMA zone X (unshaded) · 0% chance over 30 yrs
- Wildfire 3/10 Moderate
- Heat 9/10 Extreme 7 d/yr ≥103°F today · 19 d/yr by 30 yrs out
- Wind 9/10 Extreme 99% chance of damaging wind over 30 yrs
- Air quality 3/10 Moderate 1 unhealthy d/yr today · 4 by 30 yrs out
Nearby sold comps map
Loading sold comps map…
Walkable amenities ~0.75 mi
Loading nearby amenities…
Taxation est. · year 1
- Rental income
- $24,543
- − Mortgage interest
- −$12,772
- − Property taxes
- −$813
- − Insurance
- −$1,140
- − Repairs & maintenance
- −$1,963
- − Management
- −$1,963
- − Depreciation
- −$6,633
- Taxable loss
- −$741
- Est. tax savings @ 24.0%
- +$178
- After-tax cash flow
- $3,266/yr
For passive investors: Depreciation is non-cash, so a rental often shows a tax loss while cash-flowing — sheltering income. Rental losses are passive: they offset passive income freely, and up to $25,000/yr can offset ordinary (W-2) income if you actively participate and your MAGI is under $100k (phasing out to $0 by $150k); unused losses carry forward. On sale, claimed depreciation is recaptured at up to 25%, and gains may owe capital-gains tax (a 1031 exchange can defer both). Figures are a year-1 estimate at your 24.0% rate — not tax advice; consult a CPA.
Schools (NCES district)
- District
- Onslow County Schools
- NCES district ID
- 3703450
- Math proficiency
- 42% ▲ 6.00%
- Reading proficiency
- 49% ▲ 5.00%
- Median HH income
- $46,076
- Composite
- 38.66/100
- National rank
- #4148
- State rank
- #84 of 178 in NC
Livability — Sneads Ferry
- Score
- 63/100
- State rank
- #398
- US rank
- #15272
Category grades
Schools grade is shown separately in the Schools card above.
Census & demographics
- Census place
- Sneads Ferry, NC
- County
- Onslow County · 164,453 people
- City population
- 13,532
- Metro
- Jacksonville, NC
- Population (ZIP)
- 13,532
- Household income
- $88,908
- Rent vs Own
- Severe rent burden
- 349.0
Population outlook (Onslow County) Hauer SSP2
- Today (2025)
- 189,789 people
- By 2030
- 194,463 · +2.5%
- By 2040
- 193,629 · +2.0%
- By 2050
- 193,248 · +1.8%
- By 2075
- 196,995 · +3.8%
- By 2100
- 201,513 · +6.2%
Race, ethnicity, and origin ACS 2023
- Neighborhood character
- Predominantly White (79%)
- Race & ethnicity
- White 79% Two or more races 13% Hispanic / Latino 9% Black 3% Asian 1%
- Hispanic origin (detail)
- Mexican 1% Puerto Rican 5% Dominican 2%
- Common ancestry
- Lithuanian 3% Romanian 2% Portuguese 2%
- Foreign-born
- 3% · South Korea, Canada
- Languages at home
- 93% English-only · Spanish 4% German/W. Germanic 1% Other Indo-European 1%
Political lean MEDSL · Onslow
- 2024 margin
- Solid R (+35.9) · D 31.5% · R 67.5% · Other 1.0%
- 2008→2024 swing
- -14.5pp toward R · 2008: -21.5pp · 2024: -35.9pp
- All cycles
- 2024: R+35.9 2020: R+30.2 2016: R+34.6 2012: R+27.0 2008: R+21.5
Not yet ingested
- Civics
- —
Market trends
- HPI YoY
- ▼ -162.21%
- Current HPI
- 176.3461
- Rent YoY
- ▲ 5.68%
- Metro
- Jacksonville, NC
- State GDP YoY
- ▲ 3.28%
- F500 in state
- 26
Industry mix (Fortune 500 HQ in NC)
| Industry | F500 HQs | Revenue |
|---|---|---|
| Financial Services | 2 | $213B |
|
||
| Retail | 2 | $95B |
|
||
| Industrial Conglomerate | 1 | $38B |
|
||
| Metals / Steel | 1 | $35B |
|
||
| Utilities | 1 | $30B |
|
||
| Industrial Machinery | 1 | $19B |
|
||
Price history
+1588.9% since first listed10 events — show timeline
- 2026-05-14 Relisted — Hive MLS
- 2026-05-07 Pending — Hive MLS
- 2026-04-27 Listed $228,000 Hive MLS
- 2022-04-11 Sold (Public Records) $170,000 Public Records
- 2022-04-11 Sold (MLS) $170,000 Hive MLS
- 2022-03-06 Listing Removed — Hive MLS
- 2022-02-15 Listed $164,999 Hive MLS
- 2008-06-20 Sold (Public Records) $119,000 Public Records
- 2005-11-07 Sold (Public Records) $125,000 Public Records
- 1998-07-10 Sold (Public Records) $13,500 Public Records
Property tax history
+1.8%/yrLatest (2025): $813 · +0.0% YoY. Source: county tax records.
Cash-flow waterfall
monthlySold comps — $/sqft
last 12 mo · ≤1 miLoading sold comps…