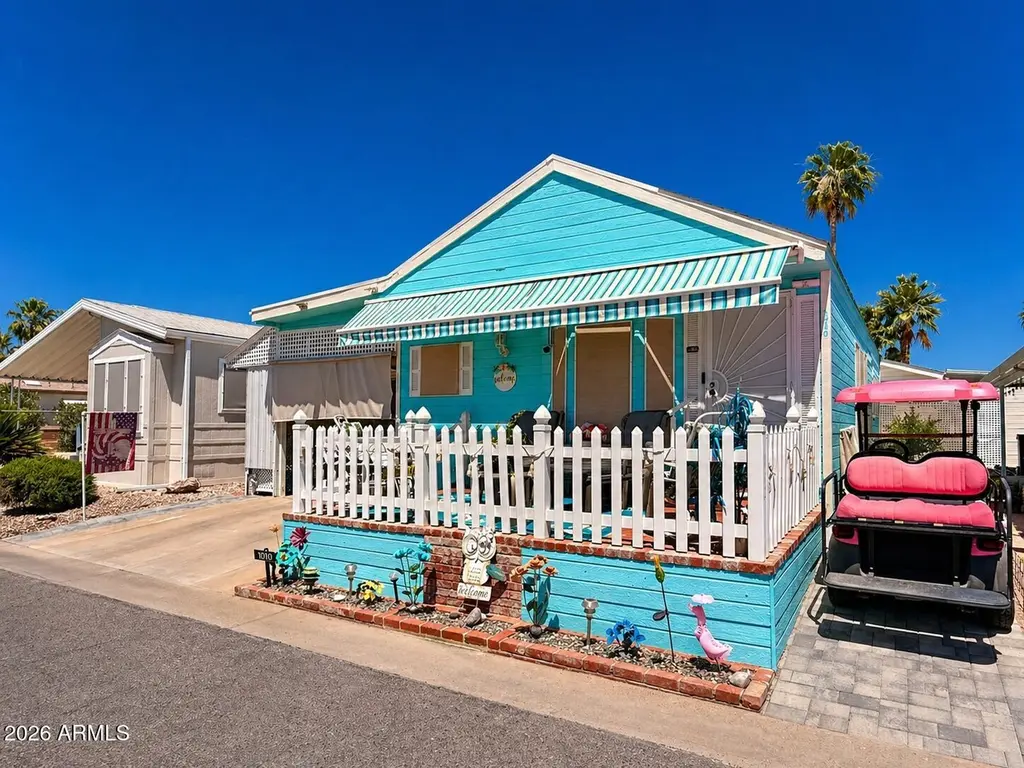
8865 E Baseline Rd #1010 · Mesa, AZ
Flood risk 1/10 · Minimal
- FEMA flood zone
- X (shaded)
- Chance of flooding over 30 yrs
- 0.0%
- Est. flood insurance / yr
- $507 – $1,088
Fire risk 4/10 · Minor
- Est. fire insurance / yr
- $610 – $1,132
Heat risk 9/10 · Severe
- Hot days now (above 111°F)
- 6 days/yr
- Hot days in 30 yrs
- 16 days/yr
Wind risk 1/10 · Minimal
- Chance of severe wind over 30 yrs
- —
Air-quality risk 3/10 · Minor
- Unhealthy air days now
- 2 days/yr
- Unhealthy air days in 30 yrs
- 3 days/yr
Risk factors via First Street. Map © Google.
Why this score? — see what drove the A- grade
The composite is a weighted blend of 9 inputs, each scored 0–100. Each bar is that input's sub-score; the figure is the points it added to the 100-point composite (weight × sub-score).
- Cash flow +30.0/30.0
- ARV discount +10.9/15.0
- 1% rule +10.0/10.0
- DSCR +10.0/10.0
- Appreciation +5.7/10.0
- Schools +4.6/10.0
- Livability +4.0/5.0
- Condition / age +4.0/5.0
- Rent growth +2.6/5.0
$99,900
🖨 Deal sheet (PDF) 📄 Offer letter ✓ Due diligence
Listing remarks
There are homes. .. and then there are opportunities you simply don't see twice. Welcome to one of the most unique and versatile homes in Monte Vista Village--where thoughtful upgrades, light-filled living, and an incredible expanded floorplan come together to create something truly special. From the moment you step inside, the home opens with soaring vaulted ceilings, abundant natural light from multiple skylights, and shutters that frame each space with warmth and intention. The flow is effortless, the feel is elevated, and every detail has been curated for both comfort and style. At the heart of the home is a stunning, fully upgraded kitchen--featuring high-end granite countertops, expan
Key facts
- Retractable awning
- In-unit laundry
- Charming brick porch
Tags
Property features AI
Finance
- Other: Directions available to property
- HOA & community: Land lease: $1,039 per month; No association fees included; Community amenities: pool, community spa (heated), pickleball, tennis courts, fitness center, community media room
Exterior
- Parking: 1 covered parking space; 1 carport space
- Security: Gated community with guarded entry; Security guard
- Utilities: Private water company; Public sewer
- Home design: Manufactured/mobile home; Leasehold ownership
- Construction: Wood siding and wood frame construction; Painted exterior; Composition roof; Building area per builder
- Exterior features: Storage; Desert front and back landscaping; Gravel/stone front and back; Private maintained road
Interior
- Kitchen: Built-in microwave; Refrigerator; Dishwasher; Garbage disposal
- Bedrooms: 2 possible bedrooms
- Flooring: Laminate
- Bathrooms: 2 full bathrooms
- Heating & cooling: Electric heating; Central air; Ceiling fan(s)
- Interior features: High-speed internet; Granite counters; No interior steps; Vaulted ceilings; 3/4 bath in primary bedroom; Skylights; Dual-pane windows
- Laundry & utility: Laundry inside
Neighborhood map
What this means for you Summary
Snapshot
- This is a 1-bed/2.0-bath manufactured listed at $100k. Condition is rated good.
Deal economics
- At list price, monthly cash flow is $619 ($7k/yr) — positive.
- The deal already cash-flows at list — no discount required.
- Meets the 1% rule at list price ($2k rent vs $100k).
- Recommended offer: $97k (3.0% below list) — sets the bar for market timing.
- Cap rate 13.7% vs local median 3.4% in Mesa — top-decile yield for the area; either an underpriced asset or a hidden risk that comps aren't pricing in. Stress-test before assuming the spread holds.
Location & tenants
- Location reads 79/100 on livability (#6 in AZ, #2,034 nationally) — a middle-class / working-renter tenant base. Strengths: amenities A+, commute A+, housing A+; Watch: health & safety C-, crime D.
- Gilbert Unified District (4239) (suburban): math 49% / reading 52% proficiency, ranked #38 of 249 in AZ (top 15%) — acceptable for families but not a draw, mixed tenant base, ~2y average lease; only 14% free/reduced lunch — higher-income household profile.
- Zoned schools: Augusta Ranch Elementary (math 47% / reading 58%, grade C-, #233 of 1,109 statewide, top 22%, 953 students, 29% FRL); Desert Ridge Jr. High (math 28% / reading 43%, grade F, #62 of 218 statewide, top 29%, 973 students, 26% FRL); Desert Ridge High (math 24% / reading 32%, grade F, #136 of 381 statewide, top 36%, 2,284 students, 23% FRL).
- Market conditions: Rents flat; 171 active listings in the ZIP; 15 comparable units currently listed for rent nearby; rentals at typical pace (median 23d on market — plan ~3-4 weeks tenant-placement turnaround); solid renter incomes; 36,011 units permitted in Maricopa County in 2024 (12,801 in 5+ unit buildings).
Forward outlook
- In year one you build about $2k of equity ($691 loan paydown + $1k appreciation (1.4% local appreciation)).
- Maricopa County population projected at +38% by 2050 — long-run rental-demand tailwind backs the buy-and-hold thesis.
- At projected returns (1.4% appreciation + 0.5% rent growth), your $28k cash investment doubles in ~3 years — after that, you're playing with house money.
Negotiation context
- It's been on market 53 days — a 3% lower offer ($97k) is reasonable based on typical stale-listing flexibility.
Risks & watch-outs
- Climate carrying-cost: extreme-heat days projected 6→16/yr by 2055 (HVAC capex compounding) — expect insurance premiums to compound above CPI over the hold.
Questions for the listing agent
- It's been on market 53 days. Have you received any prior offers? Is the seller open to a 3% concession, seller financing, or rate buy-down credit?
- Is there a deadline driving the sale (1031 exchange, divorce, estate, relocation)? That informs how much negotiation room exists.
- Crime grade is D in this area — have there been break-ins, vandalism, or insurance claims at this property in the last 3 years? What carrier currently insures it and at what premium?
- What's the average days-on-market for RENTAL listings here right now (not sales)? A rising rental-DOM trend means longer vacancies and softer asking-rent achievability than the comps imply.
- What's the recent tenant-quality profile in this submarket — average credit score on applications, eviction rate, late-payment / NSF rate, and stable-employment percentage? A property-management company in the area should have these aggregated.
- How much new for-sale + rental construction is in the pipeline within 1–3 miles? Heavy new supply typically softens prices + rents 12–24 months out; constrained supply supports both.
Investment metrics
- 1% rule
- 1.66% ✓
- Cap rate
- 13.72%
- Cash-on-cash
- 26.54%
- DSCR
- 2.18
- GRM
- 5.0
CMA / ARV
- ARV (median comp)
- $108,000
- List price
- $99,900
- Delta
- -7.50%
- Verdict
- FAIR
- Comps
- 9 within 1.0 mi
Show comp detail 12 sales within ~0.75 mi
| Address | Dist | Beds/Ba | Sqft | Sold | Price | $/sf | Match |
|---|---|---|---|---|---|---|---|
| 8865 E Baseline Rd #715 | 0.09mi | 2/2.0 (+1) | 998 (+4%) | 3mo | $108,000 | $108 | 82 |
| 8865 E Baseline Rd #1416 | 0.05mi | 1/2.0 | 924 (-4%) | 17mo | $67,000 | $73 | 78 |
| 110 S Ellsworth Rd | 0.30mi | 2/2.0 (+1) | 906 (-6%) | 0mo | $192,000 | $212 | 72 |
| 8865 E Baseline Rd #1207 | 0.09mi | 1/1.5 | 1,085 (+13%) | 4mo | $45,000 | $41 | 69 |
| 8865 E Baseline Rd #531 | 0.05mi | 2/2.0 (+1) | 1,032 (+8%) | 16mo | $168,000 | $163 | 67 |
| 8865 E Baseline Rd #446 | 0.05mi | 2/2.0 (+1) | 1,020 (+6%) | 22mo | $173,000 | $170 | 64 |
| 8865 E Baseline Rd #621 | 0.05mi | 2/2.0 (+1) | 1,054 (+10%) | 19mo | $160,000 | $152 | 61 |
| 2206 S Ellsworth Rd Unit 149B | 0.36mi | 2/2.0 (+1) | 1,056 (+10%) | 2mo | $235,000 | $223 | 60 |
| 2206 S Ellsworth Rd Unit 129B | 0.36mi | 2/2.0 (+1) | 1,088 (+13%) | 7mo | $110,000 | $101 | 50 |
| 2206 S Ellsworth Rd Unit 157B | 0.38mi | 2/2.0 (+1) | 1,056 (+10%) | 13mo | $325,000 | $308 | 50 |
| 2550 S Ellsworth Rd #180 | 0.58mi | 2/2.0 (+1) | 1,056 (+10%) | 2mo | $105,000 | $99 | 49 |
| 2550 S Ellsworth Rd #215 | 0.74mi | 2/2.0 (+1) | 1,006 (+5%) | 11mo | $125,000 | $124 | 43 |
Match score weights: distance 35% · size 25% · config 20% · recency 20%. Top-matched comps best support the ARV.
Projected returns pro-forma
1.44% appreciation · 0.54% rent growth · sell at horizon
- IRR
- 27.6%
- Equity multiple
- 2.41×
- Total profit
- $39,456
- Equity at exit
- $36,412
- IRR
- 28.3%
- Equity multiple
- 4.25×
- Total profit
- $91,033
- Equity at exit
- $50,226
Cash invested: $27,972 (down + closing). Projections, not guarantees.
Landlord ↔ Tenant lean methodology
- Overall (STATE)
- 87 Strongly Landlord-Friendly
- State Arizona
- 87 Strongly Landlord-Friendly · R+3
- County
- — inherits STATE
- City
- — inherits STATE
ZIP-level market 85209
- Home prices YoY
- 0.5%
- Rents YoY
- 0.5%
- Active inventory
- 171
- Price-to-rent
- 5.0×
Monthly cashflow live
- Estimated rent
- $1,657 high interval (Pro) →
- Mortgage (P&I)
- −$524
- Tax est. 1.5%
- −$125 /mo · $1,498/yr
- Insurance
- −$42
- HOA
- −$0
- Vacancy / Maint / Mgmt
- −$348
- Net cashflow
- $619
Break-even live
Sensitivity live
| Price | -10% $688 | -5% $653 | +0% $619 | +5% $584 | +10% $550 |
|---|---|---|---|---|---|
| Rent | -10% $488 | -5% $553 | +0% $619 | +5% $684 | +10% $749 |
| Rate | -1.0pp $669 | -0.5pp $644 | base $619 | +0.5pp $593 | +1.0pp $566 |
UW: 25.0% down · 7.5% · 30yr · 1.5% tax · 5.0% vac · 8.0% maint · 8.0% mgmt
Financing live
Cash to close
- Down payment
- $24,975
- Closing costs
- $2,997
- Reserves months
- —
- Total cash needed
- —
Loan-product check · same deal, 3 products live
Conventional
25% down · 7.5% · 30yr
- Down + closing
- —
- Monthly P&I
- —
- Monthly cashflow
- —
- DSCR
- —
- Eligible?
- —
Personal DTI + credit; lowest rate.
DSCR
20% down · 8.5% · 30yr
- Down + closing
- —
- Monthly P&I
- —
- Monthly cashflow
- —
- DSCR
- —
- Eligible?
- —
No personal income docs; deal must DSCR.
Hard money
10% down · 12.0% · 12mo
- Down + closing
- —
- Monthly P&I
- —
- Monthly cashflow
- —
- DSCR
- —
- Eligible?
- —
Short-term bridge; refi at stabilization.
Rent comps 15 comps
| Address | Beds | Baths | Sqft | Rent | $/sqft | DOM | Units | Dist |
|---|---|---|---|---|---|---|---|---|
| 8865 E Baseline Rd #300 Mesa, AZ | 1.0 | 1.0 | 764 | $2,000 | $2.62 | 20d | 1 | 0.05mi |
| 8865 E Baseline Rd #1129 Mesa, AZ | 2.0 | 2.0 | 748 | $3,200 | $4.28 | 6d | 1 | 0.05mi |
| 8865 E Baseline Rd #1028 Mesa, AZ | 2.0 | 1.0 | 1028 | $1,500 | $1.46 | 45d | 1 | 0.09mi |
| 8865 E Baseline Rd #405 Mesa, AZ | 2.0 | 1.5 | 619 | $1,900 | $3.07 | 45d | 1 | 0.17mi |
| 2206 S Ellsworth Rd Unit 3B Mesa, AZ | 2.0 | 2.0 | 976 | $1,606 | $1.65 | 16d | 1 | 0.35mi |
| 2206 S Ellsworth Rd Unit 94B Mesa, AZ | 2.0 | 2.0 | 924 | $3,702 | $4.01 | 25d | 1 | 0.35mi |
| 2206 S Ellsworth Rd Unit 101B Mesa, AZ | 2.0 | 2.0 | 924 | $1,555 | $1.68 | 45d | 1 | 0.35mi |
| 9335 E Baseline Rd Mesa, AZ | 1.0–3.0 | 1.0–2.0 | 1162 | $1,430 | $1.23 | 0d | 12 | 0.66mi |
| 9233 E Neville Ave Mesa, AZ | 2.0–3.0 | 2.0 | 1142 | $1,575 | $1.38 | 16d | 3 | 0.74mi |
| 9233 E Neville Ave Mesa, AZ | 2.0–3.0 | 2.0 | 1145 | $1,575 | $1.37 | 25d | 1 | 0.74mi |
| 8915 E Guadalupe Rd Mesa, AZ | 2.0 | 2.0 | 1054 | $1,390 | $1.32 | 25d | 1 | 0.89mi |
| 8915 E Guadalupe Rd Mesa, AZ | 2.0–3.0 | 2.0 | 971 | $1,390 | $1.43 | 4d | 11 | 0.89mi |
| 8915 E Guadalupe Rd Mesa, AZ | 1.0 | 1.0 | 616 | $1,164 | $1.89 | 45d | 1 | 0.89mi |
| 8433 E Guadalupe Rd Mesa, AZ | 1.0–3.0 | 1.0–2.0 | 936 | $1,549 | $1.65 | 0d | 1 | 1.01mi |
| 2064 S Farnsworth Dr #25 Mesa, AZ | 2.0 | 2.0 | 1011 | $1,595 | $1.58 | 23d | 1 | 1.09mi |
Listing history 16 events
-
2026-06-21days on market $99,900 Active 53 DOM
-
2026-06-18days on market $99,900 Active 50 DOM
-
2026-06-17days on market $99,900 Active 49 DOM
-
2026-06-16days on market $99,900 Active 48 DOM
-
2026-06-15days on market $99,900 Active 47 DOM
-
2026-06-13days on market $99,900 Active 45 DOM
-
2026-06-09days on market $99,900 Active 41 DOM
-
2026-06-08days on market $99,900 Active 40 DOM
-
2026-06-07days on market $99,900 Active 39 DOM
-
2026-06-04days on market $99,900 Active 36 DOM
-
2026-06-03days on market $99,900 Active 35 DOM
-
2026-06-02days on market $99,900 Active 34 DOM
-
2026-06-01days on market $99,900 Active 33 DOM
-
2026-05-31days on market $99,900 Active 32 DOM
-
2026-05-19price $99,900 2223-char remark
-
2026-04-29$115,000 Active 2223-char remark
ⓘ Source: listings_history table (triggers on properties + properties_extension) + one-shot
backfill from property_details.listing_events for pre-trigger history.
Climate risk First Street
- Flood 1/10 Low FEMA zone X (shaded) · 0% chance over 30 yrs
- Wildfire 4/10 Moderate
- Heat 9/10 Extreme 6 d/yr ≥111°F today · 16 d/yr by 30 yrs out
- Wind 1/10 Low
- Air quality 3/10 Moderate 2 unhealthy d/yr today · 3 by 30 yrs out
Nearby sold comps map
Loading sold comps map…
Walkable amenities ~0.75 mi
Loading nearby amenities…
Taxation est. · year 1
- Rental income
- $19,883
- − Mortgage interest
- −$5,596
- − Property taxes
- −$1,498
- − Insurance
- −$500
- − Repairs & maintenance
- −$1,591
- − Management
- −$1,591
- − Depreciation
- −$2,906
- Taxable income
- $6,201
- Est. tax owed @ 24.0%
- −$1,488
- After-tax cash flow
- $5,934/yr
For passive investors: Depreciation is non-cash, so a rental often shows a tax loss while cash-flowing — sheltering income. Rental losses are passive: they offset passive income freely, and up to $25,000/yr can offset ordinary (W-2) income if you actively participate and your MAGI is under $100k (phasing out to $0 by $150k); unused losses carry forward. On sale, claimed depreciation is recaptured at up to 25%, and gains may owe capital-gains tax (a 1031 exchange can defer both). Figures are a year-1 estimate at your 24.0% rate — not tax advice; consult a CPA.
Condition & rehab AI · 12 photos
This home is in good condition with a well-maintained interior and exterior. It has a good potential for value increase with minor cosmetic updates and landscaping improvements.
Value-add opportunities
- Both Painting the exterior siding — Fresh paint can enhance curb appeal and property value.
- Both Landscaping improvements — Enhanced landscaping can attract more potential buyers and renters.
- Both Updating window treatments — Fresh window treatments can improve the home's curb appeal and energy efficiency.
Renovation cost estimate screening
Value-add ROI direction
- Both Painting the exterior siding — Fresh paint can enhance curb appeal and property value. ↑
- Both Landscaping improvements — Enhanced landscaping can attract more potential buyers and renters. ↑
- Both Updating window treatments — Fresh window treatments can improve the home's curb appeal and energy efficiency. ↑
ⓘ Cost ranges are severity-bucket heuristics (US national rule-of-thumb). Get contractor quotes + a written scope before underwriting a rehab budget.
Schools (NCES district)
- District
- Gilbert Unified District (4239)
- NCES district ID
- 0403400
- Math proficiency
- 49% ▼ -8.00%
- Reading proficiency
- 52% ▼ -7.00%
- Median HH income
- $74,715
- Composite
- 45.55/100
- National rank
- #2600
- State rank
- #38 of 249 in AZ
Livability — Mesa
- Score
- 79/100
- State rank
- #6
- US rank
- #2034
Category grades
Schools grade is shown separately in the Schools card above.
Census & demographics
- Census place
- Mesa, AZ
- County
- Maricopa County · 4,537,380 people
- City population
- 555,266
- Metro
- Phoenix-Mesa-Chandler, AZ
- Population (ZIP)
- 43,150
- Household income
- $84,432
- Rent vs Own
- Severe rent burden
- 972.0
Population outlook (Maricopa County) Hauer SSP2
- Today (2025)
- 4,979,203 people
- By 2030
- 5,378,229 · +8.0%
- By 2040
- 6,156,598 · +23.6%
- By 2050
- 6,872,376 · +38.0%
- By 2075
- 8,401,270 · +68.7%
- By 2100
- 9,247,439 · +85.7%
Race, ethnicity, and origin ACS 2023
- Neighborhood character
- Predominantly White (72%)
- Race & ethnicity
- White 72% Hispanic / Latino 15% Two or more races 9% Black 4% Asian 3%
- Hispanic origin (detail)
- Mexican 11%
- Common ancestry
- Portuguese 4% Romanian 3% Lithuanian 3%
- Foreign-born
- 9% · Canada, China, Vietnam
- Languages at home
- 87% English-only · Spanish 9% Tagalog/Filipino 1% Chinese 1%
Political lean MEDSL · Maricopa
- 2024 margin
- Toss-up / Even · D 47.7% · R 51.2% · Other 1.1%
- 2008→2024 swing
- +7.1pp toward D · 2008: -10.6pp · 2024: -3.5pp
- All cycles
- 2024: R+3.5 2020: D+2.2 2016: R+3.5 2012: R+12.0 2008: R+10.6
Not yet ingested
- Civics
- —
Market trends
- HPI YoY
- ▲ 1.44%
- Current HPI
- 277.6198
- Rent YoY
- ▲ 0.54%
- Metro
- Phoenix-Mesa-Chandler, AZ
- State GDP YoY
- ▲ 4.54%
- F500 in state
- 20
Industry mix (Fortune 500 HQ in AZ)
| Industry | F500 HQs | Revenue |
|---|---|---|
| Technology | 2 | $13B |
|
||
| Mining / Metals | 1 | $23B |
|
||
| Environmental Services | 1 | $16B |
|
||
| Metals / Steel | 1 | $14B |
|
||
| Technology Distribution | 1 | $9B |
|
||
| Homebuilding | 1 | $8B |
|
||
Price history
-13.1% since first listed2 events — show timeline
- 2026-05-19 Price Changed $99,900 ARMLS
- 2026-04-29 Listed $115,000 ARMLS
Cash-flow waterfall
monthlySold comps — $/sqft
last 12 mo · ≤1 miLoading sold comps…