 Multi-family
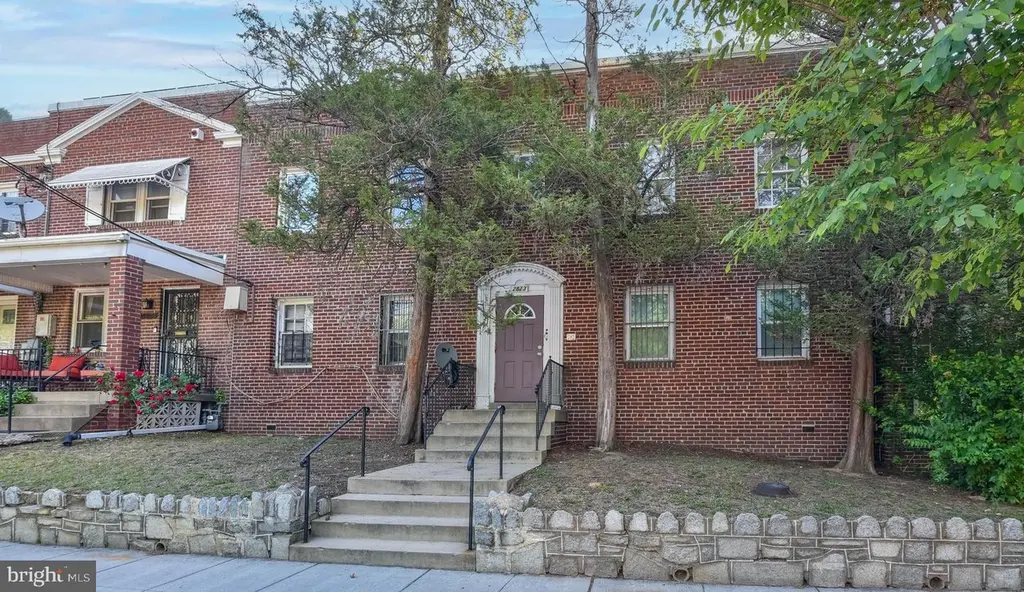
2823 4th St NE · Washington, DC
Flood risk 1/10 · Minimal
- FEMA flood zone
- X (unshaded)
- Chance of flooding over 30 yrs
- 0.0%
- Est. flood insurance / yr
- $507 – $1,088
Fire risk 1/10 · Minimal
- Est. fire insurance / yr
- $631 – $1,173
Heat risk 7/10 · Major
- Hot days now (above 106°F)
- 7 days/yr
- Hot days in 30 yrs
- 15 days/yr
Wind risk 4/10 · Minor
- Chance of severe wind over 30 yrs
- 19.0%
Air-quality risk 4/10 · Minor
- Unhealthy air days now
- 4 days/yr
- Unhealthy air days in 30 yrs
- 5 days/yr
Risk factors via First Street. Map © Google.
Why this score? — see what drove the B- grade
The composite is a weighted blend of 9 inputs, each scored 0–100. Each bar is that input's sub-score; the figure is the points it added to the 100-point composite (weight × sub-score).
- Cash flow +30.0/30.0
- 1% rule +10.0/10.0
- DSCR +10.0/10.0
- ARV discount +7.5/15.0
- Livability +3.7/5.0
- Schools +3.6/10.0
- Condition / age +2.5/5.0
- Rent growth +1.7/5.0
- Appreciation +0.0/10.0
$550,000
🖨 Deal sheet (PDF) 📄 Offer letter ✓ Due diligence
Multi-family units
County records classify this as Multi-Family (2-4 Unit). Listing-text estimate: 1 unit. estimate disagrees with records
Listing remarks
OPEN HOUSE MONDAY, JUNE 1, 2026 FROM 11:30 AM - 12:30 PM List price is opening bid. Online Auction Only! Bidding begins Saturday, May 30th, and ends Thursday, June 4, 2026 at 1:00PM. Four-unit multifamily brick-front building located in the desirable Brookland neighborhood of Northeast Washington, DC. The two-level property contains approximately 3,480± square feet of living space, per Washington D. C. tax record. Currently vacant, the property offers a versatile opportunity for either an owner-occupant to reside in one unit while leasing the remaining units for supplemental income, or for an investor seeking a strong rental income opportunity. Location: Brookland is a historic neigh
Key facts
- 4,052 sq ft lot
- Built 1941
- Listed 28 days
Tags
Property features AI
Exterior
- Parking: On-street parking
- Utilities: Public water; Public sewer; Natural gas hot water
- Home design: Interior townhouse / rowhouse; Fee simple ownership
- Construction: Brick construction
- Exterior features: No tidal water; Other above- and below-grade structures
Interior
- Bedrooms: Four one-bedroom units
- Heating & cooling: Hot water heating; Natural gas heating fuel
- Interior features: Two or more access exits
Neighborhood map
What this means for you Summary
Snapshot
- This is a 8-bed/4.0-bath multifamily listed at $550k.
Deal economics
- At list price, monthly cash flow is $3k ($40k/yr) — positive.
- The deal already cash-flows at list — no discount required.
- Meets the 1% rule at list price ($9k rent vs $550k).
- Recommended offer: $542k (1.5% below list) — sets the bar for market timing.
- Cap rate 13.6% vs local median 2.5% in Washington — top-decile yield for the area; either an underpriced asset or a hidden risk that comps aren't pricing in. Stress-test before assuming the spread holds.
Location & tenants
- Location reads 73/100 on livability (#1 in DC) — a middle-class / working-renter tenant base. Strengths: amenities A+, commute A+, employment A+; Watch: crime F, cost of living F.
- District Of Columbia Public Schools (urban): math 33% / reading 40% proficiency, ranked #8 of 32 in DC (top 25%) — families likely to look elsewhere, expect single-tenant / working-renter base with shorter leases; 65% free/reduced lunch — lower-income household profile, screen leases tightly.
- Zoned schools: Noyes Es (241 students, 0% FRL); Brookland Ms (357 students, 0% FRL); Dunbar Hs (868 students, 0% FRL) — zoned schools average 0% FRL vs 65% district-wide (65 pts lower); this property's tenant base skews higher-income than the district average.
- Market conditions: Rents falling (-3.0%/yr); 558 active listings in the ZIP; 1 comparable units currently listed for rent nearby; high-income renter base; 1,737 units permitted in District of Columbia in 2024 (1,506 in 5+ unit buildings).
- At $9,033/mo this rent would consume 90% of the median local household income ($120k/yr) (locally 3854% of renters already pay >50% of income on rent) — very limited rent-growth headroom before tenants either downsize or default.
Forward outlook
- Local home prices are declining (-3.0%/yr); year-one equity from $4k of loan paydown is wiped out by about $16k of value loss. Plan a longer hold.
- District of Columbia County population projected at +50% by 2050 — long-run rental-demand tailwind backs the buy-and-hold thesis.
- At projected returns (-3.0% appreciation + 0.0% rent growth), your $154k cash investment doubles in ~6 years — after that, you're playing with house money.
Negotiation context
- It's been on market 28 days — a 2% lower offer ($542k) is reasonable based on typical stale-listing flexibility.
- Current owner paid $35k; list at $550k implies a 1471% gain — meaningful room to come down on a strong offer.
Risks & watch-outs
- Watch-outs: built in 1941 — expect roof / HVAC / electrical / plumbing capex.
- Climate carrying-cost: extreme-heat days projected 7→15/yr by 2055 (HVAC capex compounding) — expect insurance premiums to compound above CPI over the hold.
Questions for the listing agent
- Built in 1941 — when were the roof, HVAC, electrical panel, plumbing, and water heater last replaced?
- Is there a deadline driving the sale (1031 exchange, divorce, estate, relocation)? That informs how much negotiation room exists.
- Crime grade is F in this area — have there been break-ins, vandalism, or insurance claims at this property in the last 3 years? What carrier currently insures it and at what premium?
- What's the average days-on-market for RENTAL listings here right now (not sales)? A rising rental-DOM trend means longer vacancies and softer asking-rent achievability than the comps imply.
- What's the recent tenant-quality profile in this submarket — average credit score on applications, eviction rate, late-payment / NSF rate, and stable-employment percentage? A property-management company in the area should have these aggregated.
- How much new apartment / multifamily construction is in the pipeline within 1–3 miles? Heavy new supply (>2% of stock underway) typically softens rents 12–24 months out; light construction supports rent growth.
Investment metrics
- 1% rule
- 1.64% ✓
- Cap rate
- 13.58%
- Cash-on-cash
- 26.02%
- DSCR
- 2.16
- GRM
- 5.1
CMA / ARV
No comps found within radius.
Projected returns pro-forma
-3.0% appreciation · 0.0% rent growth · sell at horizon
- IRR
- 16.3%
- Equity multiple
- 1.63×
- Total profit
- $97,242
- Equity at exit
- $82,007
- IRR
- 22.6%
- Equity multiple
- 2.67×
- Total profit
- $256,804
- Equity at exit
- $47,554
Cash invested: $154,000 (down + closing). Projections, not guarantees.
Landlord ↔ Tenant lean methodology
- Overall (CITY)
- 0 Strongly Tenant-Friendly
- State District of Columbia
- 12 Strongly Tenant-Friendly · D+43
- County
- — inherits STATE
- City Washington
- 0 Strongly Tenant-Friendly · D+43
ZIP-level market 20002
- Rents YoY
- -3.0%
- Active inventory
- 558
- Price-to-rent
- 20.3×
Monthly cashflow live
- Estimated rent
- $9,033 high interval (Pro) →
- Mortgage (P&I)
- −$2,884
- Tax from tax record
- −$683 /mo · $8,196/yr
- Insurance
- −$229
- HOA
- −$0
- Vacancy / Maint / Mgmt
- −$1,897
- Net cashflow
- $3,340
Break-even live
Sensitivity live
| Price | -10% $3,651 | -5% $3,495 | +0% $3,340 | +5% $3,184 | +10% $3,028 |
|---|---|---|---|---|---|
| Rent | -10% $2,626 | -5% $2,983 | +0% $3,340 | +5% $3,696 | +10% $4,053 |
| Rate | -1.0pp $3,617 | -0.5pp $3,480 | base $3,340 | +0.5pp $3,197 | +1.0pp $3,052 |
4-unit breakdown (identical units grouped — click to expand)
| Units | Beds | Baths | Est. rent |
|---|---|---|---|
| 4× units | 2 | 1 | $9,032 |
| #1 | 2 | 1 | $2,258 |
| #2 | 2 | 1 | $2,258 |
| #3 | 2 | 1 | $2,258 |
| #4 | 2 | 1 | $2,258 |
| Total (4 units) | $9,033 | ||
UW: 25.0% down · 7.5% · 30yr · 1.5% tax · 5.0% vac · 8.0% maint · 8.0% mgmt
Financing live
Cash to close
- Down payment
- $137,500
- Closing costs
- $16,500
- Reserves months
- —
- Total cash needed
- —
Loan-product check · same deal, 3 products live
Conventional
25% down · 7.5% · 30yr
- Down + closing
- —
- Monthly P&I
- —
- Monthly cashflow
- —
- DSCR
- —
- Eligible?
- —
Personal DTI + credit; lowest rate.
DSCR
20% down · 8.5% · 30yr
- Down + closing
- —
- Monthly P&I
- —
- Monthly cashflow
- —
- DSCR
- —
- Eligible?
- —
No personal income docs; deal must DSCR.
Hard money
10% down · 12.0% · 12mo
- Down + closing
- —
- Monthly P&I
- —
- Monthly cashflow
- —
- DSCR
- —
- Eligible?
- —
Short-term bridge; refi at stabilization.
Rent comps 1 comps
| Address | Beds | Baths | Sqft | Rent | $/sqft | DOM | Units | Dist |
|---|---|---|---|---|---|---|---|---|
| 749 Princeton Pl NW Washington, DC | 7.0 | 3.0 | 2493 | $9,500 | $3.81 | 24d | 1 | 1.40mi |
Listing history 10 events
-
2026-06-09days on market $550,000 Active 28 DOM
-
2026-06-08days on market $550,000 Active 27 DOM
-
2026-06-07days on market $550,000 Active 26 DOM
-
2026-06-04days on market $550,000 Active 23 DOM
-
2026-06-03days on market $550,000 Active 22 DOM
-
2026-06-02days on market $550,000 Active 21 DOM
-
2026-06-01days on market $550,000 Active 20 DOM
-
2026-05-31days on market $550,000 Active 19 DOM
-
2026-05-12$550,000 Active
-
1976-08-04soldstatus $35,019
ⓘ Source: listings_history table (triggers on properties + properties_extension) + one-shot
backfill from property_details.listing_events for pre-trigger history.
Tax reassessment forecast DC · Partial reset (capped growth)
- Current annual tax
- $8,196 · $683/mo
- Projected year-2 tax
- $8,196 · $683/mo
- Expected delta
- $0/yr ($0/mo · 0.0%)
ⓘ Screening estimate from a state-policy table — verify with the county assessor before closing.
Climate risk First Street
- Flood 1/10 Low FEMA zone X (unshaded) · 0% chance over 30 yrs
- Wildfire 1/10 Low
- Heat 7/10 Severe 7 d/yr ≥106°F today · 15 d/yr by 30 yrs out
- Wind 4/10 Moderate 19% chance of damaging wind over 30 yrs
- Air quality 4/10 Moderate 4 unhealthy d/yr today · 5 by 30 yrs out
Nearby sold comps map
Loading sold comps map…
Walkable amenities ~0.75 mi
Loading nearby amenities…
Taxation est. · year 1
- Rental income
- $108,396
- − Mortgage interest
- −$30,809
- − Property taxes
- −$8,196
- − Insurance
- −$2,750
- − Repairs & maintenance
- −$8,672
- − Management
- −$8,672
- − Depreciation
- −$16,000
- Taxable income
- $33,298
- Est. tax owed @ 24.0%
- −$7,992
- After-tax cash flow
- $32,084/yr
For passive investors: Depreciation is non-cash, so a rental often shows a tax loss while cash-flowing — sheltering income. Rental losses are passive: they offset passive income freely, and up to $25,000/yr can offset ordinary (W-2) income if you actively participate and your MAGI is under $100k (phasing out to $0 by $150k); unused losses carry forward. On sale, claimed depreciation is recaptured at up to 25%, and gains may owe capital-gains tax (a 1031 exchange can defer both). Figures are a year-1 estimate at your 24.0% rate — not tax advice; consult a CPA.
Schools (NCES district)
- District
- District Of Columbia Public Schools
- NCES district ID
- 1100030
- Math proficiency
- 33% ▲ 3.00%
- Reading proficiency
- 40% ▲ 5.00%
- Median HH income
- $67,671
- Composite
- 35.84/100
- National rank
- #9606
- State rank
- #8 of 32 in DC
Livability — Washington
- Score
- 73/100
- State rank
- #1
- US rank
- #5327
Category grades
Schools grade is shown separately in the Schools card above.
Census & demographics
- Census place
- Washington, DC
- County
- District of Columbia · 671,873 people
- City population
- 671,873
- Metro
- Washington-Arlington-Alexandria, DC-VA-MD-WV
- Population (ZIP)
- 72,397
- Household income
- $120,337
- Rent vs Own
- Severe rent burden
- 3854.0
Population outlook (District of Columbia County) Hauer SSP2
- Today (2025)
- 821,926 people
- By 2030
- 899,517 · +9.4%
- By 2040
- 1,061,162 · +29.1%
- By 2050
- 1,231,493 · +49.8%
- By 2075
- 1,603,312 · +95.1%
- By 2100
- 1,847,141 · +124.7%
Race, ethnicity, and origin ACS 2023
- Neighborhood character
- Diverse neighborhood (Simpson 0.66)
- Race & ethnicity
- White 41% Black 40% Two or more races 9% Hispanic / Latino 9% Asian 3%
- Hispanic origin (detail)
- Mexican 2%
- Common ancestry
- Romanian 3% Lithuanian 2% Italian 2%
- Foreign-born
- 9% · Canada, China, South Korea
- Languages at home
- 87% English-only · Spanish 5% French/Haitian/Cajun 2% Other Indo-European 1%
Political lean MEDSL · District of Columbia
- 2024 margin
- Solid D (+86.1) · D 91.2% · R 5.1% · Other 3.8%
- 2008→2024 swing
- +0.1pp no change · 2008: 85.9pp · 2024: 86.1pp
- All cycles
- 2024: D+86.1 2020: D+86.8 2016: D+88.7 2012: D+84.2 2008: D+85.9
Not yet ingested
- Civics
- —
Market trends
- HPI YoY
- ▼ -852.61%
- Current HPI
- 396.6033
- Rent YoY
- ▼ -3.04%
- Metro
- Washington-Arlington-Alexandria, DC-VA-MD-WV
- State GDP YoY
- ▲ 1.33%
- F500 in state
- 6
Industry mix (Fortune 500 HQ in DC)
| Industry | F500 HQs | Revenue |
|---|---|---|
| Financial Services | 1 | $153B |
|
||
| Life Sciences / Industrials | 1 | $25B |
|
||
| Industrial Machinery | 1 | $8B |
|
||
Price history
+1470.6% since first listed2 events — show timeline
- 2026-05-12 Listed $550,000 BRIGHT MLS
- 1976-08-04 Sold (Public Records) $35,019 Public Records
Property tax history
+4.7%/yrLatest (2025): $8,196 · +3.4% YoY. Source: county tax records.
Cash-flow waterfall
monthlySold comps — $/sqft
last 12 mo · ≤1 miLoading sold comps…