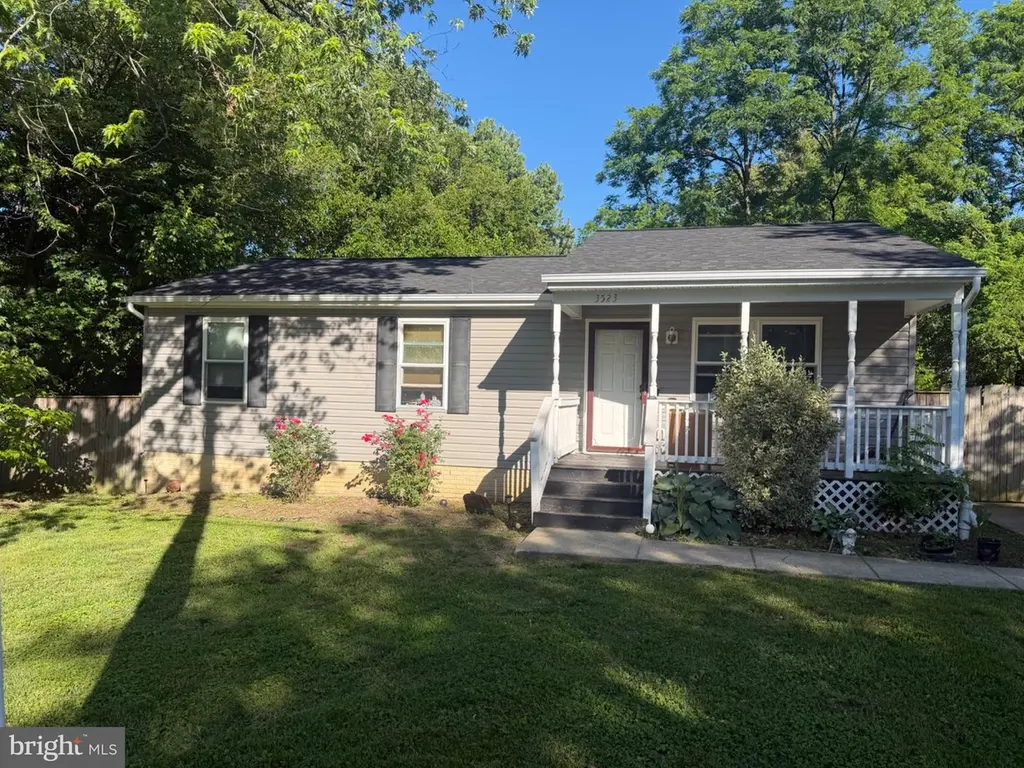
3523 Spring Rd · Maryland City, MD
Flood risk 1/10 · Minimal
- FEMA flood zone
- X (unshaded)
- Chance of flooding over 30 yrs
- 0.0%
- Est. flood insurance / yr
- $507 – $1,088
Fire risk 3/10 · Minor
- Est. fire insurance / yr
- $755 – $1,403
Heat risk 7/10 · Major
- Hot days now (above 104°F)
- 7 days/yr
- Hot days in 30 yrs
- 15 days/yr
Wind risk 4/10 · Minor
- Chance of severe wind over 30 yrs
- 19.0%
Air-quality risk 4/10 · Minor
- Unhealthy air days now
- 4 days/yr
- Unhealthy air days in 30 yrs
- 5 days/yr
Risk factors via First Street. Map © Google.
Why this score? — see what drove the D- grade
The composite is a weighted blend of 9 inputs, each scored 0–100. Each bar is that input's sub-score; the figure is the points it added to the 100-point composite (weight × sub-score).
- ARV discount +11.0/15.0
- Cash flow +8.1/30.0
- Rent growth +4.0/5.0
- Livability +3.8/5.0
- Appreciation +3.5/10.0
- Schools +2.9/10.0
- Condition / age +2.5/5.0
- DSCR +2.2/10.0
- 1% rule +1.8/10.0
$385,500
🖨 Deal sheet 📄 Offer letter ✓ Due diligence
Listing remarks
More photographs coming soon! Nestled in the charming Maryland City, this exquisite traditional home offers a perfect blend of comfort and elegance. Built in 1999, this detached residence boasts a timeless brick and vinyl siding exterior, inviting you into a world of refined living. With three spacious bedrooms and two full bathrooms, this home is designed for both relaxation and entertaining. Step inside to discover a warm and inviting atmosphere, where natural light dances through the windows, illuminating the thoughtfully designed spaces. The main floor laundry adds convenience to your daily routine, while the open layout encourages seamless flow between living areas. The generous lot si
Key facts
- 0.23 acre lot
- Built 1999
- Listed 4 days
Property features AI
Exterior
- Parking: Driveway parking
- Utilities: Public water; Public sewer (listed alongside public septic); Natural gas for heating and hot water; Electric for cooling
- Home design: Detached property; Ownership: Fee simple
- Construction: Brick and vinyl siding exterior; Crawl space foundation; Year built is estimated
- Exterior features: Driveway; Above-grade other structures
Interior
- Bedrooms: Three bedrooms on the main level
- Bathrooms: Two full bathrooms (both on the main level)
- Heating & cooling: Hot water heating; Central air conditioning (electric)
- Interior features: Living area square footage is an estimate; No basement
- Laundry & utility: Main-floor laundry with washer and dryer in unit
Neighborhood map
What this means for you Summary
Snapshot
- This is a 3-bed/1.5-bath single-family listed at $386k.
Deal economics
- At list price, monthly cash flow is $-370 ($-4k/yr) — negative.
- To cash-flow at today's rent, offer at most $320k (17.0% below list).
- To meet the 1% rule (rent ≥ 1% of price), the offer needs to be $260k (32.5% below list).
- Recommended offer: $260k (32.5% below list) — sets the bar for 1% rule.
- Cap rate 5.1% vs local median 3.4% in Maryland City — top-decile yield for the area; either an underpriced asset or a hidden risk that comps aren't pricing in. Stress-test before assuming the spread holds.
Location & tenants
- Location reads 75/100 on livability (#108 in MD, #4,306 nationally) — a middle-class / working-renter tenant base. Strengths: employment A+, housing A+, health & safety A+; Watch: crime C-, schools D-, commute F.
- Anne Arundel County Public Schools (suburban): math 20% / reading 37% proficiency, ranked #10 of 24 in MD (top 42%) — low school quality limits family demand, transient renter base, plan for 1-2y turnover.
- Market conditions: Rents rising fast (+5.8%/yr); 129 active listings in the ZIP; 14 comparable units currently listed for rent nearby; rentals lingering (median 44d on market — plan ~5-8 weeks vacancy on turnover, expect pricing pressure); 50% of comp listings sitting > 30 days — soft ceiling on asking rent; high-income renter base; 1,303 units permitted in Anne Arundel County in 2024 (299 in 5+ unit buildings).
Forward outlook
- Local home prices are declining (-3.0%/yr); year-one equity from $3k of loan paydown is wiped out by about $12k of value loss. Plan a longer hold.
- Anne Arundel County population projected at +17% by 2050 — long-run rental-demand tailwind backs the buy-and-hold thesis.
Negotiation context
- Only 4 days on market — expect competitive offers; lowballing is unlikely to land.
- Current owner paid $68k; list at $386k implies a 467% gain — meaningful room to come down on a strong offer.
Risks & watch-outs
- Climate carrying-cost: extreme-heat days projected 7→15/yr by 2055 (HVAC capex compounding) — expect insurance premiums to compound above CPI over the hold.
Questions for the listing agent
- What do current leases actually rent for vs. the listed asking? Can we see a recent rent roll and the last 12 months of T-12 income?
- Is there a deadline driving the sale (1031 exchange, divorce, estate, relocation)? That informs how much negotiation room exists.
- Schools are D-rated, which usually means shorter tenancies and higher turnover. Who's the typical renter profile here, and what's been the actual vacancy rate?
- The area grade is low — what's the realistic commute time and amenity access for the typical tenant pool here? Any planned neighborhood developments (good or bad) we should know about?
- What's the average days-on-market for RENTAL listings here right now (not sales)? A rising rental-DOM trend means longer vacancies and softer asking-rent achievability than the comps imply.
- What's the recent tenant-quality profile in this submarket — average credit score on applications, eviction rate, late-payment / NSF rate, and stable-employment percentage? A property-management company in the area should have these aggregated.
- How much new for-sale + rental construction is in the pipeline within 1–3 miles? Heavy new supply typically softens prices + rents 12–24 months out; constrained supply supports both.
Investment metrics
- 1% rule
- 0.68% ✗
- Cap rate
- 5.14%
- Cash-on-cash
- -4.11%
- DSCR
- 0.82
- GRM
- 12.3
CMA / ARV
- ARV (median comp)
- $417,748
- List price
- $385,500
- Delta
- -7.72%
- Verdict
- FAIR
- Comps
- 14 within 1.0 mi
Show comp detail 1 sale within ~0.75 mi
| Address | Dist | Beds/Ba | Sqft | Sold | Price | $/sf | Match |
|---|---|---|---|---|---|---|---|
| 229 Old Line Ave | 0.68mi | 3/2.0 | 1,248 (+10%) | 1mo | $477,000 | $382 | 49 |
Match score weights: distance 35% · size 25% · config 20% · recency 20%. Top-matched comps best support the ARV.
Projected returns pro-forma
-3.0% appreciation · 5.84% rent growth · sell at horizon
- IRR
- -20.5%
- Equity multiple
- 0.27×
- Total profit
- $-78,499
- Equity at exit
- $57,479
- IRR
- -8.9%
- Equity multiple
- 0.39×
- Total profit
- $-65,877
- Equity at exit
- $33,331
Cash invested: $107,940 (down + closing). Projections, not guarantees.
Landlord ↔ Tenant lean methodology
- Overall (STATE)
- 27 Tenant-Leaning
- State Maryland
- 27 Tenant-Leaning · D+14
- County
- — inherits STATE
- City
- — inherits STATE
ZIP-level market 20724
- Home prices YoY
- -1.1%
- Rents YoY
- 5.8%
- Active inventory
- 129
- Price-to-rent
- 12.3×
Monthly cashflow live
- Estimated rent
- $2,602 high interval (Pro) →
- Mortgage (P&I)
- −$2,022
- Tax from tax record
- −$244 /mo · $2,925/yr
- Insurance
- −$161
- HOA
- −$0
- Vacancy / Maint / Mgmt
- −$547
- Net cashflow
- $-370
Break-even live
UW: 25.0% down · 7.5% · 30yr · 1.5% tax · 5.0% vac · 8.0% maint · 8.0% mgmt
Financing live
Cash to close
- Down payment
- $96,375
- Closing costs
- $11,565
- Reserves months
- —
- Total cash needed
- —
Loan-product check · same deal, 3 products live
Conventional
25% down · 7.5% · 30yr
- Down + closing
- —
- Monthly P&I
- —
- Monthly cashflow
- —
- DSCR
- —
- Eligible?
- —
Personal DTI + credit; lowest rate.
DSCR
20% down · 8.5% · 30yr
- Down + closing
- —
- Monthly P&I
- —
- Monthly cashflow
- —
- DSCR
- —
- Eligible?
- —
No personal income docs; deal must DSCR.
Hard money
10% down · 12.0% · 12mo
- Down + closing
- —
- Monthly P&I
- —
- Monthly cashflow
- —
- DSCR
- —
- Eligible?
- —
Short-term bridge; refi at stabilization.
Rent comps 14 comps
| Address | Beds | Baths | Sqft | Rent | $/sqft | DOM | Units | Dist |
|---|---|---|---|---|---|---|---|---|
| 3525 Laurel View Ct Laurel, MD | 2.0 | 2.0 | 1380 | $2,500 | $1.81 | 24d | 1 | 0.24mi |
| 3109 River Bend Ct Unit D202 Laurel, MD | 2.0 | 2.0 | 1038 | $2,150 | $2.07 | 3d | 1 | 0.53mi |
| 3109 River Bend Ct Laurel, MD | 2.0 | 2.0 | 1038 | $2,150 | $2.07 | 43d | 1 | 0.53mi |
| 8604 Fire Rock Rd Laurel, MD | 3.0 | 2.5 | 1262 | $2,400 | $1.90 | 43d | 1 | 0.54mi |
| 3110 River Bend Ct Unit G101 Laurel, MD | 2.0 | 2.0 | 1150 | $2,300 | $2.00 | 43d | 1 | 0.56mi |
| 3408 Littleleaf Pl Laurel, MD | 3.0 | 2.5 | 1368 | $2,900 | $2.12 | 43d | 1 | 0.61mi |
| 3527 Piney Woods Pl Unit H002 Laurel, MD | 2.0 | 2.0 | 1156 | $2,200 | $1.90 | 18d | 1 | 0.67mi |
| 3523 Piney Woods Pl Laurel, MD | 2.0 | 2.0 | 1039 | $2,100 | $2.02 | 43d | 1 | 0.69mi |
| 249 Sycamore Ridge Rd Laurel, MD | 2.0 | 2.5 | 1421 | $2,500 | $1.76 | 43d | 1 | 0.75mi |
| 8500 Summit View Rd Laurel, MD | 1.0–3.0 | 1.0–2.0 | 1033 | $3,016 | $2.92 | 2d | 38 | 1.02mi |
| 7903 Orion Cir Laurel, MD | 1.0–3.0 | 1.0–2.0 | 1277 | $3,320 | $2.60 | 1d | 28 | 1.07mi |
| 8185 Scenic Meadow Dr Laurel, MD | 1.0–3.0 | 1.0–2.0 | 1131 | $2,895 | $2.56 | 2d | 1 | 1.11mi |
| 9713 Queen Annes Lace Laurel, MD | 1.0–3.0 | 1.0–2.0 | 1114 | $2,275 | $2.04 | 43d | 1 | 1.24mi |
| 10095 Washington Blvd N Laurel, MD | 1.0–2.0 | 1.0–2.0 | 890 | $2,157 | $2.42 | 2d | 4 | 1.27mi |
Listing history 4 events
-
2026-06-07days on market $385,500 Active 4 DOM
-
2026-06-04status $385,500 Active 1 DOM
-
2026-05-11historical $385,500 1367-char remark
-
1999-05-14soldstatus $68,000
ⓘ Source: listings_history table (triggers on properties + properties_extension) + one-shot
backfill from property_details.listing_events for pre-trigger history.
Tax reassessment forecast MD · Partial reset (capped growth)
- Current annual tax
- $2,925 · $244/mo
- Projected year-2 tax
- $3,564 · $297/mo
- Expected delta
- +$638/yr (+$53/mo · 21.8%)
ⓘ Screening estimate from a state-policy table — verify with the county assessor before closing.
Climate risk First Street
- Flood 1/10 Low FEMA zone X (unshaded) · 0% chance over 30 yrs
- Wildfire 3/10 Moderate
- Heat 7/10 Severe 7 d/yr ≥104°F today · 15 d/yr by 30 yrs out
- Wind 4/10 Moderate 19% chance of damaging wind over 30 yrs
- Air quality 4/10 Moderate 4 unhealthy d/yr today · 5 by 30 yrs out
Nearby sold comps map
Loading sold comps map…
Walkable amenities ~0.75 mi
Loading nearby amenities…
Taxation est. · year 1
- Rental income
- $31,229
- − Mortgage interest
- −$21,594
- − Property taxes
- −$2,925
- − Insurance
- −$1,928
- − Repairs & maintenance
- −$2,498
- − Management
- −$2,498
- − Depreciation
- −$11,215
- Taxable loss
- −$11,429
- Est. tax savings @ 24.0%
- +$2,743
- After-tax cash flow
- $-1,698/yr
For passive investors: Depreciation is non-cash, so a rental often shows a tax loss while cash-flowing — sheltering income. Rental losses are passive: they offset passive income freely, and up to $25,000/yr can offset ordinary (W-2) income if you actively participate and your MAGI is under $100k (phasing out to $0 by $150k); unused losses carry forward. On sale, claimed depreciation is recaptured at up to 25%, and gains may owe capital-gains tax (a 1031 exchange can defer both). Figures are a year-1 estimate at your 24.0% rate — not tax advice; consult a CPA.
Schools (NCES district)
- District
- Anne Arundel County Public Schools
- NCES district ID
- 2400060
- Math proficiency
- 20% ▼ -21.00%
- Reading proficiency
- 37% ▼ -13.00%
- Median HH income
- $87,880
- Composite
- 28.52/100
- National rank
- #6733
- State rank
- #10 of 24 in MD
Livability — Maryland City
- Score
- 75/100
- State rank
- #108
- US rank
- #4306
Category grades
Schools grade is shown separately in the Schools card above.
Census & demographics
- Census place
- Maryland City, MD
- County
- Anne Arundel County · 535,653 people
- Metro
- Baltimore-Columbia-Towson, MD
- Population (ZIP)
- 19,369
- Household income
- $118,115
- Rent vs Own
- Severe rent burden
- 614.0
Population outlook (Anne Arundel County) Hauer SSP2
- Today (2025)
- 617,384 people
- By 2030
- 642,094 · +4.0%
- By 2040
- 686,621 · +11.2%
- By 2050
- 723,031 · +17.1%
- By 2075
- 809,346 · +31.1%
- By 2100
- 837,658 · +35.7%
Race, ethnicity, and origin ACS 2023
- Neighborhood character
- Diverse neighborhood (Simpson 0.69)
- Race & ethnicity
- Black 43% Hispanic / Latino 24% White 24% Native American 8% Asian 7% Two or more races 6%
- Hispanic origin (detail)
- Mexican 3% Puerto Rican 3%
- Common ancestry
- Romanian 2% Italian 1% Lithuanian 1%
- Foreign-born
- 24% · Canada, Jamaica, Philippines
- Languages at home
- 69% English-only · Spanish 20% Other Indo-European 2% Chinese 1%
Political lean MEDSL · Anne Arundel
- 2024 margin
- D (+13.9) · D 55.7% · R 41.7% · Other 2.6%
- 2008→2024 swing
- +15.7pp toward D · 2008: -1.8pp · 2024: 13.9pp
- All cycles
- 2024: D+13.9 2020: D+14.5 2016: D+0.7 2012: R+0.9 2008: R+1.8
Not yet ingested
- Civics
- —
Market trends
- HPI YoY
- ▼ -3.04%
- Current HPI
- 269.7445
- Rent YoY
- ▲ 5.84%
- Metro
- Baltimore-Columbia-Towson, MD
- State GDP YoY
- ▲ 2.97%
- F500 in state
- 12
Industry mix (Fortune 500 HQ in MD)
| Industry | F500 HQs | Revenue |
|---|---|---|
| Aerospace / Defense | 1 | $71B |
|
||
| Utilities | 1 | $25B |
|
||
| Hotels | 1 | $24B |
|
||
| Consumer Goods | 1 | $7B |
|
||
| Real Estate | 1 | $6B |
|
||
| Chemicals | 1 | $2B |
|
||
Price history
5 events — show timeline
- 2026-06-08 Listing Removed — BRIGHT MLS
- 2026-06-03 Relisted — BRIGHT MLS
- 2026-05-21 Listed — BRIGHT MLS
- 2026-05-11 Coming Soon — BRIGHT MLS
- 1999-05-14 Sold (Public Records) $68,000 Public Records
Property tax history
+3.9%/yrLatest (2025): $2,925 · +1.8% YoY. Source: county tax records.
Cash-flow waterfall
monthlySold comps — $/sqft
last 12 mo · ≤1 miLoading sold comps…